概要
ECK (Elastic Cloud on Kubernetes) でオンプレ Kubernetes 上に構築した ElasticStack に Network 用の filebeat を追加して、
Network 機器の Netflow と Firewallログ (Syslog) の可視化を実施した
オンプレ Netowrk 機器でのトラフィック・ログの可視化が可能になった
今回は自宅ラボでの EdgeRouter ログを対象にしたが、後述の通り、module を変えることにより、cisco, PaloAlto 機器にも対応可能である
Elastic の Subscriptions は Basic 範囲で利用し、全て無料の範囲で実施している
netflow 可視化例
他の表示例についても後に掲載する
実施環境
ElasticStack
オンプレ Kubernetes クラスタ上に ECK で構築した ElasticStack に機能を追加する
詳細は下記URLに記載している
今回は Network 向けに Filebeat を追加する形で実施する
Version は、 7.6.0 を使用する
Network 機器
Ubiquiti Networks 製の EdgeRouter X (ER-X) を対象に可視化する
- Vyatta ベースの OS で動く Router で、Amazon で ¥9,999 (2020.03.15時点) でとてもコスパがいい
- Netflow を生成可能
- filebeat の iptables module が Ubiquiti firewalls (Ubiquiti Networks 製の Firewall のログ) に対応している

Netflow, Syslog 設定も該当箇所については簡易的に記載する
全体構成概要
リソース全体の整理のために全体の概要図を記載する。 (ServiceAccount, Role, ConfigMap など一部は省略している)
Kubernetes クラスタ外部からは Kibana へのアクセスと、 今回作成の Filebeat での Netflow, Syslog 受信となる(オレンジ線)

マニフェスト別(yaml)は下記のとおり

今回は赤文字のマニフェストについて本稿では記載する
青文字のマニフェスト箇所は下記で記載している
- kibana.yaml
-
https://qiita.com/suzuyui/items/8f53a80edf2b32d45be2
- その他に記載のものに LoadbalancerIP を追加したもの
-
https://qiita.com/suzuyui/items/8f53a80edf2b32d45be2
- iscsi.yaml
-
https://qiita.com/suzuyui/items/0efa505f3db03390f181
- PV として iscsi / QNAP で構築した場合の例
-
https://qiita.com/suzuyui/items/0efa505f3db03390f181
- その他(ElasticStack全体)
Network 機器向け Filebeat 構築
Netflow と Firewall のログ (syslog) を可視化する Filebeat と、
Kubernetes クラスタ外部から netflow/syslog を受信するための Service を作成する
最初に netflow/firewallログ 設定に関する module 設定箇所を記載し、次に Service設定 を記載し、最後に yaml 全体 を記載する
module 設定
module は下記の2つを使用する.
今回は EdgeRouter のため iptables を使用するが、
補足として cisco, paloalto に変更する場合についても記載する
- netflow
- netflow 対応モジュール. 直接受信できる
- netflow_port: 2055
- netflow での標準ポートを指定している
- 受信ポートを変更したい場合は、ここで変更可能
- netflow_port: 2055
- 詳細: https://www.elastic.co/guide/en/beats/filebeat/7.6/filebeat-module-netflow.html
- netflow 対応モジュール. 直接受信できる
- iptables
- iptables の syslog 対応モジュール. 直接受信または保存ログを指定できる
- 今回は直接 port で受信して処理する
- syslog_port: 514
- syslog 標準ポートを指定している
- 受信ポートを変更したい場合は、ここで変更可能
- syslog_port: 514
- 詳細: https://www.elastic.co/guide/en/beats/filebeat/7.6/filebeat-module-iptables.html
    filebeat.modules:
      - module: netflow
        log:
          enabled: true
          var:
            netflow_host: 0.0.0.0
            netflow_port: 2055
      - module: iptables
        log:
          enabled: true
          var:
            syslog_host: 0.0.0.0
            syslog_port: 514
            convert_timezone: true
cisco を使用する場合
今回使用する上記の module 設定のうち、module: iptables 箇所を下記に変更する
      - module: cisco
        asa:
          enabled: true
          var.syslog_host: 0.0.0.0
          var.syslog_port: 514
          convert_timezone: true
cisco は asa 以外にも ios, ttd(Firepower Threat Defense logs) にも対応している
基本は、上記のasa 箇所を ios, ftd に変更すれば対応可能
詳細パラメータ等は、下記の公式ページを参照
詳細: https://www.elastic.co/guide/en/beats/filebeat/7.6/filebeat-module-cisco.html
paloalto を使用する場合
cisco 同様 module 設定のうち、module: iptables 箇所を下記に変更する
      - module: panw
        panos:
          enabled: true
          var.syslog_host: 0.0.0.0
          var.syslog_port: 514
          convert_timezone: true
詳細: https://www.elastic.co/guide/en/beats/filebeat/7.6/filebeat-module-panw.html
Service 設定
Netflow と Syslog (Firewallログ) をkubernetesクラスタ外部から受信するため、
LoadBalancer での Service を作成して、固定IPで受信をする
type: LoadBalancer は TCP/UDP で 1 つの Service で構築ができないため、
metallb の allow-shared-ip を指定して、同じ IP で 2つの LoadBalancer Service を構築している
※ ここでは例として「192.168.131.2」を指定している
※ 今回の構成は Syslog も UDP なので TCP は不要で 1 つでもいいが、汎用性よく TCP の方も用意している
---
apiVersion: v1
kind: Service
metadata:
  name: network-filebeat-udp
  namespace: elastic-monitoring
  annotations:
    metallb.universe.tf/allow-shared-ip: "network-filebeat"
spec:
  ports:
  - name: netflow
    port: 2055
    protocol: UDP
    targetPort: 2055
  - name: syslog
    port: 514
    protocol: UDP
    targetPort: 514
  selector:
    k8s-app: network-filebeat
  type: LoadBalancer
  loadBalancerIP: 192.168.131.2
---
apiVersion: v1
kind: Service
metadata:
  name: network-filebeat-tcp
  namespace: elastic-monitoring
  annotations:
    metallb.universe.tf/allow-shared-ip: "network-filebeat"
spec:
  ports:
  - name: syslog
    port: 514
    protocol: TCP
    targetPort: 514
  selector:
    k8s-app: network-filebeat
  type: LoadBalancer
  loadBalancerIP: 192.168.131.2
yaml 全体
上記 module設定, Service を含んだ全体の Yaml 例は下記の通り
---
apiVersion: v1
kind: ConfigMap
metadata:
  name: network-filebeat-config
  namespace: elastic-monitoring
  labels:
    k8s-app: network-filebeat
data:
  filebeat.yml: |-
    processors:
      - add_cloud_metadata:
      - add_host_metadata:
      - add_locale: ~

    cloud.id: ${ELASTIC_CLOUD_ID}
    cloud.auth: ${ELASTIC_CLOUD_AUTH}

    output.elasticsearch:
      hosts: ['https://${ELASTICSEARCH_HOST:elasticsearch}:${ELASTICSEARCH_PORT:9200}']
      username: ${ELASTICSEARCH_USERNAME}
      password: ${ELASTICSEARCH_PASSWORD}
      ssl.certificate_authorities:
      - /mnt/elastic/tls.crt

    setup.dashboards.enabled: true

    setup.kibana:
      host: "https://${KIBANA_HOST}:5601"
      username: ${ELASTICSEARCH_USERNAME}
      password: ${ELASTICSEARCH_PASSWORD}
      protocol: "https"
      ssl.certificate_authorities:
        - /mnt/kibana/tls.crt

    filebeat.config:
      modules:
        path: ${path.config}/modules.d/*.yml
        reload.enabled: false

    filebeat.modules:
      - module: iptables
        log:
          enabled: true
          var:
            syslog_host: 0.0.0.0
            syslog_port: 514
            convert_timezone: true
      - module: netflow
        log:
          enabled: true
          var:
            netflow_host: 0.0.0.0
            netflow_port: 2055
---
apiVersion: apps/v1
kind: Deployment
metadata:
  name: network-filebeat
  namespace: elastic-monitoring
  labels:
    k8s-app: network-filebeat
spec:
  selector:
    matchLabels:
      k8s-app: network-filebeat
  template:
    metadata:
      labels:
        k8s-app: network-filebeat
    spec:
      serviceAccountName: network-filebeat
      terminationGracePeriodSeconds: 30
      containers:
      - name: network-filebeat
        image: docker.elastic.co/beats/filebeat:7.6.0
        args: [
          "-c", "/etc/filebeat.yml",
          "-e",
        ]
        ports:
        - name: netflow
          containerPort: 2055
          protocol: UDP
        - name: syslog
          containerPort: 514
          protocol: UDP
        - name: syslog-tcp
          containerPort: 514
          protocol: TCP
        env:
        - name: ELASTICSEARCH_HOST
          value: monitoring-elasticsearch-es-http
        - name: ELASTICSEARCH_PORT
          value: "9200"
        - name: ELASTICSEARCH_USERNAME
          value: elastic
        - name: ELASTICSEARCH_PASSWORD
          valueFrom:
            secretKeyRef:
              key: elastic
              name: monitoring-elasticsearch-es-elastic-user
        - name: KIBANA_HOST
          value: monitoring-kibana-kb-http
        - name: ELASTIC_CLOUD_ID
          value:
        - name: ELASTIC_CLOUD_AUTH
          value:
        - name: NODE_NAME
          valueFrom:
            fieldRef:
              fieldPath: spec.nodeName
        securityContext:
          runAsUser: 0
        resources:
          limits:
            memory: 200Mi
          requests:
            cpu: 100m
            memory: 100Mi
        volumeMounts:
        - name: config
          mountPath: /etc/filebeat.yml
          readOnly: true
          subPath: filebeat.yml
        - name: data
          mountPath: /usr/share/filebeat/data
        - name: es-certs
          mountPath: /mnt/elastic/tls.crt
          readOnly: true
          subPath: tls.crt
        - name: kb-certs
          mountPath: /mnt/kibana/tls.crt
          readOnly: true
          subPath: tls.crt
        - name: localtime
          mountPath: /etc/localtime
          readOnly: true
      volumes:
      - name: config
        configMap:
          defaultMode: 0600
          name: network-filebeat-config
      - name: data
        emptyDir:
      - name: es-certs
        secret:
          secretName: monitoring-elasticsearch-es-http-certs-public
      - name: kb-certs
        secret:
          secretName: monitoring-kibana-kb-http-certs-public
      - name: localtime
        hostPath:
          path: /etc/localtime
          type: File
---
apiVersion: rbac.authorization.k8s.io/v1
kind: ClusterRoleBinding
metadata:
  name: network-filebeat
subjects:
- kind: ServiceAccount
  name: network-filebeat
  namespace: elastic-monitoring
roleRef:
  kind: ClusterRole
  name: network-filebeat
  apiGroup: rbac.authorization.k8s.io
---
apiVersion: rbac.authorization.k8s.io/v1
kind: ClusterRole
metadata:
  name: network-filebeat
  labels:
    k8s-app: network-filebeat
rules:
- apiGroups: [""]
  resources:
  - namespaces
  - pods
  verbs:
  - get
  - watch
  - list
---
apiVersion: v1
kind: ServiceAccount
metadata:
  name: network-filebeat
  namespace: elastic-monitoring
  labels:
    k8s-app: network-filebeat
---
apiVersion: v1
kind: Service
metadata:
  name: network-filebeat-udp
  namespace: elastic-monitoring
  annotations:
    metallb.universe.tf/allow-shared-ip: "network-filebeat"
spec:
  ports:
  - name: netflow
    port: 2055
    protocol: UDP
    targetPort: 2055
  - name: syslog
    port: 514
    protocol: UDP
    targetPort: 514
  selector:
    k8s-app: network-filebeat
  type: LoadBalancer
  loadBalancerIP: 192.168.131.2
---
apiVersion: v1
kind: Service
metadata:
  name: network-filebeat-tcp
  namespace: elastic-monitoring
  annotations:
    metallb.universe.tf/allow-shared-ip: "network-filebeat"
spec:
  ports:
  - name: syslog
    port: 514
    protocol: TCP
    targetPort: 514
  selector:
    k8s-app: network-filebeat
  type: LoadBalancer
  loadBalancerIP: 192.168.131.2
あとは上記を Apply するのみ
$ kubectl apply -f network-filebeat.yaml
機器側 Netflow / Syslog 設定
EdgeRouter 側の Netflow, syslog 設定は下記の通り。
set system flow-accounting ingress-capture pre-dnat
set system flow-accounting interface eth0
set system flow-accounting netflow enable-egress
set system flow-accounting netflow mode daemon
set system flow-accounting netflow server 192.168.131.2 port 2055
set system flow-accounting netflow version 9
set system flow-accounting syslog-facility daemon
set system syslog global facility all level notice
set system syslog host 192.168.131.2 facility all level info
当然だが、各Firewall設定などでlogの有効化が必要
set firewall name Untrust-Trust rule 100 log enable
(2020.03.28 追記) Neflow 設定追加
Netflow 負荷が増えた際に EdgeRouter がハングアップする状態になったため、下記設定を実施し改善が見られたので追記する。
set system flow-accounting disable-memory-table
set system flow-accounting netflow enable-egress engine-id 1
set system flow-accounting netflow engine-id 0
set system flow-accounting netflow timeout expiry-interval 60
set system flow-accounting netflow timeout flow-generic 3600
set system flow-accounting netflow timeout icmp 300
set system flow-accounting netflow timeout max-active-life 604800
set system flow-accounting netflow timeout tcp-fin 300
set system flow-accounting netflow timeout tcp-generic 3600
set system flow-accounting netflow timeout tcp-rst 120
set system flow-accounting netflow timeout udp 300
Netflow 可視化例
可視化する Dashboard 設定は filebeat にて Kibana dashboard が設定され、自動で設定される。
Netflow の可視化 Dashboard はデフォルトで 9 つ用意されている
| Dashboard Name | ざっくり説明 |
|---|---|
| [Filebeat Netflow] Overview | 全体の概要を表示 |
| [Filebeat Netflow] Conversation Partners | 1:1 の通信組み合わせの統計表示 |
| [Filebeat Netflow] Traffic Analysis | トラフィックの時系列グラフ表示 |
| [Filebeat Netflow] Top-N | IP, Port, AS でのランキング表示 |
| [Filebeat Netflow] Geo Location | 通信先を世界地図にヒートマップで表示 インターネット上の Tile サーバと通信する インターネット環境がない・Proxyがない環境では、ローカルに Tileサーバを準備して指定することも可能 |
| [Filebeat Netflow] Autonomous Systems | AS 視点でのトラフィック時系列・円グラフ表示 (Trafffic Analysis にも似たグラフはある) |
| [Filebeat Netflow] Flow Exporters | Exporter 視点での表示(今回はnetflow-filebeatsのみ) |
| [Filebeat Netflow] Flow records | Raw な Netflow の Record 表示 |
| [Filebeat Netflow] Top-N Flows | IP,Port でのランキング表示など |
表示例として、5 つの Dashboard を載せる
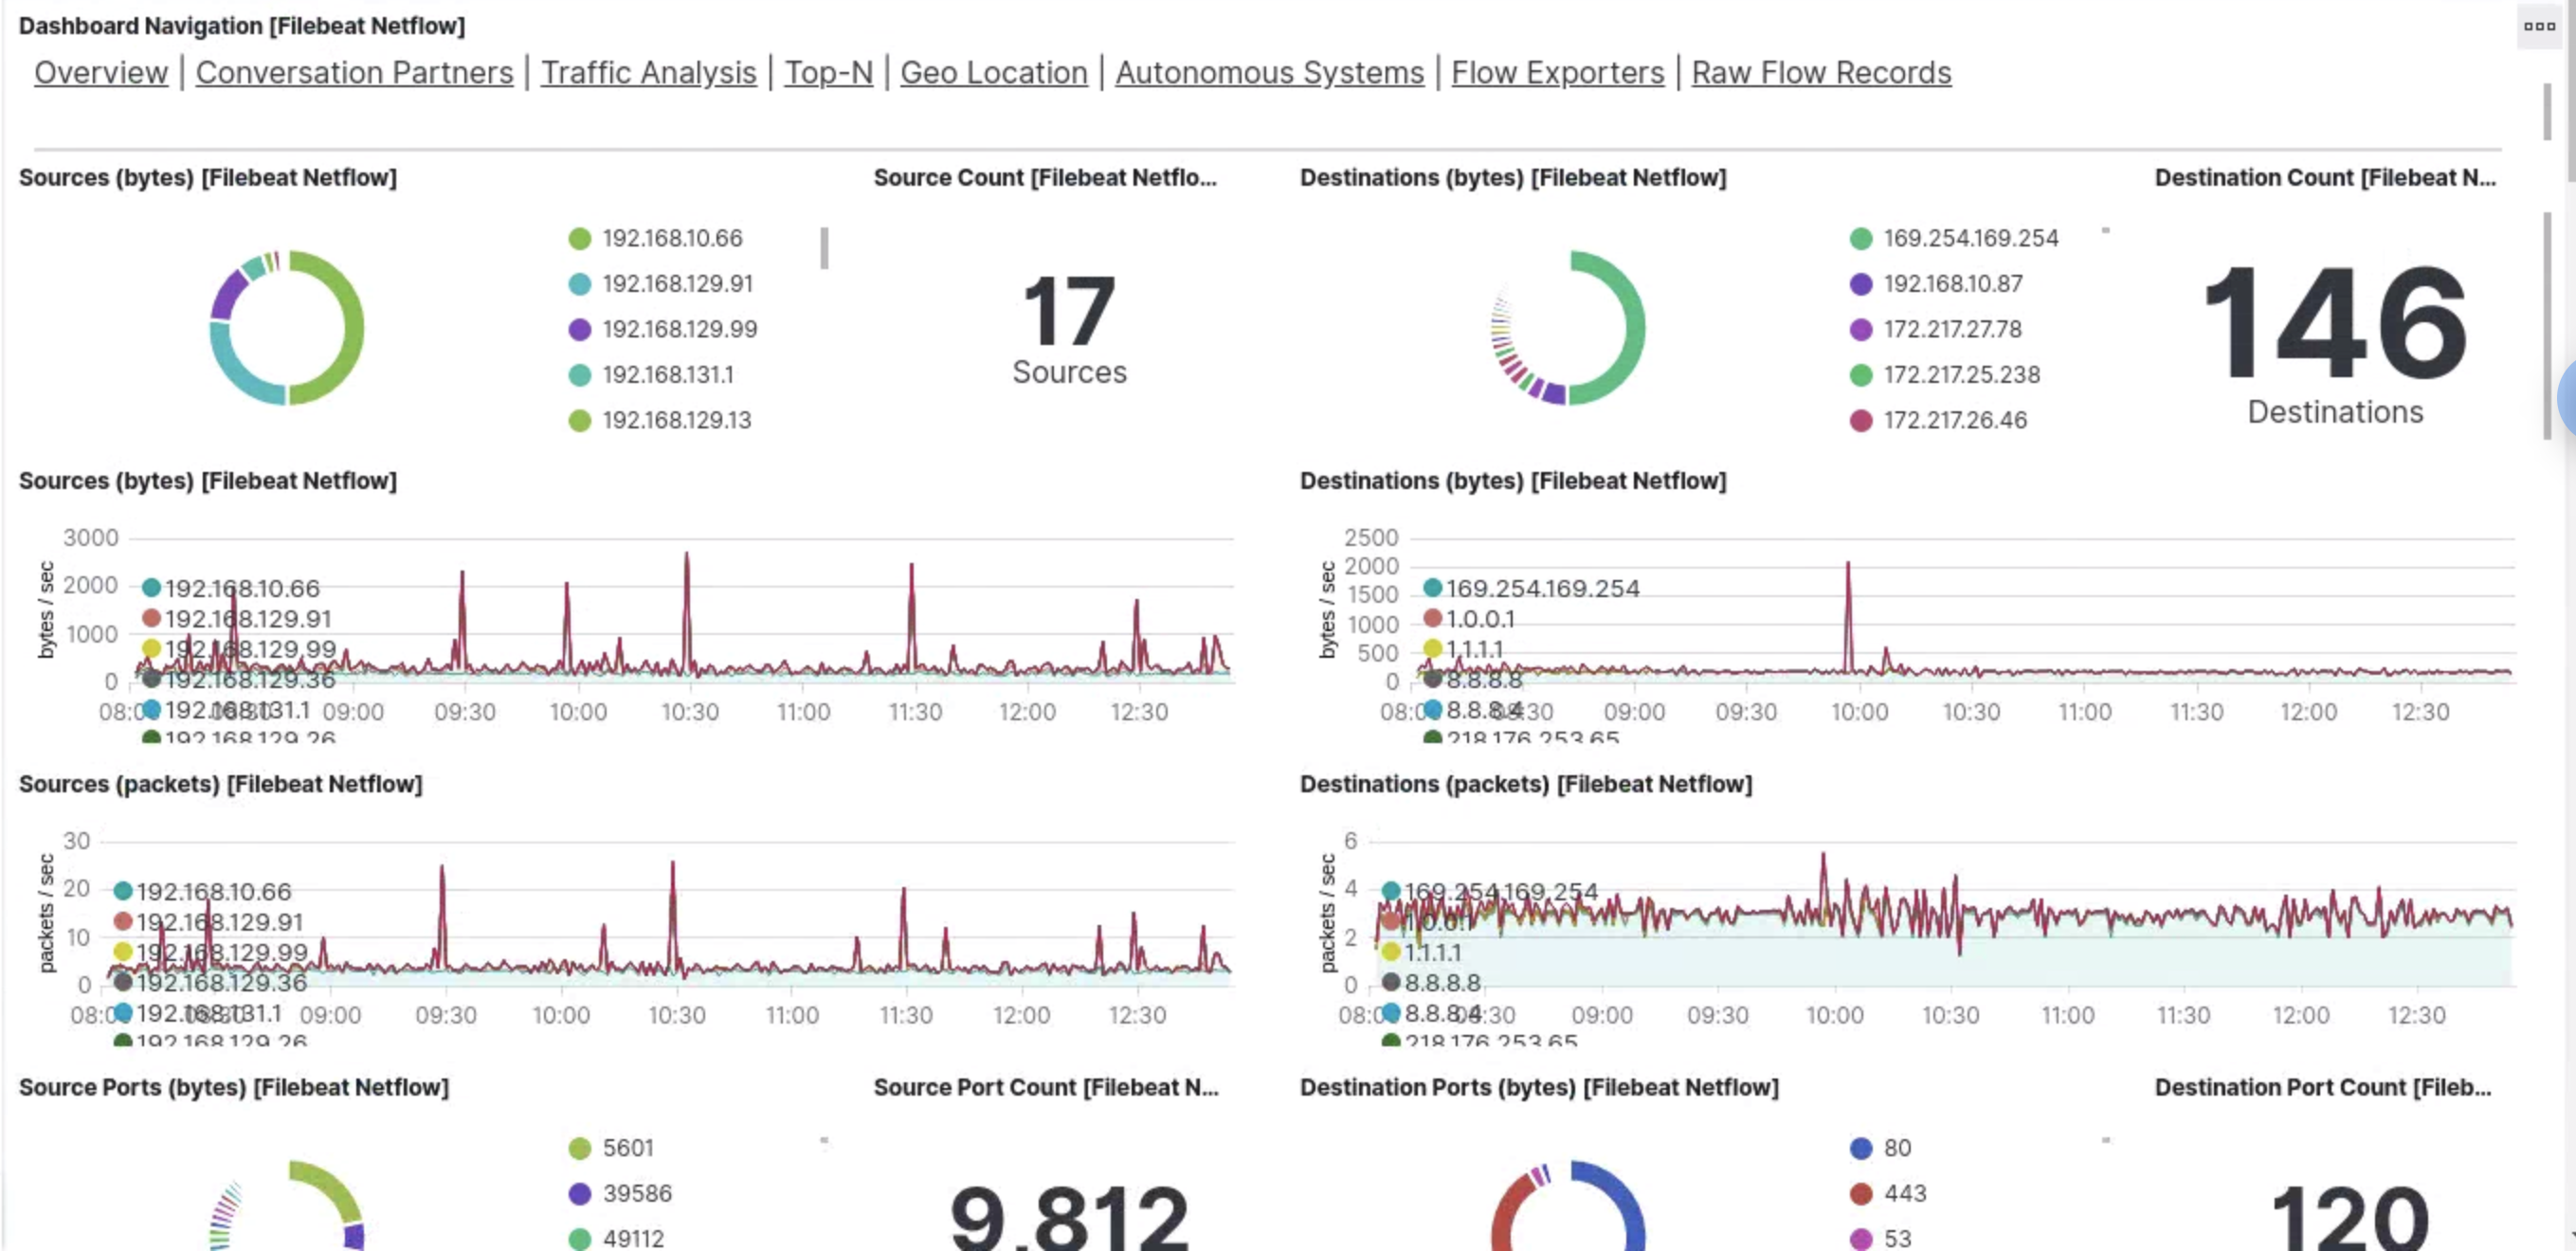
[Filebeat Netflow] Overview 表示例
どのような IP, Port, Type, AS の通信が多いかがざっくりわかる
![[Filebeat Netflow] Overview 表示例.png](https://qiita-user-contents.imgix.net/https%3A%2F%2Fqiita-image-store.s3.ap-northeast-1.amazonaws.com%2F0%2F326183%2Fb429d825-61f2-8c7d-48b4-cc4c411f044c.png?ixlib=rb-4.0.0&auto=format&gif-q=60&q=75&s=7619b88fc4d13c8d09511cf7aadc5d8e)
[Filebeat Netflow] Traffic Analysis 表示例
時系列グラフで IP, Port, Type, AS などの視点でどのような通信が多いかなどが確認できる (パラメータで絞り込みも可能)
![[Filebeat Netflow] Traffic Analysis 表示例.png](https://qiita-user-contents.imgix.net/https%3A%2F%2Fqiita-image-store.s3.ap-northeast-1.amazonaws.com%2F0%2F326183%2Ffcfd9f30-32ab-df2b-4bdb-049c9d53798a.png?ixlib=rb-4.0.0&auto=format&gif-q=60&q=75&s=7ed491c3f93a05466dfeab366e6ec53e)
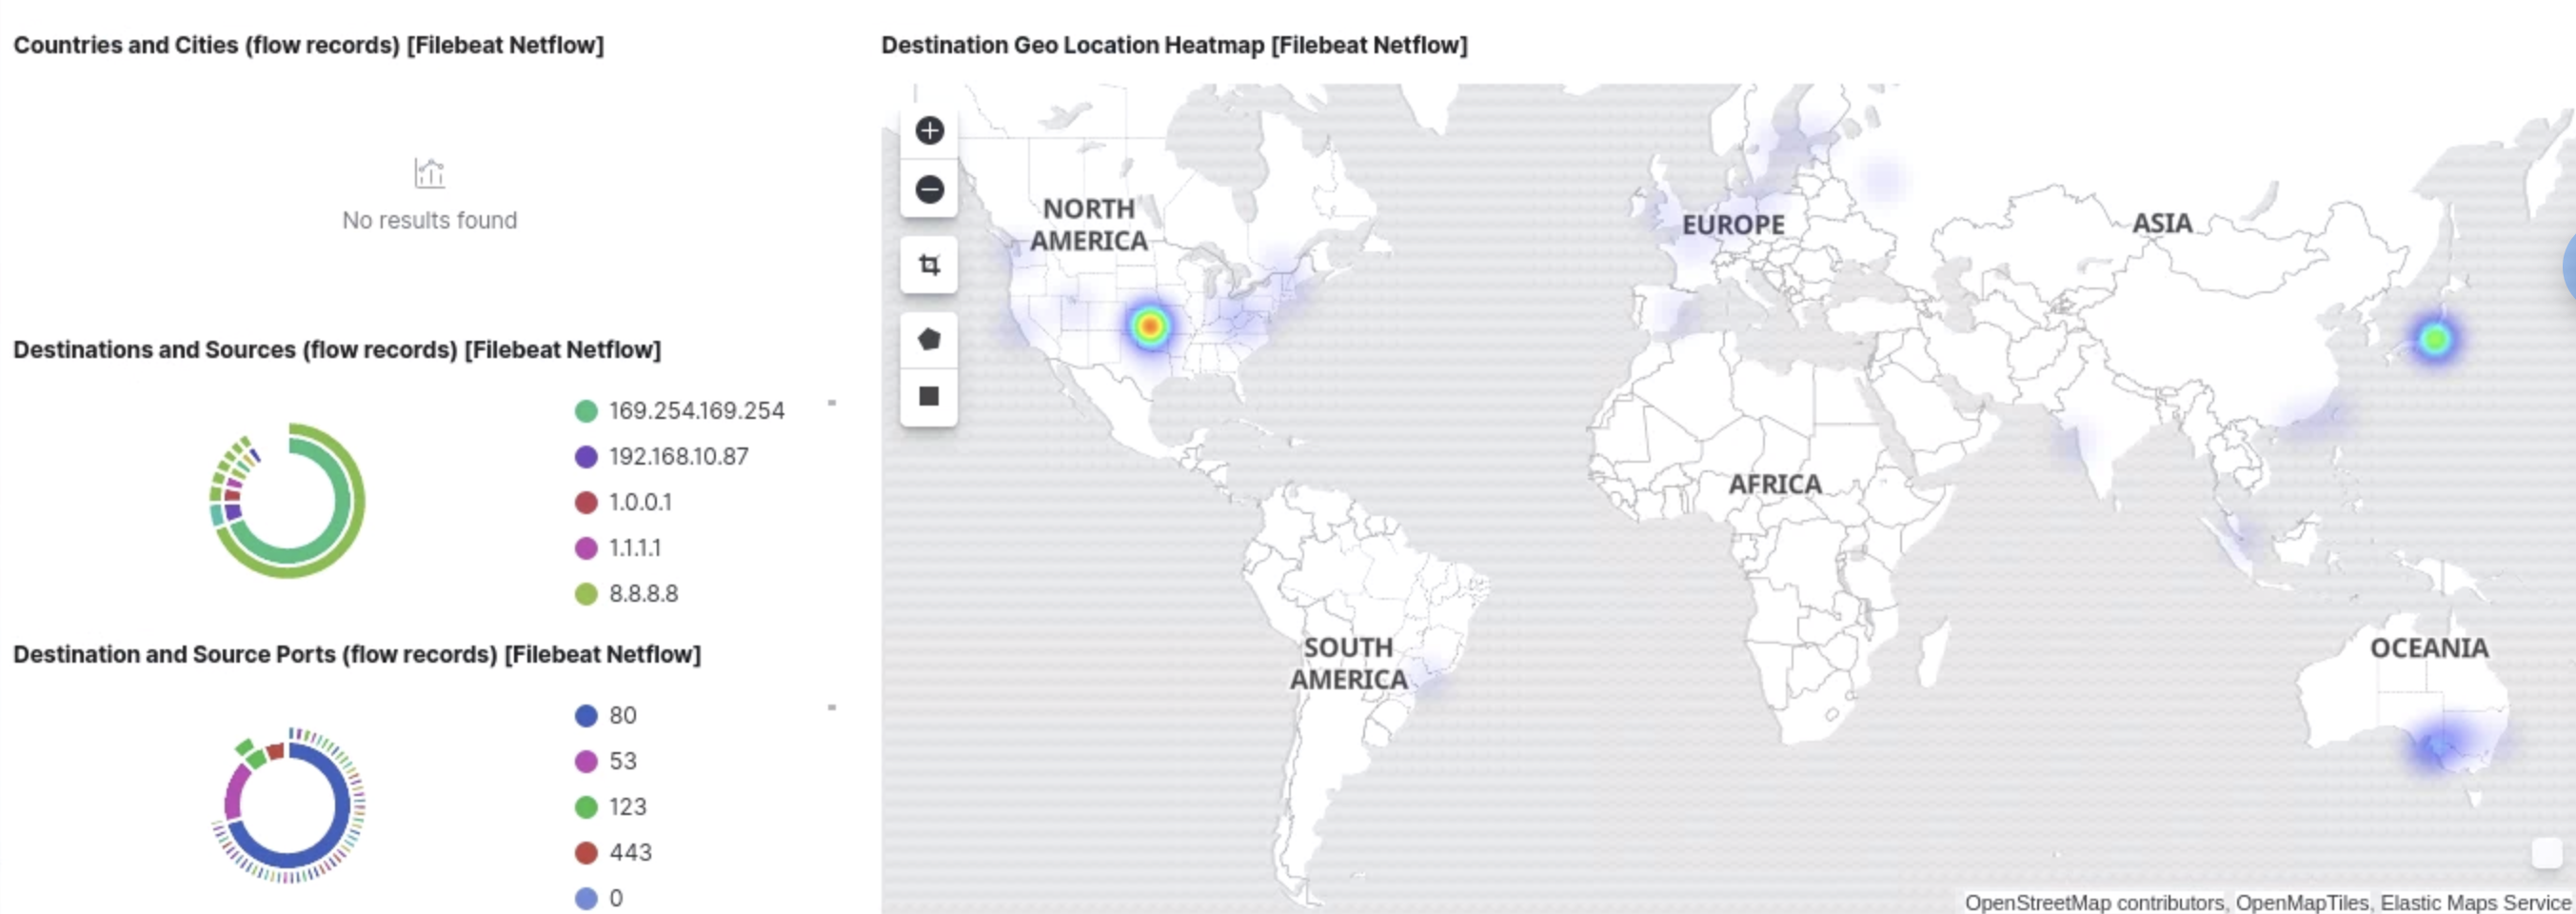
[Filebeat Netflow] Geo Location 表示例
GeoIP を元にどの国・どの地域との通信が多いかがわかる
![[Filebeat Netflow] Geo Location 表示例1.png](https://qiita-user-contents.imgix.net/https%3A%2F%2Fqiita-image-store.s3.ap-northeast-1.amazonaws.com%2F0%2F326183%2Fdccb473f-cb59-1840-0934-127551927be3.png?ixlib=rb-4.0.0&auto=format&gif-q=60&q=75&s=da7c5ca69740e824757f7518d3880512)
ヒートマップは拡大して見ていくことも可能
![[Filebeat Netflow] Geo Location 表示例2.png](https://qiita-user-contents.imgix.net/https%3A%2F%2Fqiita-image-store.s3.ap-northeast-1.amazonaws.com%2F0%2F326183%2Fe80d40d5-82da-f347-4850-5ae413e44cac.png?ixlib=rb-4.0.0&auto=format&gif-q=60&q=75&s=80c246304ea832ee61e33d4532f9b81c)
[Filebeat Netflow] Autonomous Systems 表示例
AS 視点でトラフィックを見やすく表示できる
![[Filebeat Netflow] Autonomous Systems 表示例.png](https://qiita-user-contents.imgix.net/https%3A%2F%2Fqiita-image-store.s3.ap-northeast-1.amazonaws.com%2F0%2F326183%2F1adaf409-86a7-f245-6a70-00faff174510.png?ixlib=rb-4.0.0&auto=format&gif-q=60&q=75&s=beeffd710f3852c639eb524eb2601007)
[Filebeat Netflow] Top-N Flows 表示例
![[Filebeat Netflow] Top-N Flows 例.png](https://qiita-user-contents.imgix.net/https%3A%2F%2Fqiita-image-store.s3.ap-northeast-1.amazonaws.com%2F0%2F326183%2F32910151-1539-984d-09b2-552fea8a3ff5.png?ixlib=rb-4.0.0&auto=format&gif-q=60&q=75&s=462860bf439a6b78c5884f19784acd8c)
Firewall ログ 可視化例
Firewall ログの可視化は下記でアクセスできる (これは EdgeRouter での例. Cisco/PaloAlto は別の Dashboard が用意されている)
| Dashboard Name | ざっくり説明 |
|---|---|
| [Filebeat Iptables] Overview ECS | iptables ログでの全体概要表示 (Edgerouter 以外のサーバでの iptables もこれで表示可能) |
| [Filebeat Iptables] Ubiquiti Firewall Overview ECS | EdgeRouter でのFirewall ログ特化での Firewallログの可視化 |
[Filebeat Iptables] Overview ECS 表示例

[Filebeat Iptables] Ubiquiti Firewall Overview ECS 表示例

おわりに
ElasticStack (ECK版) での Network 機器の Netflow/Syslog 可視化が可能となった。
一部時間が JST に調整できてない箇所があったりしたので修正方法を検討したい。
今後、SIEM 機能についても調べて使用できるようにしていきたい (今回で Network ログも入れているので、SIEMでいろいろ確認も可能になっている)