はじめに
オンプレで Kubernetes クラスタを構築するにあたり、ログメトリクス表示環境を ElasticStack で実施してみた。
ElasticStack の Kubernetes Operator / CRD である Elastic Cloud on Kubernetes (ECK) が 1.0 でリリース(2020.01.16) されたので ECK による構築を実施した。
Beats に関しては ECK ではカバーされていないので、マニフェストを作成して構築した。
例えば、Kubernetes クラスタ上にある Pod のログ表示は、
全体の Pod から (CPU利用率などが高いものをみて) クリックして Pod 単位で見ることが可能になる。
上記の他にも、最後に Kibana での表示確認結果も Gif or 画像で複数載せてみた。
Elastic Cloud on Kubernetes / 動作環境
Elastic Cloud on Kubernetes (ECK) および動作環境については下記に動作含めまとめている。
Version
ElasticStack : 7.6.0
ECK : 1.0.1
Kubernetes : 1.16.3
kube-state-metrics : 1.9.4
構成全体概要図
リソース全体の整理のために全体の概要図を記載する。 (ServiceAccount, Role, ConfigMap など一部は省略している)
これから作成するマニフェスト別に整理すると下記のようになる。
今回は赤文字のマニフェストを作成する。
PV 作成 (iscsi-pv.yaml) や iSCSI 設定ついては QNAP での PV 作成や ECK のオンプレ動作確認時に記載した通りなので省略する。
構築ステップ
下記のステップで構築していく。
- namespace の構築
- ECK の導入
- Elasticsearch の構築
- Kibana の構築
- filebeat の構築
- metricbeat の構築
- auditbeat の構築
-
- ~ 2. : 今回 ElasticStack 配置の namespaceの作成. ECK Operator の構築
-
- ~ 4. : Elasticsearch / Kibana 環境の構築
-
- ~ 6. : 今回構築する 3種の beats の構築
1. namespace の構築
namespace は default と分けて elastic-monitoring で作成する。
これは default や kube-system とは分けておきたいため。
kind: Namespace
apiVersion: v1
metadata:
  name: elastic-monitoring
  labels:
    name: elastic-monitoring
上記マニフェストを適用して namespace を作成する。
$ kubectl apply -f elastic-namespace.yaml
namespace/elastic-monitoring created
2. ECK の導入
ECK を導入する。これで Elasticsearch/Kibana/ApmServer の CRD や Operator などが構築される。
(詳細は ECK オンプレ動作確認 に記載しているのでそちらを参照. Versionのみ異なる(記載時の最新版を適応))
$ curl -OL https://download.elastic.co/downloads/eck/1.0.1/all-in-one.yaml
  % Total    % Received % Xferd  Average Speed   Time    Time     Time  Current
                                 Dload  Upload   Total   Spent    Left  Speed
100 93520  100 93520    0     0  94865      0 --:--:-- --:--:-- --:--:-- 94847

$ kubectl apply -f all-in-one.yaml
customresourcedefinition.apiextensions.k8s.io/apmservers.apm.k8s.elastic.co created
customresourcedefinition.apiextensions.k8s.io/elasticsearches.elasticsearch.k8s.elastic.co created
customresourcedefinition.apiextensions.k8s.io/kibanas.kibana.k8s.elastic.co created
clusterrole.rbac.authorization.k8s.io/elastic-operator created
clusterrolebinding.rbac.authorization.k8s.io/elastic-operator created
namespace/elastic-system created
statefulset.apps/elastic-operator created
serviceaccount/elastic-operator created
validatingwebhookconfiguration.admissionregistration.k8s.io/elastic-webhook.k8s.elastic.co created
service/elastic-webhook-server created
secret/elastic-webhook-server-cert created

$ kubectl get po -n elastic-system
NAME                 READY   STATUS    RESTARTS   AGE
elastic-operator-0   1/1     Running   1          3m13s
3. Elasticsearch の構築
Elasticsearch クラスタを作成する。
(詳細は ECK オンプレ動作確認 に記載している.namespace, name を今回ように書き換えているのみ。)
(StorageClass: standard, storageサイズ 50Gi が用意されていることが前提.詳細は ECK オンプレ動作確認参照)
apiVersion: elasticsearch.k8s.elastic.co/v1
kind: Elasticsearch
metadata:
  name: monitoring-elasticsearch
  namespace: elastic-monitoring
spec:
  version: 7.6.0
  nodeSets:
  - name: master-data
    count: 3
    config:
      node.master: true
      node.data: true
      node.ingest: true
      node.store.allow_mmap: false
    volumeClaimTemplates:
    - metadata:
        name: elasticsearch-data
      spec:
        accessModes:
        - ReadWriteOnce
        resources:
          requests:
            storage: 50Gi
        storageClassName: standard
上記 yaml の apply を実施する。
$ kubectl apply -f elasticsearch.yaml
elasticsearch.elasticsearch.k8s.elastic.co/monitoring-elasticsearch created

$ kubectl get po -n elastic-monitoring
NAME                                        READY   STATUS    RESTARTS   AGE
monitoring-elasticsearch-es-master-data-0   1/1     Running   0          53s
monitoring-elasticsearch-es-master-data-1   1/1     Running   0          53s
monitoring-elasticsearch-es-master-data-2   1/1     Running   0          52s

$ kubectl get es -n elastic-monitoring
NAME                       HEALTH   NODES   VERSION   PHASE   AGE
monitoring-elasticsearch   green    3       7.6.0     Ready   79s
4. Kibana の構築
Kibana を構築する。
(詳細は ECK オンプレ動作確認 に記載している.namespace, name を今回ように書き換えているのみ。)
apiVersion: kibana.k8s.elastic.co/v1
kind: Kibana
metadata:
  name: monitoring-kibana
  namespace: elastic-monitoring
spec:
  version: 7.6.0
  count: 1
  elasticsearchRef:
    name: monitoring-elasticsearch
上記 yaml を apply する。
$ kubectl apply -f kibana.yaml
kibana.kibana.k8s.elastic.co/monitoring-kibana created

$ kubectl get kibana -n elastic-monitoring
NAME                HEALTH   NODES   VERSION   AGE
monitoring-kibana   green    1       7.6.0     117s
ログイン用パスワード取得。
$ kubectl get secret monitoring-elasticsearch-es-elastic-user -n elastic-monitoring -o=jsonpath='{.data.elastic}' | base64 --decode; echo
s2gqmsd5vxbknqlqpvsjmztg
ポートフォワード実施。
$ kubectl port-forward service/monitoring-kibana-kb-http 5601 -n elastic-monitoring
Forwarding from 127.0.0.1:5601 -> 5601
Forwarding from [::1]:5601 -> 5601
https://127.0.0.1:5601 でブラウザでの表示・username:elastic passowrd: 上記で取得したパスワード(例だと: s2gqmsd5vxbknqlqpvsjmztg)ログイン可能。
(この時点でのログイン、画像での例などは ECK オンプレ動作確認 に記載している.)
5. filebeat の構築
ログ取得のため filebeat を導入する。
elastic公式に用意している kubernetes 用の yaml を元に変更する。
ベースとなる yaml をダウンロード。
curl -L -O https://raw.githubusercontent.com/elastic/beats/7.6/deploy/kubernetes/filebeat-kubernetes.yaml
下記に変更していく。
5.1 namespace の変更
デフォルトではkube-systemが指定されているので、elastic-monitoringに変更する。
$ sed -e 's/namespace: kube-system/namespace: elastic-monitoring/g' filebeat-kubernetes.yaml > filebeat.yaml
5.2 Elasticsearch/Kibana host指定, 認証の追加, secret の参照追加
ECK によって、Elasticsearch, Kibana のService, Secret が作成されているのでそれらを指定する。
- elasticsearch
- Service:
monitoring-elasticsearch-es-http- [name]-es-http で作成される
- Secret:
monitoring-elasticsearch-es-http-certs-public- [name]-es-http-certs-public で作成される
- Service:
- kibana
- Service:
monitoring-kibana-kb-http- [name]-kb-http で作成される
- Secret:
monitoring-kibana-kb-http-certs-public- [name]-kb-http-certs-public で作成される
- Service:
DaemonSet
        env:
        - name: ELASTICSEARCH_HOST
          value: monitoring-elasticsearch-es-http
        - name: ELASTICSEARCH_PORT
          value: "9200"
        - name: ELASTICSEARCH_USERNAME
          value: elastic
        - name: ELASTICSEARCH_PASSWORD
          valueFrom:
            secretKeyRef:
              key: elastic
              name: monitoring-elasticsearch-es-elastic-user
        - name: KIBANA_HOST
          value: monitoring-kibana-kb-http
~~中略~~
        volumeMounts:
~~中略~~
        - name: es-certs
          mountPath: /mnt/elastic/tls.crt
          readOnly: true
          subPath: tls.crt
        - name: kb-certs
          mountPath: /mnt/kibana/tls.crt
          readOnly: true
          subPath: tls.crt
~~中略~~
      volumes:
~~中略~~
      - name: es-certs
        secret:
          secretName: monitoring-elasticsearch-es-http-certs-public
      - name: kb-certs
        secret:
          secretName: monitoring-kibana-kb-http-certs-public
ConfigMap
data:
  filebeat.yml: |-
~~中略~~
    output.elasticsearch:
      hosts: ['https://${ELASTICSEARCH_HOST:elasticsearch}:${ELASTICSEARCH_PORT:9200}']
      username: ${ELASTICSEARCH_USERNAME}
      password: ${ELASTICSEARCH_PASSWORD}
      ssl.certificate_authorities:
      - /mnt/elastic/tls.crt

    setup.dashboards.enabled: true

    setup.kibana:
      host: "https://${KIBANA_HOST}:5601"
      username: ${ELASTICSEARCH_USERNAME}
      password: ${ELASTICSEARCH_PASSWORD}
      protocol: "https"
      ssl.certificate_authorities:
        - /mnt/kibana/tls.crt
5.3 tolerations 追加で master node からも取得
MasterNode のデータも取得したいので、tolerations を設定する。
DaemonSet
    spec:
      tolerations:
        - key: node-role.kubernetes.io/master
          effect: NoSchedule
5.4 autodiscover
kubernetes 用の autodiscover 機能があるので有効化する。
ConfigMap
デフォルトにコメントがある通り、filebeat.inputをコメントアウト(remove)して、コメントアウトされているfilebeat.autodiscoverをコメント解除する
  filebeat.yml: |-
    # filebeat.inputs:
    # - type: container
    #   paths:
    #     - /var/log/containers/*.log
    #   processors:
    #     - add_kubernetes_metadata:
    #         host: ${NODE_NAME}
    #         matchers:
    #         - logs_path:
    #             logs_path: "/var/log/containers/"

    # To enable hints based autodiscover, remove `filebeat.inputs` configuration and uncomment this:
    filebeat.autodiscover:
      providers:
       - type: kubernetes
         host: ${NODE_NAME}
         hints.enabled: true
         hints.default_config:
           type: container
           paths:
             - /var/log/containers/*${data.kubernetes.container.id}.log
5.5 module 追加
syslog, auth の module を追加する。
ConfigMap
  filebeat.yml: |-
~~中略~~
    filebeat.config:
      modules:
        path: ${path.config}/modules.d/*.yml
        reload.enabled: false

    filebeat.modules:
      - module: system
        syslog:
          enabled: true
          var.paths: ["/var/log/messages"]
          var.convert_timezone: true
        auth:
          enabled: true
          var.paths: ["/var/log/secure"]
          var.convert_timezone: true
5.6 timezone の適応
このままだと、UTC の Timezone になってしまうので、サーバの localtime をマウントして JST を反映させる
(ただ Kibana 表示方法によって UTCtime で Now が表示されたり。。。これは改良の余地あり)
ConfigMap
  filebeat.yml: |-
~~中略~~
    spec:
        volumeMounts:
        - name: localtime
          mountPath: /etc/localtime
          readOnly: true
~~中略~~
      volumes:
      - name: localtime
        hostPath:
          path: /etc/localtime
          type: File
5.7 変更後のyaml. 適応
これまでの変更を適応した yaml が下記の通り。
---
apiVersion: v1
kind: ConfigMap
metadata:
  name: filebeat-config
  namespace: elastic-monitoring
  labels:
    k8s-app: filebeat
data:
  filebeat.yml: |-
    # filebeat.inputs:
    # - type: container
    #   paths:
    #     - /var/log/containers/*.log
    #   processors:
    #     - add_kubernetes_metadata:
    #         host: ${NODE_NAME}
    #         matchers:
    #         - logs_path:
    #             logs_path: "/var/log/containers/"

    # To enable hints based autodiscover, remove `filebeat.inputs` configuration and uncomment this:
    filebeat.autodiscover:
     providers:
       - type: kubernetes
         node: ${NODE_NAME}
         hints.enabled: true
         hints.default_config:
           type: container
           paths:
             - /var/log/containers/*${data.kubernetes.container.id}.log

    processors:
      - add_cloud_metadata:
      - add_host_metadata:
      - add_locale: ~

    cloud.id: ${ELASTIC_CLOUD_ID}
    cloud.auth: ${ELASTIC_CLOUD_AUTH}

    output.elasticsearch:
      hosts: ['https://${ELASTICSEARCH_HOST:elasticsearch}:${ELASTICSEARCH_PORT:9200}']
      username: ${ELASTICSEARCH_USERNAME}
      password: ${ELASTICSEARCH_PASSWORD}
      ssl.certificate_authorities:
      - /mnt/elastic/tls.crt

    setup.dashboards.enabled: true

    setup.kibana:
      host: "https://${KIBANA_HOST}:5601"
      username: ${ELASTICSEARCH_USERNAME}
      password: ${ELASTICSEARCH_PASSWORD}
      protocol: "https"
      ssl.certificate_authorities:
        - /mnt/kibana/tls.crt

    filebeat.config:
      modules:
        path: ${path.config}/modules.d/*.yml
        reload.enabled: false

    filebeat.modules:
      - module: system
        syslog:
          enabled: true
          var.paths: ["/var/log/messages"]
          var.convert_timezone: true
        auth:
          enabled: true
          var.paths: ["/var/log/secure"]
          var.convert_timezone: true
---
apiVersion: apps/v1
kind: DaemonSet
metadata:
  name: filebeat
  namespace: elastic-monitoring
  labels:
    k8s-app: filebeat
spec:
  selector:
    matchLabels:
      k8s-app: filebeat
  template:
    metadata:
      labels:
        k8s-app: filebeat
    spec:
      tolerations:
        - key: node-role.kubernetes.io/master
          effect: NoSchedule
      serviceAccountName: filebeat
      terminationGracePeriodSeconds: 30
      hostNetwork: true
      dnsPolicy: ClusterFirstWithHostNet
      containers:
      - name: filebeat
        image: docker.elastic.co/beats/filebeat:7.6.0
        args: [
          "-c", "/etc/filebeat.yml",
          "-e",
        ]
        env:
        - name: ELASTICSEARCH_HOST
          value: monitoring-elasticsearch-es-http
        - name: ELASTICSEARCH_PORT
          value: "9200"
        - name: ELASTICSEARCH_USERNAME
          value: elastic
        - name: ELASTICSEARCH_PASSWORD
          valueFrom:
            secretKeyRef:
              key: elastic
              name: monitoring-elasticsearch-es-elastic-user
        - name: KIBANA_HOST
          value: monitoring-kibana-kb-http
        - name: ELASTIC_CLOUD_ID
          value:
        - name: ELASTIC_CLOUD_AUTH
          value:
        - name: NODE_NAME
          valueFrom:
            fieldRef:
              fieldPath: spec.nodeName
        securityContext:
          runAsUser: 0
          # If using Red Hat OpenShift uncomment this:
          #privileged: true
        resources:
          limits:
            memory: 200Mi
          requests:
            cpu: 100m
            memory: 100Mi
        volumeMounts:
        - name: config
          mountPath: /etc/filebeat.yml
          readOnly: true
          subPath: filebeat.yml
        - name: data
          mountPath: /usr/share/filebeat/data
        - name: varlibdockercontainers
          mountPath: /var/lib/docker/containers
          readOnly: true
        - name: varlog
          mountPath: /var/log
          readOnly: true
        - name: es-certs
          mountPath: /mnt/elastic/tls.crt
          readOnly: true
          subPath: tls.crt
        - name: kb-certs
          mountPath: /mnt/kibana/tls.crt
          readOnly: true
          subPath: tls.crt
        - name: localtime
          mountPath: /etc/localtime
          readOnly: true
      volumes:
      - name: config
        configMap:
          defaultMode: 0600
          name: filebeat-config
      - name: varlibdockercontainers
        hostPath:
          path: /var/lib/docker/containers
      - name: varlog
        hostPath:
          path: /var/log
      # data folder stores a registry of read status for all files, so we don't send everything again on a Filebeat pod restart
      - name: data
        hostPath:
          path: /var/lib/filebeat-data
          type: DirectoryOrCreate
      - name: es-certs
        secret:
          secretName: monitoring-elasticsearch-es-http-certs-public
      - name: kb-certs
        secret:
          secretName: monitoring-kibana-kb-http-certs-public
      - name: localtime
        hostPath:
          path: /etc/localtime
          type: File
---
apiVersion: rbac.authorization.k8s.io/v1
kind: ClusterRoleBinding
metadata:
  name: filebeat
subjects:
- kind: ServiceAccount
  name: filebeat
  namespace: elastic-monitoring
roleRef:
  kind: ClusterRole
  name: filebeat
  apiGroup: rbac.authorization.k8s.io
---
apiVersion: rbac.authorization.k8s.io/v1
kind: ClusterRole
metadata:
  name: filebeat
  labels:
    k8s-app: filebeat
rules:
- apiGroups: [""] # "" indicates the core API group
  resources:
  - namespaces
  - pods
  verbs:
  - get
  - watch
  - list
---
apiVersion: v1
kind: ServiceAccount
metadata:
  name: filebeat
  namespace: elastic-monitoring
  labels:
    k8s-app: filebeat
---
上記 yaml を apply する。
$ kubectl apply -f filebeat.yaml
configmap/filebeat-config created
daemonset.apps/filebeat created
clusterrolebinding.rbac.authorization.k8s.io/filebeat created
clusterrole.rbac.authorization.k8s.io/filebeat created
serviceaccount/filebeat created

$ kubectl get po -n elastic-monitoring | grep filebeat
filebeat-4gqlc                              1/1     Running   3          83s
filebeat-h2zh2                              1/1     Running   3          83s
filebeat-lmb4f                              1/1     Running   3          83s
filebeat-ngfrx                              1/1     Running   3          83s
filebeat-ngnwt                              1/1     Running   3          83s
filebeat-pmjdh                              1/1     Running   0          83s
filebeat-tk4g6                              1/1     Running   0          83s
filebeat-xwxv6                              1/1     Running   0          83s
6. metricbeat の構築
メトリクス取得のため metricbeat を導入する。
metricbeat は前提として kube-state-metrics が必要なため、そちらも導入する。
elastic公式に用意している kubernetes 用の yaml を元に変更する。
ベースとなる yaml をダウンロード。
curl -L -O https://raw.githubusercontent.com/elastic/beats/7.6/deploy/kubernetes/metricbeat-kubernetes.yaml
下記に変更していく。
6.0 kube-state-metrics
kube-state-metrics を Github から clone する。
git clone https://github.com/kubernetes/kube-state-metrics.git
サンプルマニフェストをコピーする。
cp -Rp kube-state-metrics/examples/standard/ elastic-kube-state-metrics
コピーした下記4ファイルの namespace を修正します。
- 変更箇所
-
namespace: kube-system->namespace: elastic-monitoring
-
$ sed -i -e 's/namespace: kube-system/namespace: elastic-monitoring/g' elastic-kube-state-metrics/*.yaml
kube-state-metrics name変更 (2020.03.14更新)
このままだと、Prometheus を kube-prometheus などで入れる際に入れる、kube-state-metrics と、
namespacesが関係ない clusterrolebinding と clusterrole が同じものになってしまい、どちらかの削除で消えたりもする。
影響回避するために、kube-state-metrics の名前を変更する
- 変更箇所
-
kube-state-metrics->elastic-kube-state-metrics- ただし、イメージ名は
kube-state-metricsのまま
- ただし、イメージ名は
-
$ sed -i -e 's/kube-state-metrics/elastic-kube-state-metrics/g' elastic-kube-state-metrics/*.yaml
$ sed -i -e 's/quay.io\/coreos\/elastic-kube-state-metrics/quay.io\/coreos\/kube-state-metrics/g' elastic-kube-state-metrics/deployment.yaml
変更後、 フォルダまるごと apply して elastic-monitoring namespace 上に kube-state-metrics を構築する。
$ kubectl apply -f elastic-kube-state-metrics/
clusterrolebinding.rbac.authorization.k8s.io/elastic-kube-state-metrics created
clusterrole.rbac.authorization.k8s.io/elastic-kube-state-metrics created
deployment.apps/elastic-kube-state-metrics created
serviceaccount/elastic-kube-state-metrics created
service/elastic-kube-state-metrics created
kube-sate-metrics ができたことを確認。
$ kubectl get po -n elastic-monitoring | grep kube-state
elastic-kube-state-metrics-547876f486-7v892   1/1     Running   0          60s
6.1 namespace の変更
filebeats と同様なので下記コマンド以外は省略。
$ sed -e 's/namespace: kube-system/namespace: elastic-monitoring/g' metricbeat-kubernetes.yaml > metricbeat.yaml
6.2 Elasticsearch/Kibana host指定, 認証の追加, secret の参照追加
filebeat と同様なので省略。
※ metricbeat は daemonset と deployment の似た二つのリソースがあるので どちらも 実施
6.3 tolerations 追加で master node からも取得
filebeat と同様なので省略。
※ metricbeat は daemonset と deployment の似た二つのリソースがあるので daemonset のみ実施
6.4 autodiscover
filebeat とほぼ同様なので省略。
6.5 demonset kubernetes.yml へ設定追加
このままだと、Podのメトリクスが取得できないので、下記を追加する。
(Githubの最新版ではこのように修正がされているが、2020.02.23時点でcurlで取得時は下記がなかった)
ConfigMap (DaemonSet側のみ)
変更前
  kubernetes.yml: |-
      metricsets:
        - node
        - system
        - pod
        - container
        - volume
      period: 10s
      host: ${NODE_NAME}
      hosts: ["localhost:10255"]
変更後
  kubernetes.yml: |-
    - module: kubernetes
      metricsets:
        - node
        - system
        - pod
        - container
        - volume
      period: 10s
      host: ${NODE_NAME}
      hosts: ["https://${HOSTNAME}:10250"]
      bearer_token_file: /var/run/secrets/kubernetes.io/serviceaccount/token
      ssl.verification_mode: "none"
6.6 kube-state-metrics 名称変更 (2020.03.14更新)
kube-state-metrics の名称を変更したので、合わせて metricbeat で指定する箇所も修正する。
変更前
apiVersion: v1
kind: ConfigMap
metadata:
  name: metricbeat-deployment-modules
〜〜中略〜〜
      hosts: ["kube-state-metrics:8080"]
変更後
apiVersion: v1
kind: ConfigMap
metadata:
  name: metricbeat-deployment-modules
〜〜中略〜〜
      hosts: ["elastic-kube-state-metrics:8080"]
6.5 変更後のyaml. 適応
これまでの変更を適応した yaml が下記の通り。
---
apiVersion: v1
kind: ConfigMap
metadata:
  name: metricbeat-daemonset-config
  namespace: elastic-monitoring
  labels:
    k8s-app: metricbeat
data:
  metricbeat.yml: |-
    metricbeat.config.modules:
      # Mounted `metricbeat-daemonset-modules` configmap:
      path: ${path.config}/modules.d/*.yml
      # Reload module configs as they change:
      reload.enabled: false

    # To enable hints based autodiscover uncomment this:
    metricbeat.autodiscover:
     providers:
       - type: kubernetes
         node: ${NODE_NAME}
         hints.enabled: true

    processors:
      - add_cloud_metadata:

    cloud.id: ${ELASTIC_CLOUD_ID}
    cloud.auth: ${ELASTIC_CLOUD_AUTH}

    output.elasticsearch:
      hosts: ['https://${ELASTICSEARCH_HOST:elasticsearch}:${ELASTICSEARCH_PORT:9200}']
      username: ${ELASTICSEARCH_USERNAME}
      password: ${ELASTICSEARCH_PASSWORD}
      ssl.certificate_authorities:
        - /mnt/elastic/tls.crt

    setup.kibana:
      host: "https://${KIBANA_HOST}:5601"
      username: ${ELASTICSEARCH_USERNAME}
      password: ${ELASTICSEARCH_PASSWORD}
      protocol: "https"
      ssl.certificate_authorities:
        - /mnt/kibana/tls.crt
    setup.dashboards:
      enabled: true

    xpack.monitoring.enabled: true
---
apiVersion: v1
kind: ConfigMap
metadata:
  name: metricbeat-daemonset-modules
  namespace: elastic-monitoring
  labels:
    k8s-app: metricbeat
data:
  system.yml: |-
    - module: system
      period: 10s
      metricsets:
        - cpu
        - load
        - memory
        - network
        - process
        - process_summary
        #- core
        #- diskio
        #- socket
      processes: ['.*']
      process.include_top_n:
        by_cpu: 5      # include top 5 processes by CPU
        by_memory: 5   # include top 5 processes by memory

    - module: system
      period: 1m
      metricsets:
        - filesystem
        - fsstat
      processors:
      - drop_event.when.regexp:
          system.filesystem.mount_point: '^/(sys|cgroup|proc|dev|etc|host|lib)($|/)'
  kubernetes.yml: |-
    - module: kubernetes
      metricsets:
        - node
        - system
        - pod
        - container
        - volume
      period: 10s
      host: ${NODE_NAME}
      hosts: ["https://${HOSTNAME}:10250"]
      bearer_token_file: /var/run/secrets/kubernetes.io/serviceaccount/token
      ssl.verification_mode: "none"
      # If using Red Hat OpenShift remove the previous hosts entry and
      # uncomment these settings:
      #hosts: ["https://${HOSTNAME}:10250"]
      #bearer_token_file: /var/run/secrets/kubernetes.io/serviceaccount/token
      #ssl.certificate_authorities:
        #- /var/run/secrets/kubernetes.io/serviceaccount/service-ca.crt
    - module: kubernetes
      metricsets:
        - proxy
      period: 10s
      host: ${NODE_NAME}
      hosts: ["localhost:10249"]
---
# Deploy a Metricbeat instance per node for node metrics retrieval
apiVersion: apps/v1
kind: DaemonSet
metadata:
  name: metricbeat
  namespace: elastic-monitoring
  labels:
    k8s-app: metricbeat
spec:
  selector:
    matchLabels:
      k8s-app: metricbeat
  template:
    metadata:
      labels:
        k8s-app: metricbeat
    spec:
      tolerations:
        - key: node-role.kubernetes.io/master
          effect: NoSchedule
      serviceAccountName: metricbeat
      terminationGracePeriodSeconds: 30
      hostNetwork: true
      dnsPolicy: ClusterFirstWithHostNet
      containers:
      - name: metricbeat
        image: docker.elastic.co/beats/metricbeat:7.6.0
        args: [
          "-c", "/etc/metricbeat.yml",
          "-e",
          "-system.hostfs=/hostfs",
        ]
        env:
        - name: ELASTICSEARCH_HOST
          value: monitoring-elasticsearch-es-http
        - name: ELASTICSEARCH_PORT
          value: "9200"
        - name: ELASTICSEARCH_USERNAME
          value: elastic
        - name: ELASTICSEARCH_PASSWORD
          # value: changeme
          valueFrom:
            secretKeyRef:
              key: elastic
              name: monitoring-elasticsearch-es-elastic-user
        - name: KIBANA_HOST
          value: monitoring-kibana-kb-http
        - name: ELASTIC_CLOUD_ID
          value:
        - name: ELASTIC_CLOUD_AUTH
          value:
        - name: NODE_NAME
          valueFrom:
            fieldRef:
              fieldPath: spec.nodeName
        securityContext:
          runAsUser: 0
        resources:
          limits:
            memory: 200Mi
          requests:
            cpu: 100m
            memory: 100Mi
        volumeMounts:
        - name: config
          mountPath: /etc/metricbeat.yml
          readOnly: true
          subPath: metricbeat.yml
        - name: modules
          mountPath: /usr/share/metricbeat/modules.d
          readOnly: true
        - name: dockersock
          mountPath: /var/run/docker.sock
        - name: proc
          mountPath: /hostfs/proc
          readOnly: true
        - name: cgroup
          mountPath: /hostfs/sys/fs/cgroup
          readOnly: true
        - name: es-certs
          mountPath: /mnt/elastic/tls.crt
          readOnly: true
          subPath: tls.crt
        - name: kb-certs
          mountPath: /mnt/kibana/tls.crt
          readOnly: true
          subPath: tls.crt
      volumes:
      - name: proc
        hostPath:
          path: /proc
      - name: cgroup
        hostPath:
          path: /sys/fs/cgroup
      - name: dockersock
        hostPath:
          path: /var/run/docker.sock
      - name: config
        configMap:
          defaultMode: 0600
          name: metricbeat-daemonset-config
      - name: modules
        configMap:
          defaultMode: 0600
          name: metricbeat-daemonset-modules
      - name: data
        hostPath:
          path: /var/lib/metricbeat-data
          type: DirectoryOrCreate
      - name: es-certs
        secret:
          secretName: monitoring-elasticsearch-es-http-certs-public
      - name: kb-certs
        secret:
          secretName: monitoring-kibana-kb-http-certs-public
---
apiVersion: v1
kind: ConfigMap
metadata:
  name: metricbeat-deployment-config
  namespace: elastic-monitoring
  labels:
    k8s-app: metricbeat
data:
  metricbeat.yml: |-
    metricbeat.config.modules:
      # Mounted `metricbeat-daemonset-modules` configmap:
      path: ${path.config}/modules.d/*.yml
      # Reload module configs as they change:
      reload.enabled: false

    processors:
      - add_cloud_metadata:

    cloud.id: ${ELASTIC_CLOUD_ID}
    cloud.auth: ${ELASTIC_CLOUD_AUTH}

    output.elasticsearch:
      hosts: ['https://${ELASTICSEARCH_HOST:elasticsearch}:${ELASTICSEARCH_PORT:9200}']
      username: ${ELASTICSEARCH_USERNAME}
      password: ${ELASTICSEARCH_PASSWORD}
      ssl.certificate_authorities:
        - /mnt/elastic/tls.crt

    setup.kibana:
      host: "https://${KIBANA_HOST}:5601"
      username: ${ELASTICSEARCH_USERNAME}
      password: ${ELASTICSEARCH_PASSWORD}
      protocol: "https"
      ssl.certificate_authorities:
        - /mnt/kibana/tls.crt
    setup.dashboards:
      enabled: true
---
apiVersion: v1
kind: ConfigMap
metadata:
  name: metricbeat-deployment-modules
  namespace: elastic-monitoring
  labels:
    k8s-app: metricbeat
data:
  # This module requires `kube-state-metrics` up and running under `kube-system` namespace
  kubernetes.yml: |-
    - module: kubernetes
      metricsets:
        - state_node
        - state_deployment
        - state_replicaset
        - state_pod
        - state_container
        - state_cronjob
        - state_resourcequota
        # Uncomment this to get k8s events:
        #- event
      period: 10s
      host: ${NODE_NAME}
      hosts: ["elastic-kube-state-metrics:8080"]
---
# Deploy singleton instance in the whole cluster for some unique data sources, like kube-state-metrics
apiVersion: apps/v1
kind: Deployment
metadata:
  name: metricbeat
  namespace: elastic-monitoring
  labels:
    k8s-app: metricbeat
spec:
  selector:
    matchLabels:
      k8s-app: metricbeat
  template:
    metadata:
      labels:
        k8s-app: metricbeat
    spec:
      serviceAccountName: metricbeat
      hostNetwork: true
      dnsPolicy: ClusterFirstWithHostNet
      containers:
      - name: metricbeat
        image: docker.elastic.co/beats/metricbeat:7.6.0
        args: [
          "-c", "/etc/metricbeat.yml",
          "-e",
        ]
        env:
        - name: ELASTICSEARCH_HOST
          value: monitoring-elasticsearch-es-http
        - name: ELASTICSEARCH_PORT
          value: "9200"
        - name: ELASTICSEARCH_USERNAME
          value: elastic
        - name: ELASTICSEARCH_PASSWORD
          # value: changeme
          valueFrom:
            secretKeyRef:
              key: elastic
              name: monitoring-elasticsearch-es-elastic-user
        - name: KIBANA_HOST
          value: monitoring-kibana-kb-http
        - name: ELASTIC_CLOUD_ID
          value:
        - name: ELASTIC_CLOUD_AUTH
          value:
        - name: NODE_NAME
          valueFrom:
            fieldRef:
              fieldPath: spec.nodeName
        securityContext:
          runAsUser: 0
        resources:
          limits:
            memory: 200Mi
          requests:
            cpu: 100m
            memory: 100Mi
        volumeMounts:
        - name: config
          mountPath: /etc/metricbeat.yml
          readOnly: true
          subPath: metricbeat.yml
        - name: modules
          mountPath: /usr/share/metricbeat/modules.d
          readOnly: true
        - name: es-certs
          mountPath: /mnt/elastic/tls.crt
          readOnly: true
          subPath: tls.crt
        - name: kb-certs
          mountPath: /mnt/kibana/tls.crt
          readOnly: true
          subPath: tls.crt
      volumes:
      - name: config
        configMap:
          defaultMode: 0600
          name: metricbeat-deployment-config
      - name: modules
        configMap:
          defaultMode: 0600
          name: metricbeat-deployment-modules
      - name: es-certs
        secret:
          secretName: monitoring-elasticsearch-es-http-certs-public
      - name: kb-certs
        secret:
          secretName: monitoring-kibana-kb-http-certs-public
---
apiVersion: rbac.authorization.k8s.io/v1
kind: ClusterRoleBinding
metadata:
  name: metricbeat
subjects:
- kind: ServiceAccount
  name: metricbeat
  namespace: elastic-monitoring
roleRef:
  kind: ClusterRole
  name: metricbeat
  apiGroup: rbac.authorization.k8s.io
---
apiVersion: rbac.authorization.k8s.io/v1
kind: ClusterRole
metadata:
  name: metricbeat
  labels:
    k8s-app: metricbeat
rules:
- apiGroups: [""]
  resources:
  - nodes
  - namespaces
  - events
  - pods
  verbs: ["get", "list", "watch"]
- apiGroups: ["extensions"]
  resources:
  - replicasets
  verbs: ["get", "list", "watch"]
- apiGroups: ["apps"]
  resources:
  - statefulsets
  - deployments
  verbs: ["get", "list", "watch"]
- apiGroups:
  - ""
  resources:
  - nodes/stats
  verbs:
  - get
---
apiVersion: v1
kind: ServiceAccount
metadata:
  name: metricbeat
  namespace: elastic-monitoring
  labels:
    k8s-app: metricbeat
---
上記 yaml を apply する。
$ kubectl apply -f metricbeat.yaml
configmap/metricbeat-daemonset-config created
configmap/metricbeat-daemonset-modules created
daemonset.apps/metricbeat created
configmap/metricbeat-deployment-config created
configmap/metricbeat-deployment-modules created
deployment.apps/metricbeat created
clusterrolebinding.rbac.authorization.k8s.io/metricbeat created
clusterrole.rbac.authorization.k8s.io/metricbeat created
serviceaccount/metricbeat created

$ kubectl get po -n elastic-monitoring | grep metricbeat
metricbeat-57jpz                            1/1     Running   0          15s
metricbeat-67b75b56b5-4r9jn                 1/1     Running   0          15s
metricbeat-8kmg7                            1/1     Running   0          15s
metricbeat-fwfmn                            1/1     Running   0          15s
metricbeat-jckss                            1/1     Running   0          15s
metricbeat-r9vkj                            1/1     Running   0          15s
metricbeat-rrm69                            1/1     Running   0          15s
metricbeat-sx5b8                            1/1     Running   0          15s
metricbeat-wq498                            1/1     Running   0          15s
7. auditbeat の構築
auditbeat では ファイル整合性チェックに使用できるようなので入れておく。(下記は auditbeat サイト記載引用)
Auditbeat Docker images can be used on Kubernetes to check files integrity.
$ curl -L -O https://raw.githubusercontent.com/elastic/beats/7.6/deploy/kubernetes/auditbeat-kubernetes.yaml
  % Total    % Received % Xferd  Average Speed   Time    Time     Time  Current
                                 Dload  Upload   Total   Spent    Left  Speed
100  4288  100  4288    0     0   9329      0 --:--:-- --:--:-- --:--:--  9342
$ sed -e 's/namespace: kube-system/namespace: elastic-monitoring/g' auditbeat-kubernetes.yaml > auditbeat.yaml
修正内容は filebeat で挙げた namespace. 認証. tolerations のため省略して、下記の通り。
---
apiVersion: v1
kind: ConfigMap
metadata:
  name: auditbeat-config
  namespace: elastic-monitoring
  labels:
    k8s-app: auditbeat
data:
  auditbeat.yml: |-
    auditbeat.config.modules:
      # Mounted `auditbeat-daemonset-modules` configmap:
      path: ${path.config}/modules.d/*.yml
      # Reload module configs as they change:
      reload.enabled: false

    processors:
      - add_cloud_metadata:

    cloud.id: ${ELASTIC_CLOUD_ID}
    cloud.auth: ${ELASTIC_CLOUD_AUTH}

    output.elasticsearch:
      hosts: ['https://${ELASTICSEARCH_HOST:elasticsearch}:${ELASTICSEARCH_PORT:9200}']
      username: ${ELASTICSEARCH_USERNAME}
      password: ${ELASTICSEARCH_PASSWORD}
      ssl.certificate_authorities:
        - /mnt/elastic/tls.crt

    setup.kibana:
      host: "https://${KIBANA_HOST}:5601"
      username: ${ELASTICSEARCH_USERNAME}
      password: ${ELASTICSEARCH_PASSWORD}
      protocol: "https"
      ssl.certificate_authorities:
        - /mnt/kibana/tls.crt
    setup.dashboards:
      enabled: true

    xpack.monitoring.enabled: true
---
apiVersion: v1
kind: ConfigMap
metadata:
  name: auditbeat-daemonset-modules
  namespace: elastic-monitoring
  labels:
    k8s-app: auditbeat
data:
  system.yml: |-
    - module: file_integrity
      paths:
      - /hostfs/bin
      - /hostfs/usr/bin
      - /hostfs/sbin
      - /hostfs/usr/sbin
      - /hostfs/etc
      exclude_files:
      - '(?i)\.sw[nop]$'
      - '~$'
      - '/\.git($|/)'
      scan_at_start: true
      scan_rate_per_sec: 50 MiB
      max_file_size: 100 MiB
      hash_types: [sha1]
      recursive: true
---
# Deploy a auditbeat instance per node for node metrics retrieval
apiVersion: apps/v1
kind: DaemonSet
metadata:
  name: auditbeat
  namespace: elastic-monitoring
  labels:
    k8s-app: auditbeat
spec:
  selector:
    matchLabels:
      k8s-app: auditbeat
  template:
    metadata:
      labels:
        k8s-app: auditbeat
    spec:
      tolerations:
        - key: node-role.kubernetes.io/master
          effect: NoSchedule
      serviceAccountName: auditbeat
      terminationGracePeriodSeconds: 30
      hostNetwork: true
      dnsPolicy: ClusterFirstWithHostNet
      containers:
      - name: auditbeat
        image: docker.elastic.co/beats/auditbeat:7.6.0
        args: [
          "-c", "/etc/auditbeat.yml"
        ]
        env:
        - name: ELASTICSEARCH_HOST
          value: monitoring-elasticsearch-es-http
        - name: ELASTICSEARCH_PORT
          value: "9200"
        - name: ELASTICSEARCH_USERNAME
          value: elastic
        - name: ELASTICSEARCH_PASSWORD
          valueFrom:
            secretKeyRef:
              key: elastic
              name: monitoring-elasticsearch-es-elastic-user
        - name: KIBANA_HOST
          value: monitoring-kibana-kb-http
        - name: ELASTIC_CLOUD_ID
          value:
        - name: ELASTIC_CLOUD_AUTH
          value:
        securityContext:
          runAsUser: 0
        resources:
          limits:
            memory: 200Mi
          requests:
            cpu: 100m
            memory: 100Mi
        volumeMounts:
        - name: config
          mountPath: /etc/auditbeat.yml
          readOnly: true
          subPath: auditbeat.yml
        - name: modules
          mountPath: /usr/share/auditbeat/modules.d
          readOnly: true
        - name: bin
          mountPath: /hostfs/bin
          readOnly: true
        - name: sbin
          mountPath: /hostfs/sbin
          readOnly: true
        - name: usrbin
          mountPath: /hostfs/usr/bin
          readOnly: true
        - name: usrsbin
          mountPath: /hostfs/usr/sbin
          readOnly: true
        - name: etc
          mountPath: /hostfs/etc
          readOnly: true
        - name: es-certs
          mountPath: /mnt/elastic/tls.crt
          readOnly: true
          subPath: tls.crt
        - name: kb-certs
          mountPath: /mnt/kibana/tls.crt
          readOnly: true
          subPath: tls.crt
      volumes:
      - name: bin
        hostPath:
          path: /bin
      - name: usrbin
        hostPath:
          path: /usr/bin
      - name: sbin
        hostPath:
          path: /sbin
      - name: usrsbin
        hostPath:
          path: /usr/sbin
      - name: etc
        hostPath:
          path: /etc
      - name: config
        configMap:
          defaultMode: 0600
          name: auditbeat-config
      - name: modules
        configMap:
          defaultMode: 0600
          name: auditbeat-daemonset-modules
      - name: data
        hostPath:
          path: /var/lib/auditbeat-data
          type: DirectoryOrCreate
      - name: es-certs
        secret:
          secretName: monitoring-elasticsearch-es-http-certs-public
      - name: kb-certs
        secret:
          secretName: monitoring-kibana-kb-http-certs-public
---
apiVersion: rbac.authorization.k8s.io/v1
kind: ClusterRoleBinding
metadata:
  name: auditbeat
subjects:
- kind: ServiceAccount
  name: auditbeat
  namespace: elastic-monitoring
roleRef:
  kind: ClusterRole
  name: auditbeat
  apiGroup: rbac.authorization.k8s.io
---
apiVersion: rbac.authorization.k8s.io/v1
kind: ClusterRole
metadata:
  name: auditbeat
  labels:
    k8s-app: auditbeat
rules:
- apiGroups: [""]
  resources:
  - nodes
  - namespaces
  - pods
  verbs: ["get", "list", "watch"]
---
apiVersion: v1
kind: ServiceAccount
metadata:
  name: auditbeat
  namespace: elastic-monitoring
  labels:
    k8s-app: auditbeat
---
上記 yaml を apply する。
$ kubectl apply -f auditbeat.yaml
configmap/auditbeat-config unchanged
configmap/auditbeat-daemonset-modules unchanged
daemonset.apps/auditbeat created
clusterrolebinding.rbac.authorization.k8s.io/auditbeat created
clusterrole.rbac.authorization.k8s.io/auditbeat created
serviceaccount/auditbeat created

$ kubectl get po -n elastic-monitoring | grep audit
auditbeat-5s6rh                             1/1     Running   0          53s
auditbeat-6xrkc                             1/1     Running   0          53s
auditbeat-846pz                             1/1     Running   0          53s
auditbeat-8szhp                             1/1     Running   0          53s
auditbeat-9kqsf                             1/1     Running   0          53s
auditbeat-njf45                             1/1     Running   0          53s
auditbeat-v7swg                             1/1     Running   0          53s
auditbeat-vx4hv                             1/1     Running   0          53s
Kibanaでの表示確認
構築ステップが完了すると kibana で色々表示できるので確認する。
Metrics
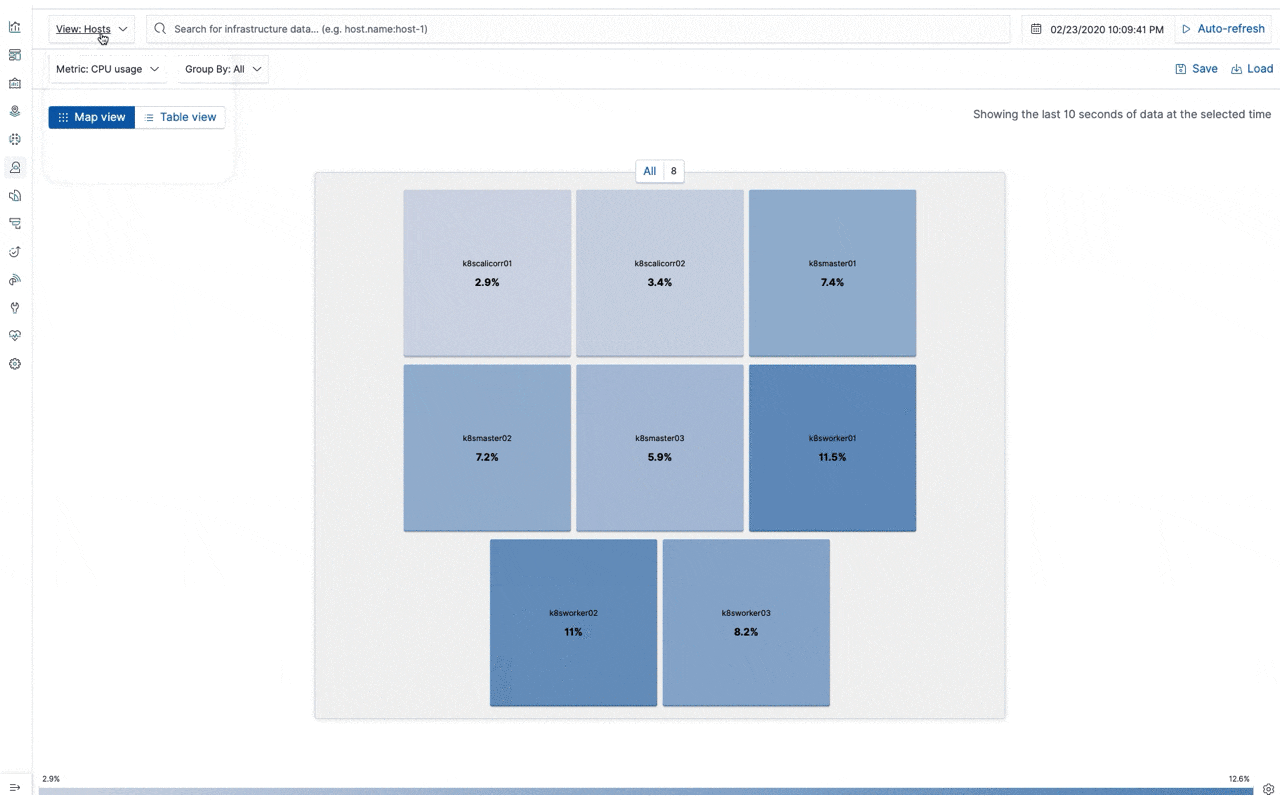
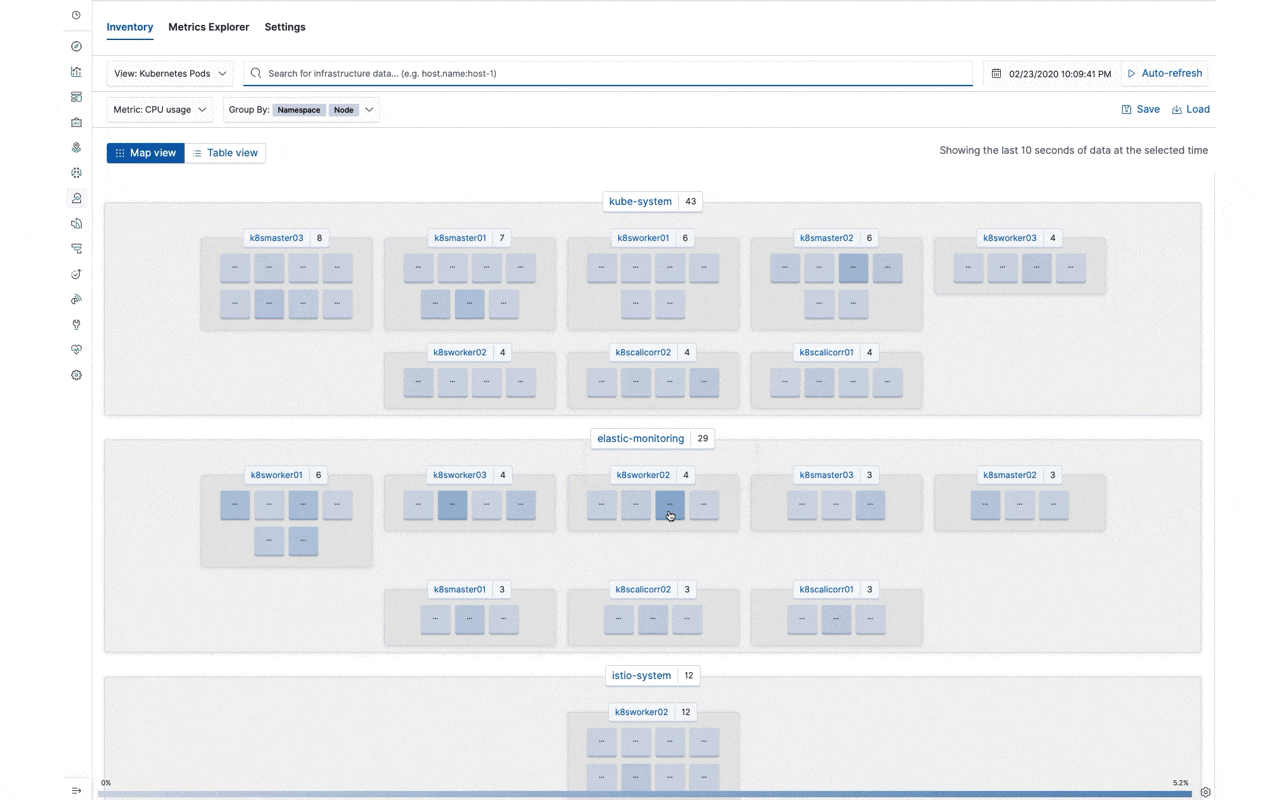
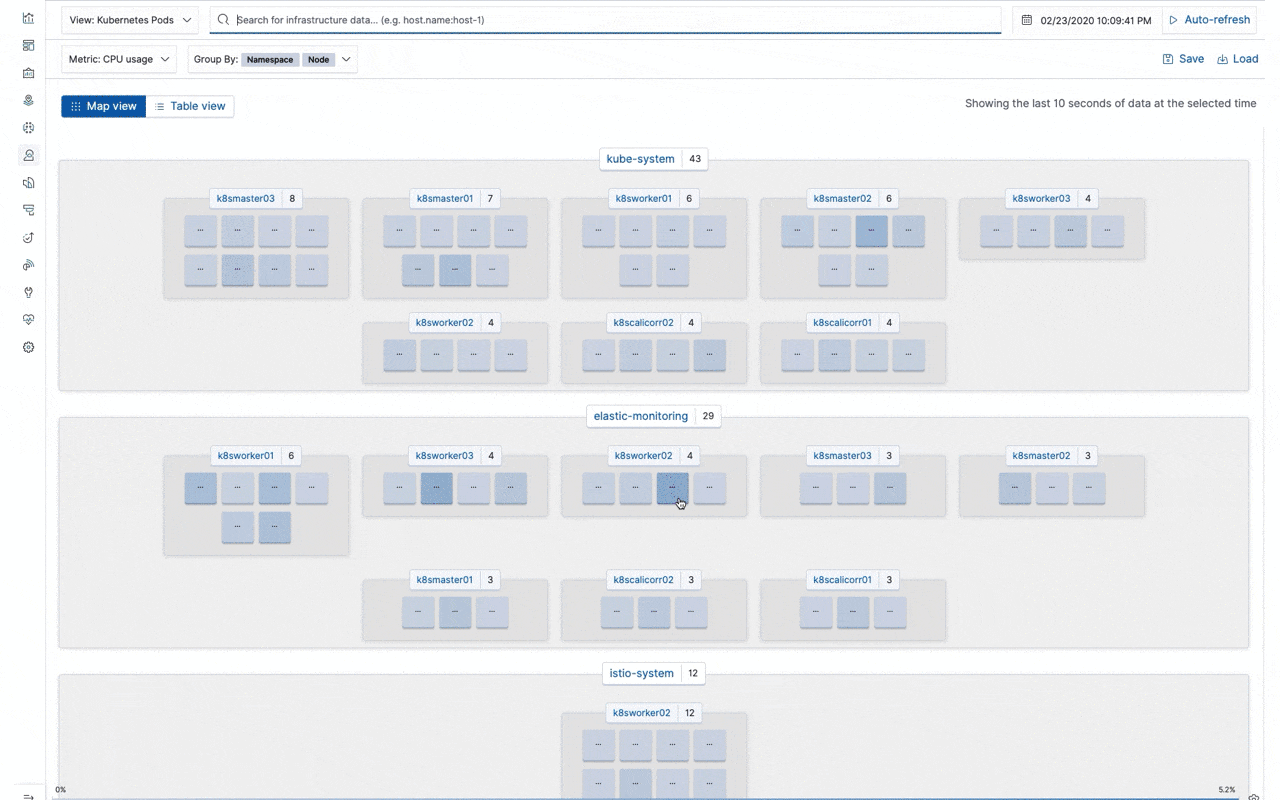
メトリクスを見ながら必要な単位でログを閲覧することが可能となる。
- Host, Pod 単位での CPU/Memory/Traffic などのメトリクス表示が可能
- Pod は Namespace, Node などに囲って表示も可能
- Host, Pod 単位で Log 確認が可能
Node 単位での Metrics, Log の表示
Pod 全体 -> Pod Namespace 単位 -> Pod Namespace & Node 単位
(Pod 単位で出ている % は CPU Usage. 他にも Memory Usage, Inbound Traffic, Outbound Traffic に変更可能)
Pod 単位での Metrics 表示
Pod 単位での Log 表示
Dashboard [Filebeat System] Syslog dashboard ECS
- syslogがノード単位で取得できていることが確認できる
- ノードへのログイン履歴等も確認可能
Syslog 表示 (ノード単位)
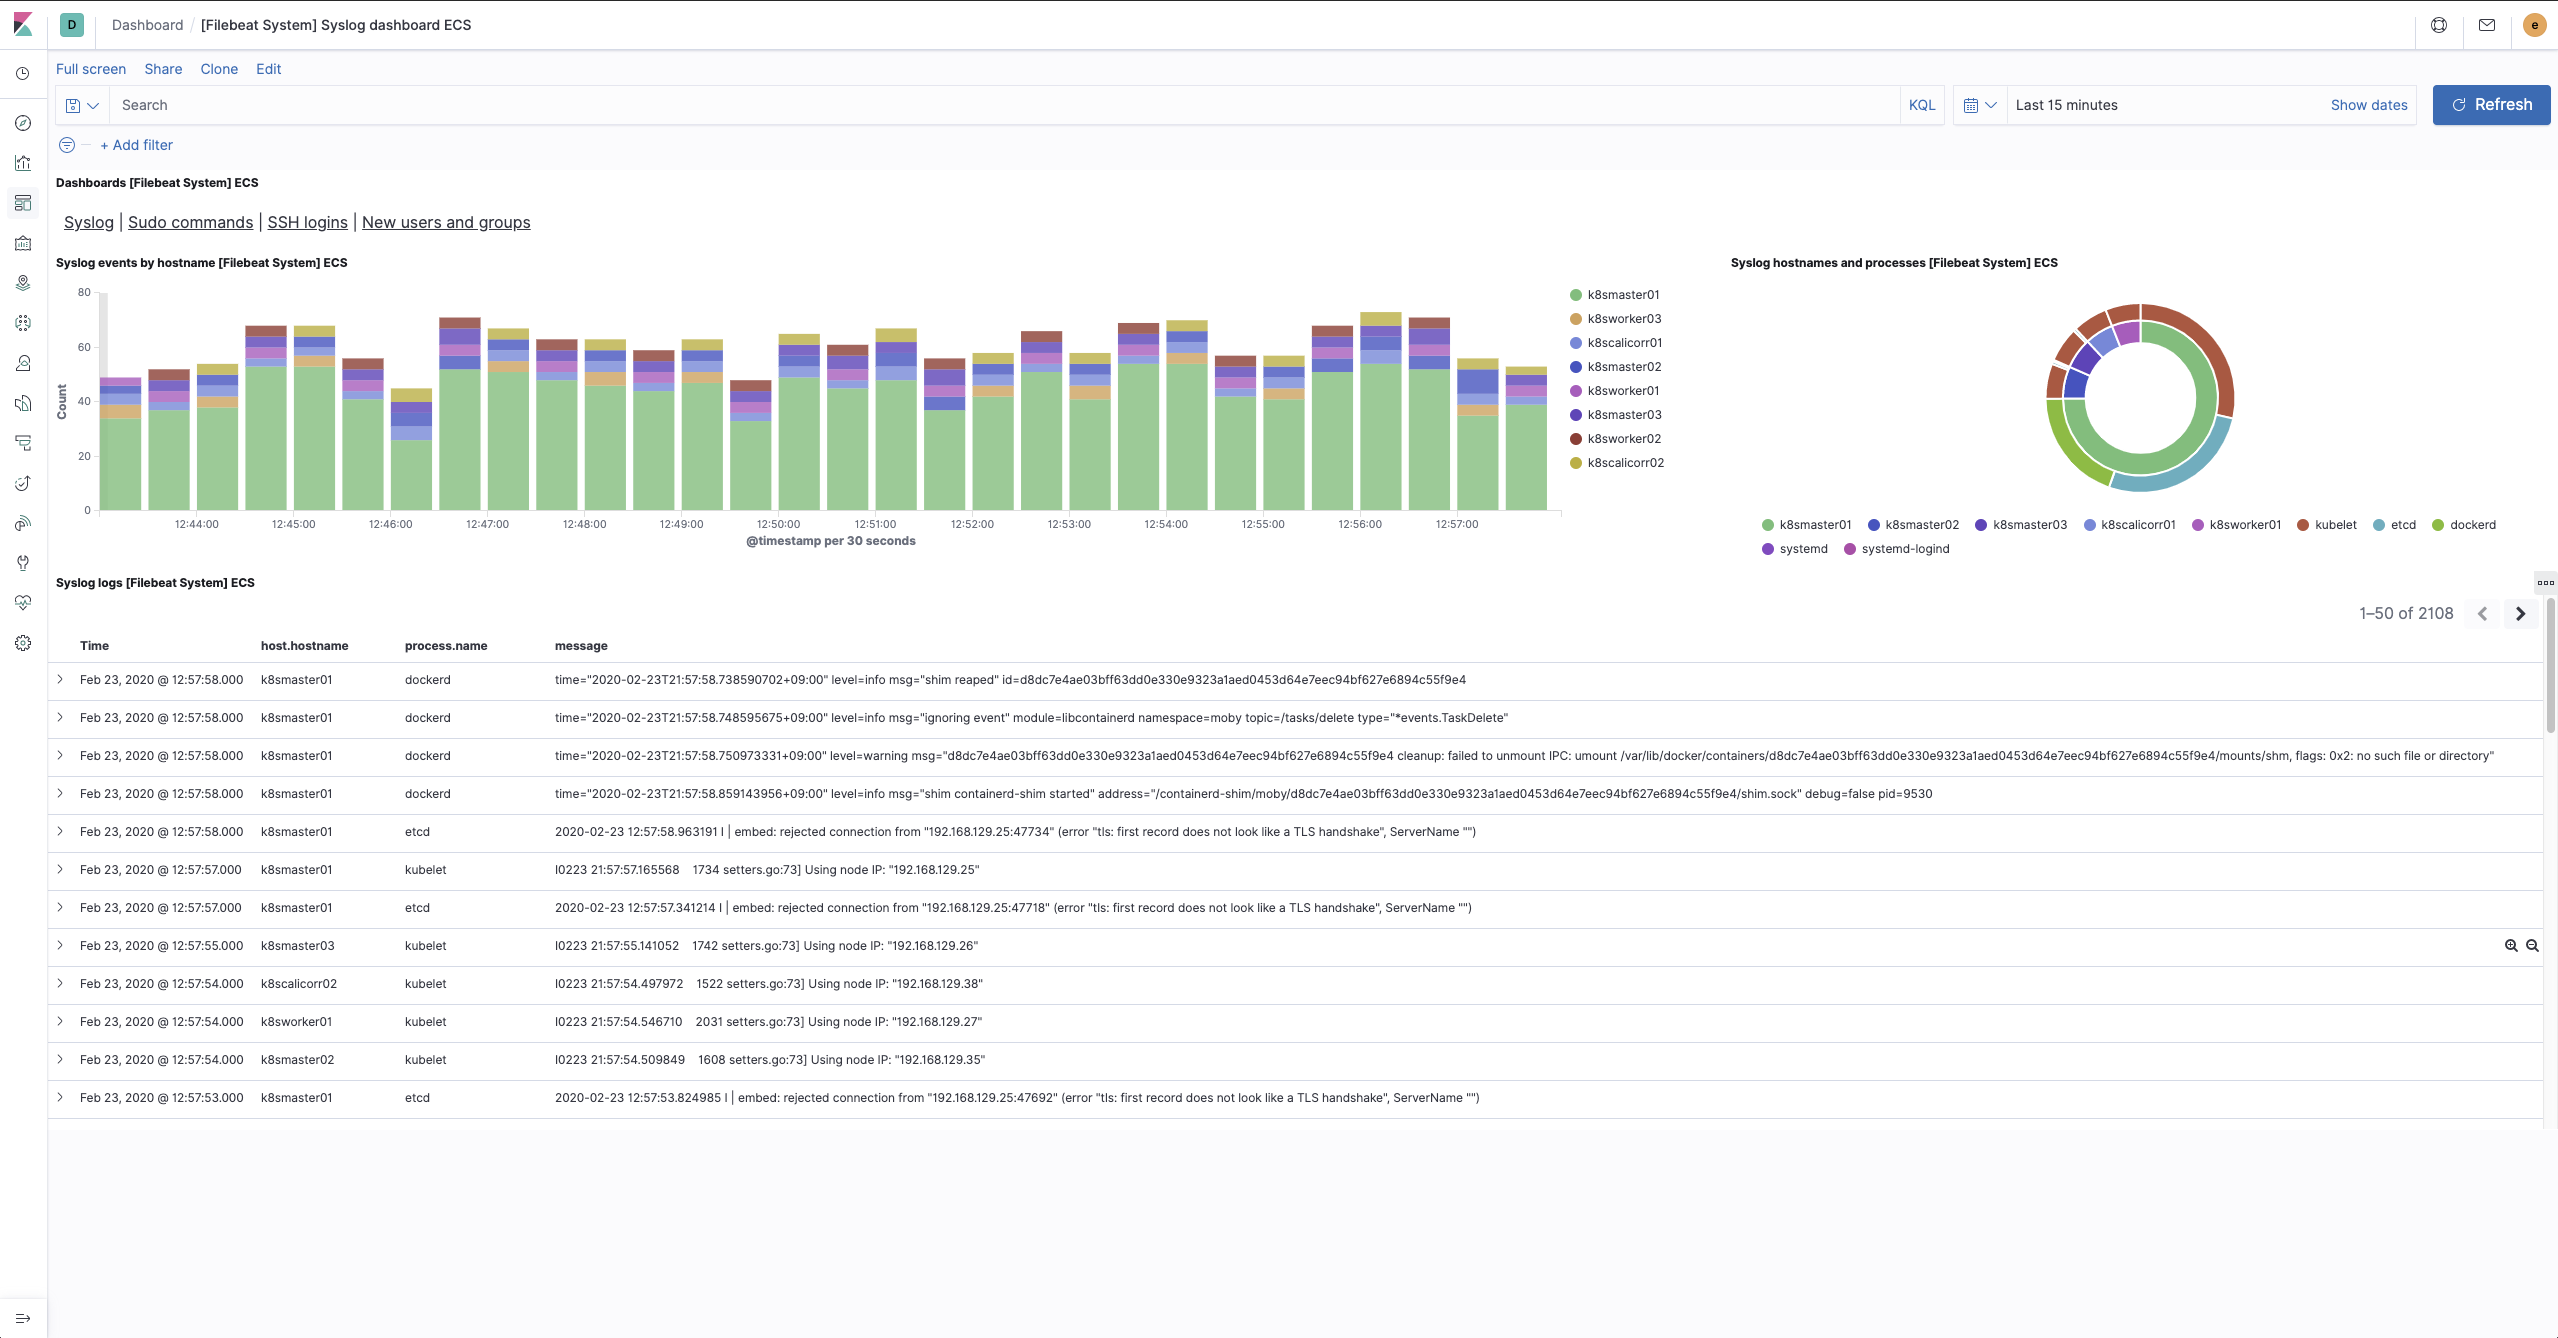
SSH ログイン時系列
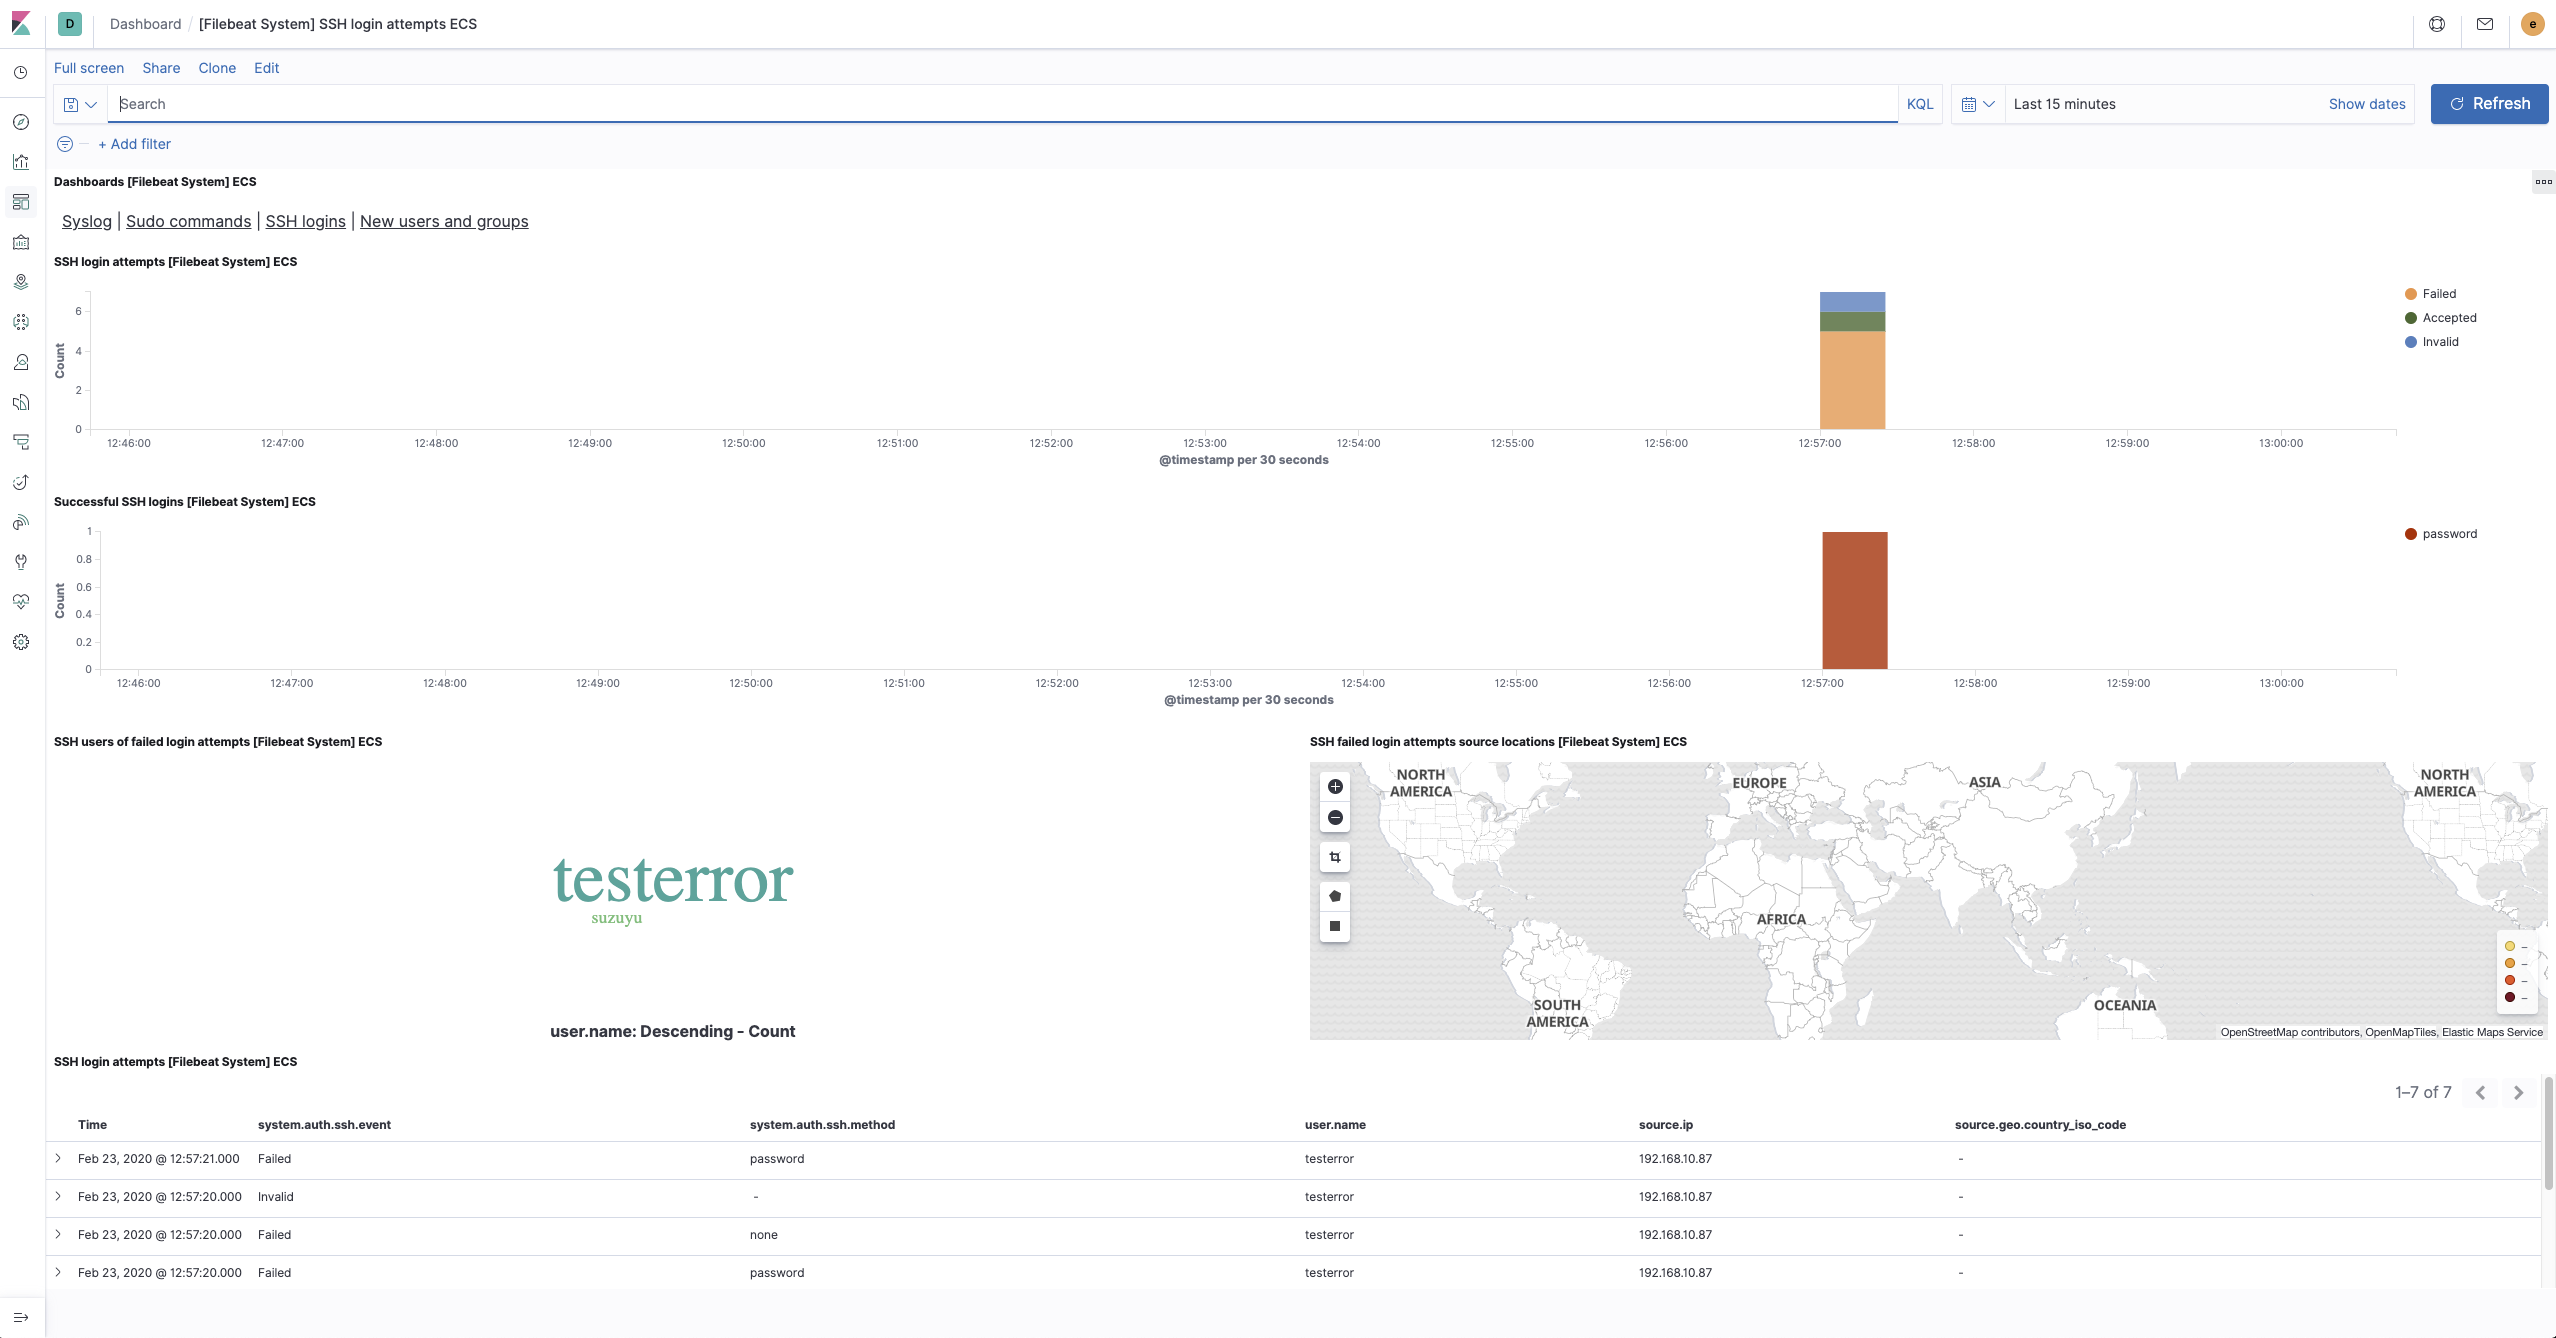
※ testerror と言うユーザでログインミスをした結果
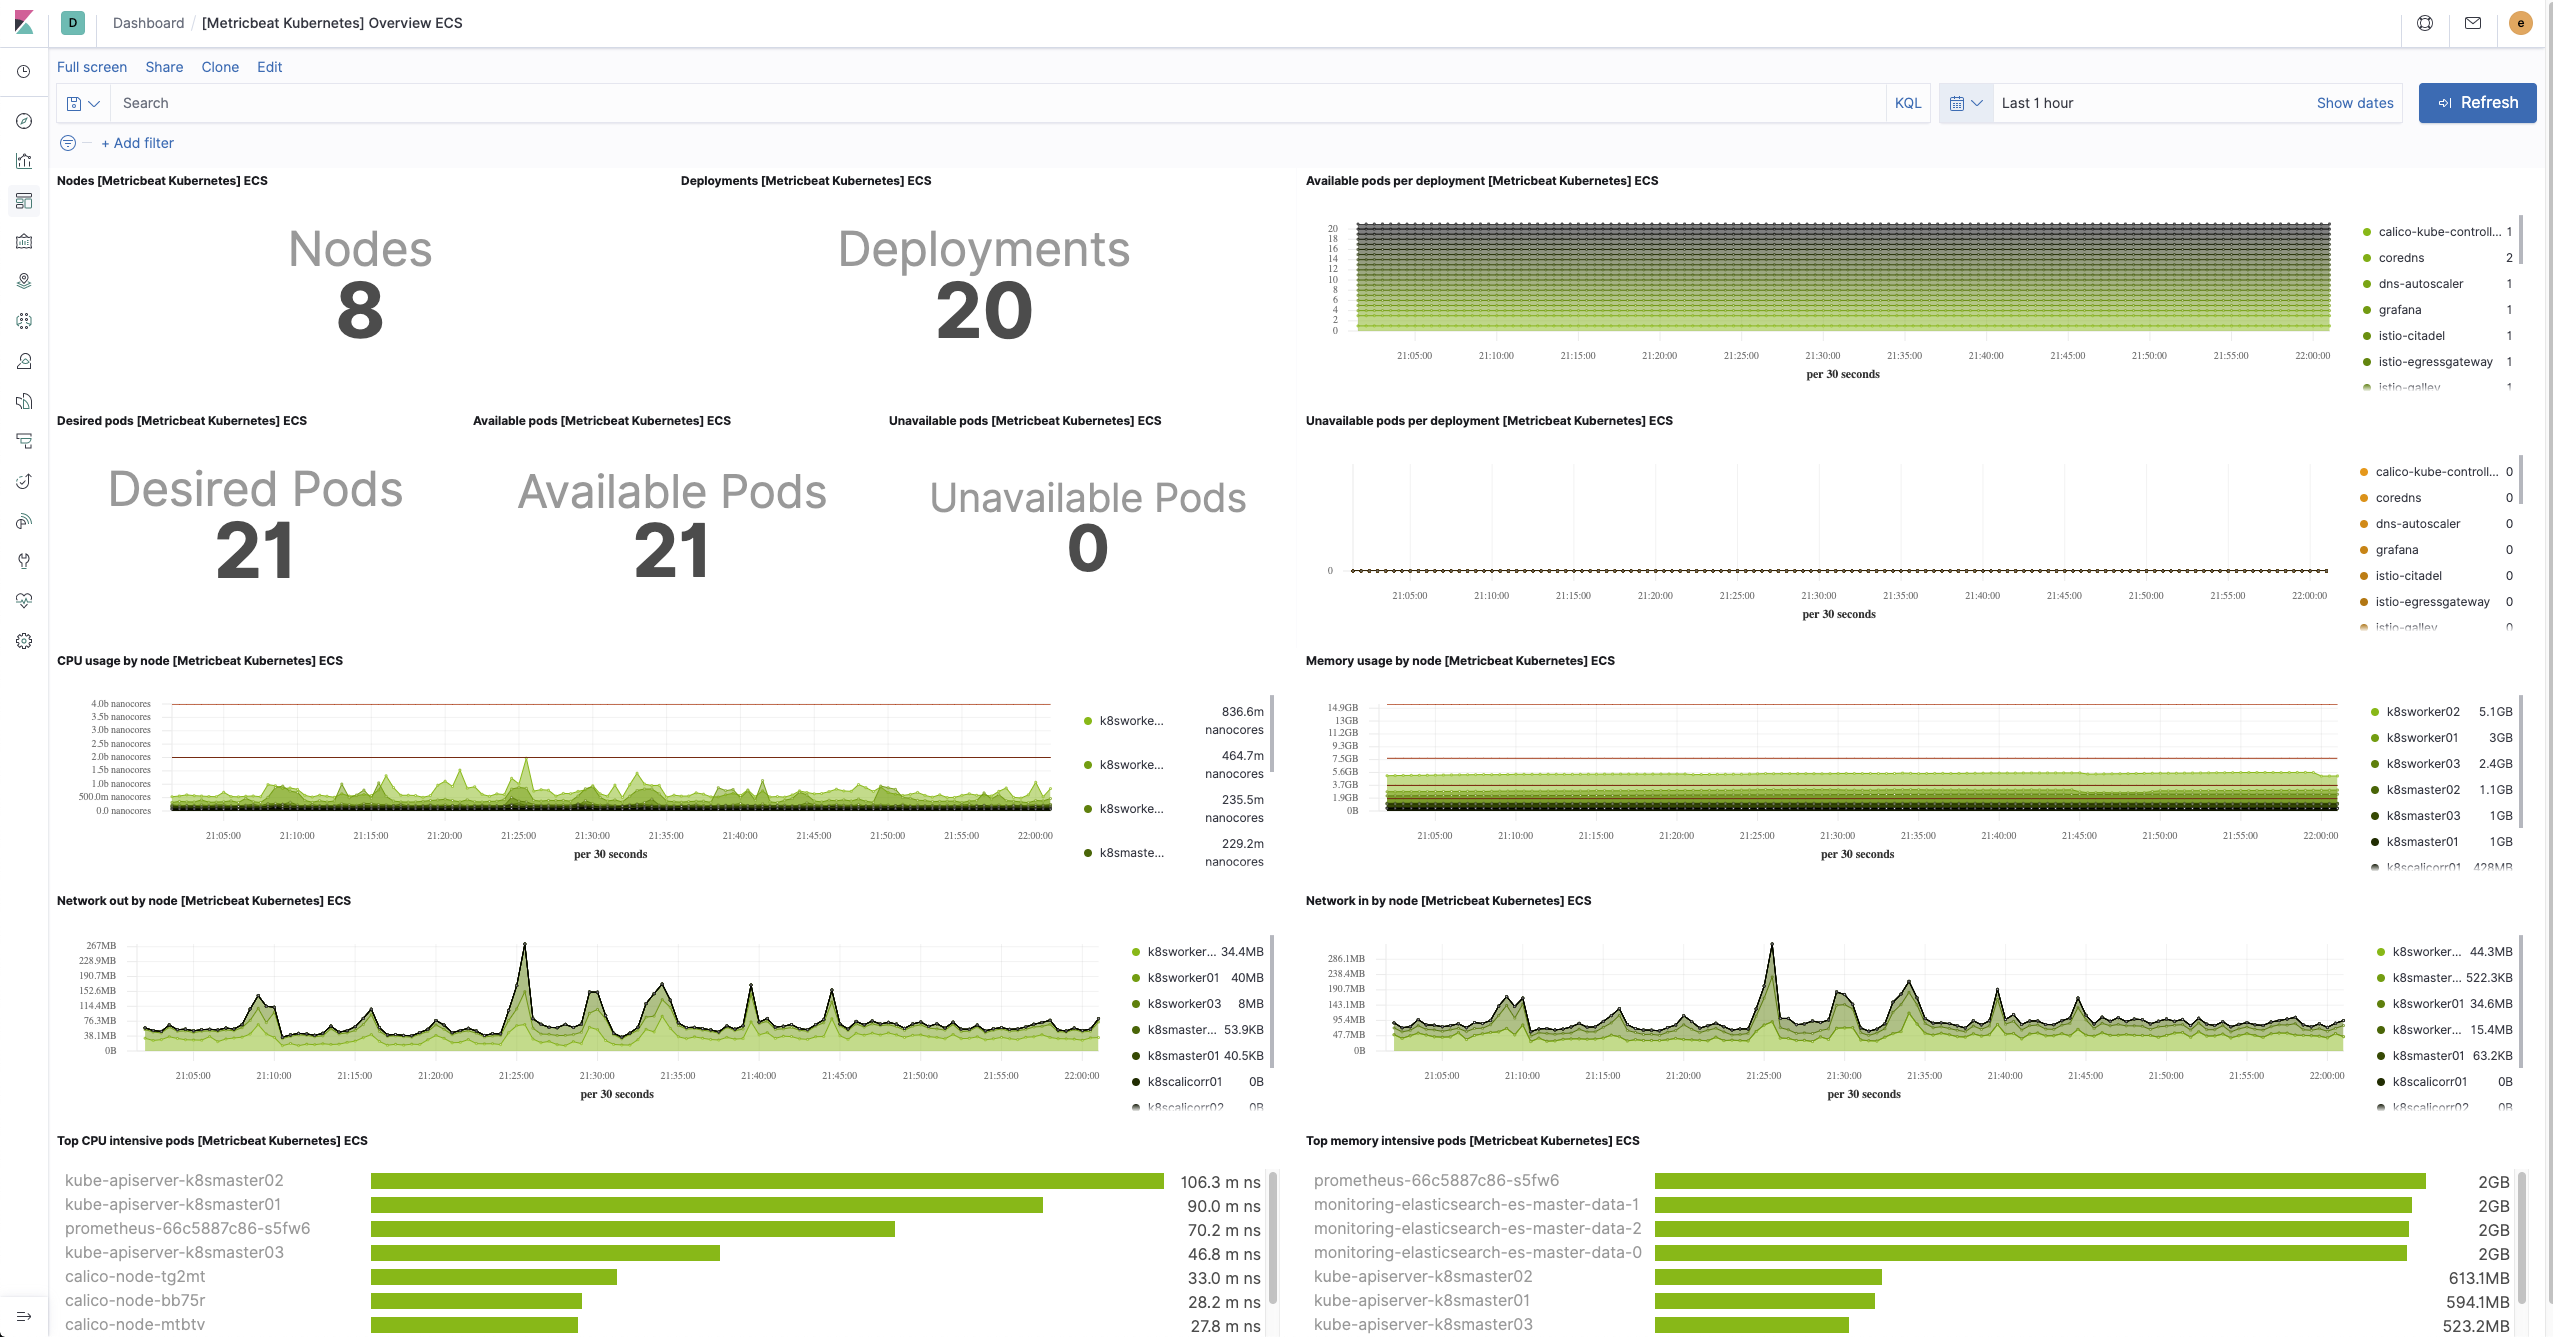
Dashboard [Metricbeat Kubernetes] Overview ECS
- Pod/Devployment や各種リソースが一覧で見れる
Dashboard [Auditbeat File Integrity] Overview ECS
- ファイル整合性チェック結果の表示
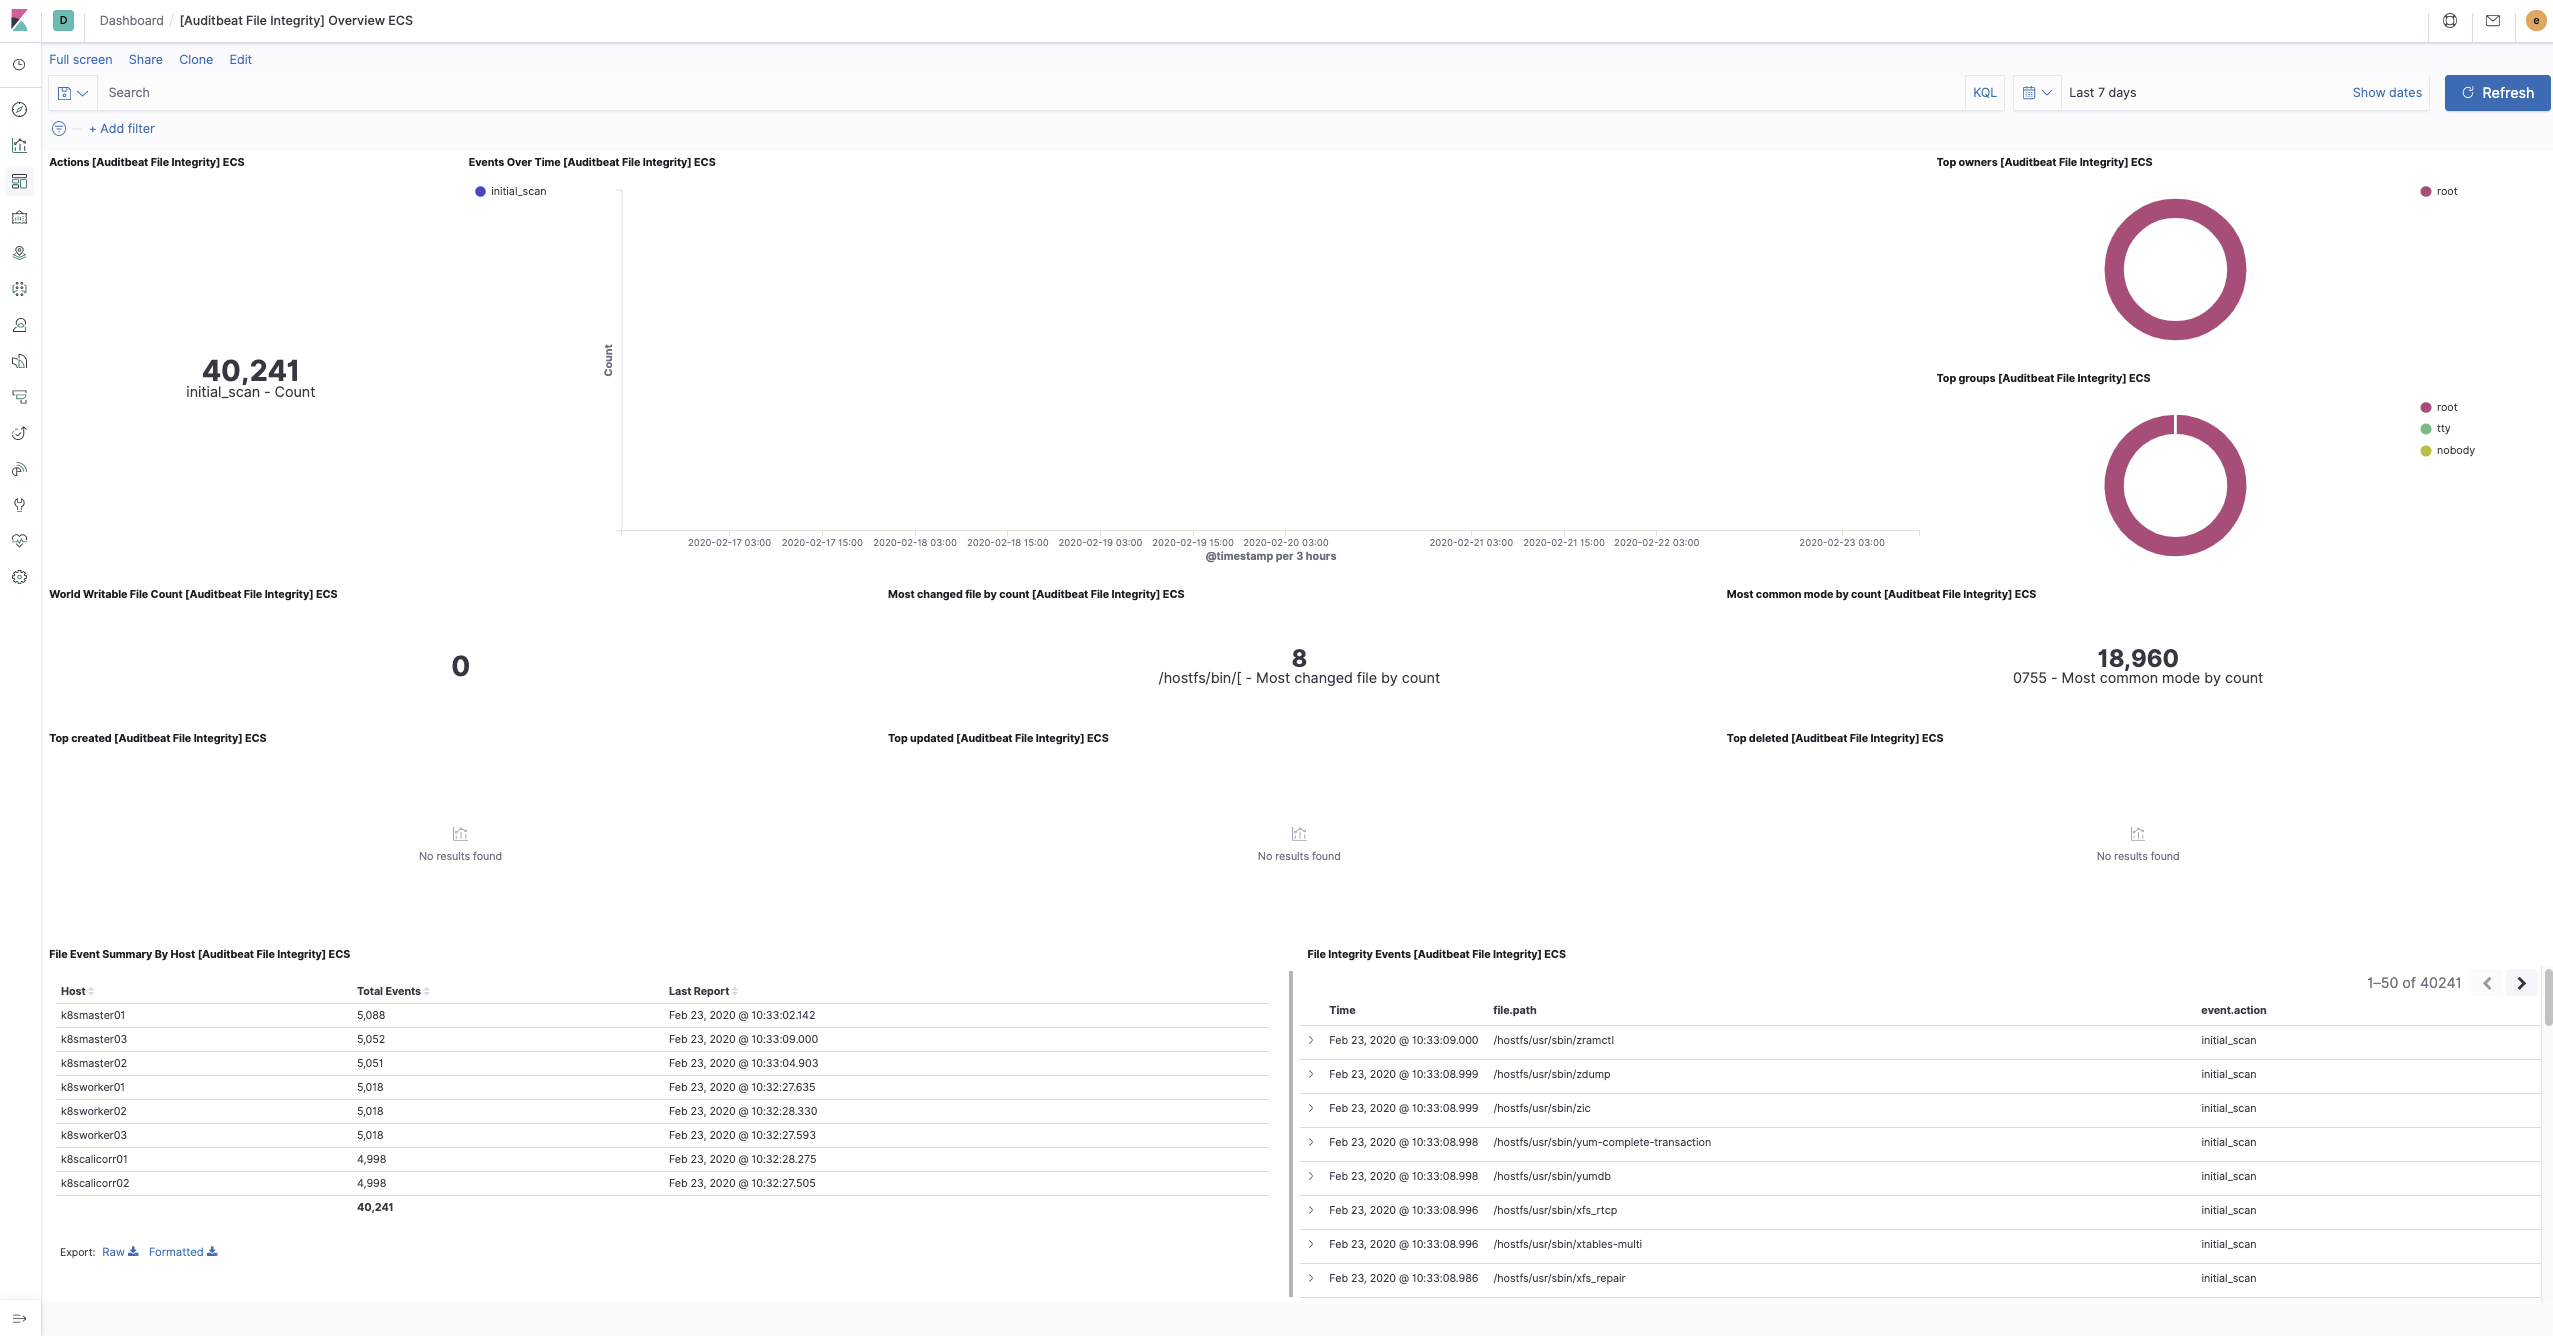
※作ったばかりなので initial scan 結果しか出てない
おわりに
Kubernetes クラスタのログ・メトリクス表示環境の構築を ElasticStack で実現できた。
Kubernetes でのノード・ Pod 単位で何かがあった際に、メトリクスを確認しながら対象のログを絞って見ることができるようになった。
今後は外部の Netflow, log などの取得・可視化を、この環境に filebeat などを別途構築して連携実施する予定。