概要
Tkinterを使ってお絵描きする
ホストはUbuntu24.04
venv作成
ホストのPCで、
$ sudo apt update
$ sudo apt install python3-tk
しておく。
ここで注意なのはpyenvを使っている場合で、python3-tkがpyenv先に入らないと、このあとのthonny起動で
ModuleNotFoundError: No module named '_tkinter'
になるので注意。ここでは以下の環境でvenvを作る
$ which python
/usr/bin/python
$ python -m venv tkenv
$ source tkenv/bin/activate
(tkenv)$ which python
$HOME/tkenv/bin/python
matplotlibのグラフ描画
thonnyを実行する
(tkenv)$ thonny
thonny起動後、以下を実行する
import tkinter as tk
from matplotlib.backends.backend_tkagg import FigureCanvasTkAgg
import matplotlib.pyplot as plt

root = tk.Tk()
root.title("Matplotlib in Tkinter")

# グラフ作成
fig, ax = plt.subplots()
ax.plot([1, 2, 3, 4], [10, 20, 15, 30])
ax.set_title("Sample Graph")

# Tkinterに埋め込み
canvas = FigureCanvasTkAgg(fig, master=root)
canvas.draw()
canvas.get_tk_widget().pack()

root.mainloop()
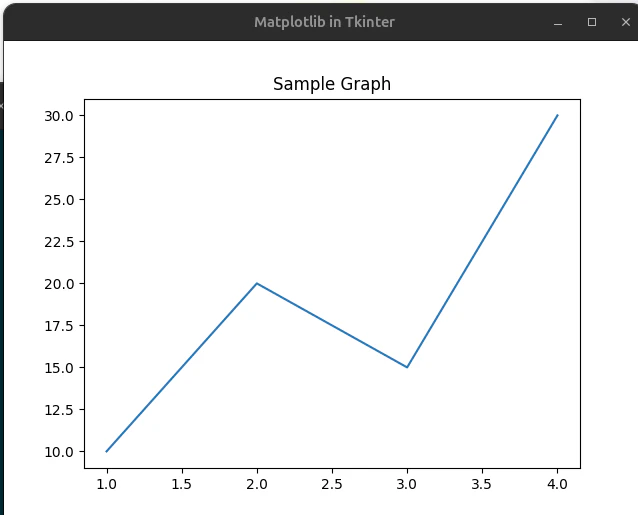
こんなグラフが出た。
Canvasのグラフ描画
サンプルは以下
import tkinter as tk
import random

WIDTH = 400
HEIGHT = 200
MAX_POINTS = 100

class RealtimeGraph:
    def __init__(self, canvas):
        self.canvas = canvas
        self.data = [0] * MAX_POINTS

    def add_data(self, value):
        # 左にシフトして右に追加
        self.data.pop(0)
        self.data.append(value)

    def draw(self):
        self.canvas.delete("all")

        max_val = max(self.data) if max(self.data) != 0 else 1

        points = []
        for i, val in enumerate(self.data):
            x = i * (WIDTH / MAX_POINTS)
            y = HEIGHT - (val / max_val) * HEIGHT
            points.append((x, y))

        # 線描画
        for i in range(len(points) - 1):
            self.canvas.create_line(points[i], points[i+1], fill="blue")

root = tk.Tk()
canvas = tk.Canvas(root, width=WIDTH, height=HEIGHT, bg="white")
canvas.pack()

graph = RealtimeGraph(canvas)

def update():
    # 仮データ(ここをUARTとかに置き換える)
    value = random.randint(0, 100)
    graph.add_data(value)
    graph.draw()

    root.after(100, update)  # 100ms周期

update()
root.mainloop()
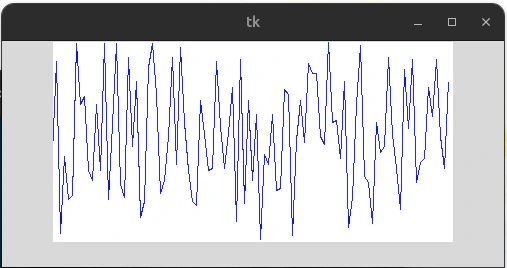
リアルタイムで変化するこんなグラフが出る。
次のポイント
ArduinoやPicoからuartで取得したデータをCanvasにプロットして、グラフを書いてみる。