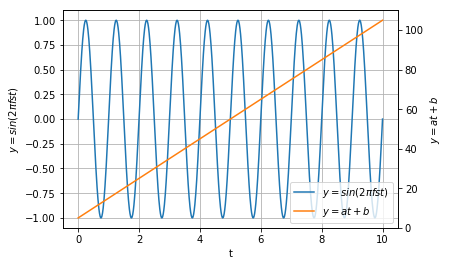
二つの軸があるグラフを書くには、1つ目は通常通りの方法でグラフを書き、ax2=ax1.twinx()のようにして生成したax2を使ってx軸が共通で異なるy軸のグラフを書く。
import matplotlib.pyplot as plt
import matplotlib.cm as cm
import numpy as np
%matplotlib inline

fig = plt.figure()
ax1 = fig.add_subplot(111)
t = np.linspace(0.0,10.0,1000)
fs = 1.0
y1 = np.sin(2.0*np.pi*fs*t)
ln1=ax1.plot(t, y1,'C0',label=r'$y=sin(2\pi fst)$')

ax2 = ax1.twinx()
y2 = 10.0*t + 5.0
ln2=ax2.plot(t,y2,'C1',label=r'$y=at+b$')

h1, l1 = ax1.get_legend_handles_labels()
h2, l2 = ax2.get_legend_handles_labels()
ax1.legend(h1+h2, l1+l2, loc='lower right')

ax1.set_xlabel('t')
ax1.set_ylabel(r'$y=sin(2\pi fst)$')
ax1.grid(True)
ax2.set_ylabel(r'$y=at+b$')