はじめに
移植やってます。
matplotlib (Python)
plt.figure()
plt.hist([peptide['m/z'] for peptide in peptides],
    bins = 2000,
    range=(0,4000))
plt.xlabel('m/z, Th')
plt.ylabel('# of peptides within 2 Th bin')

plt.show()
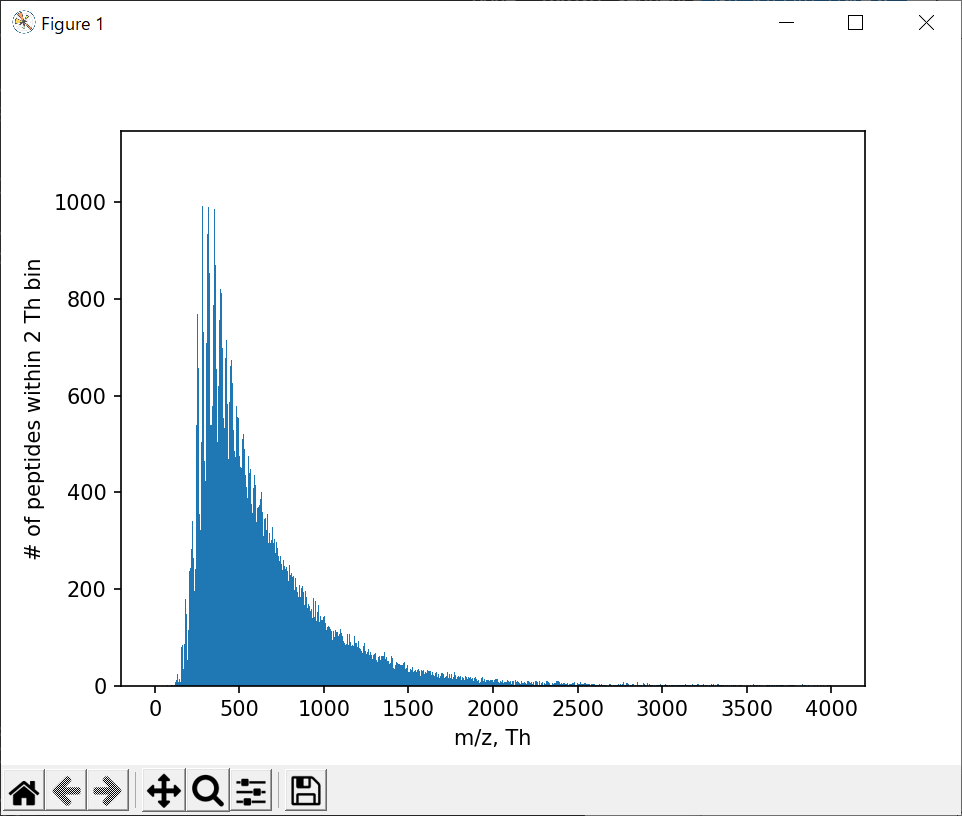
range=(0,4000)ここがタプルなので嫌な予感が。
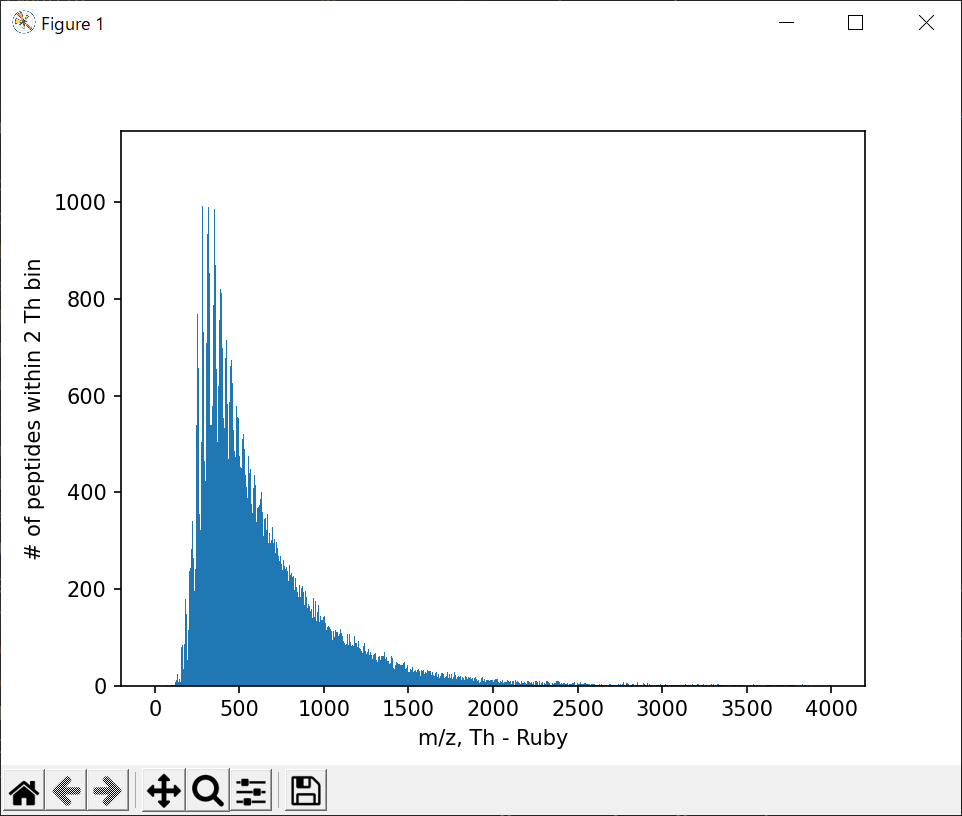
どうする? (Ruby)
require 'matplotlib/pyplot'
plt = Matplotlib::Pyplot

plt.figure()
plt.hist(peptides.map{ _1['m/z'] },
    bins = 2000,
    range = [0,4000])
plt.xlabel('m/z, Th')
plt.ylabel('# of peptides within 2 Th bin')

plt.show()

ちがくね?
select (Ruby)
plt.hist(peptides.map{ _1['m/z'] }.select{ _1 < 4000 },
    bins = 2000)

まあ、こんなもんか。
: (ruby)
plt.hist(peptides.map{ _1['m/z'] },
    bins: 2000,
    range: [0, 4000])
おお、ドンずば。
こちらのサイトを参照しました。
メモ
- Python の matplotlib を学習した
- 道のりは遠そう