データ解析をするとき、目的変数と説明変数の散布図をとりあえず描いてみることが多いと思います。
RにはGGallyパッケージにggpairs()という関数があり、これを使っている方も多いと思います。ですが、説明変数の数が増えてくると、それぞれの図が非常に小さくなり、見づらくなると思います。
※今回は説明変数が6つなので、そこまで有難みを感じにくいと思いますが。。
そこで、散布図のみを**tidyr::gather()とggplot2::facet_wrap()**を使って描く方法を紹介します。
※ggpairs()に関しては、以下のサイトが参考になると思います。
GGallyパッケージのggpair関数を使いこなすための覚え書き
今回はdiamonds データセットを用います。
library(tidyverse) #tidyverseを読み込む
df <- diamonds
df %>% head() #データの確認
# A tibble: 6 x 10
  carat cut       color clarity depth table price     x     y     z
  <dbl> <ord>     <ord> <ord>   <dbl> <dbl> <int> <dbl> <dbl> <dbl>
1 0.23  Ideal     E     SI2      61.5    55   326  3.95  3.98  2.43
2 0.21  Premium   E     SI1      59.8    61   326  3.89  3.84  2.31
3 0.23  Good      E     VS1      56.9    65   327  4.05  4.07  2.31
4 0.290 Premium   I     VS2      62.4    58   334  4.2   4.23  2.63
5 0.31  Good      J     SI2      63.3    58   335  4.34  4.35  2.75
6 0.24  Very Good J     VVS2     62.8    57   336  3.94  3.96  2.48
df1 <-
df %>% gather(key = key,value = value,c(carat, depth,table, x, y, z)) #数値型の説明変数をgather()
df1 %>% head() #データの確認
# A tibble: 6 x 6
  cut       color clarity price key   value
  <ord>     <ord> <ord>   <int> <chr> <dbl>
1 Ideal     E     SI2       326 carat 0.23
2 Premium   E     SI1       326 carat 0.21
3 Good      E     VS1       327 carat 0.23
4 Premium   I     VS2       334 carat 0.290
5 Good      J     SI2       335 carat 0.31
6 Very Good J     VVS2      336 carat 0.24
# グラフの描画
# x軸に説明変数(carat, depth,table, x, y, z)、y軸に目的変数(price)を描く
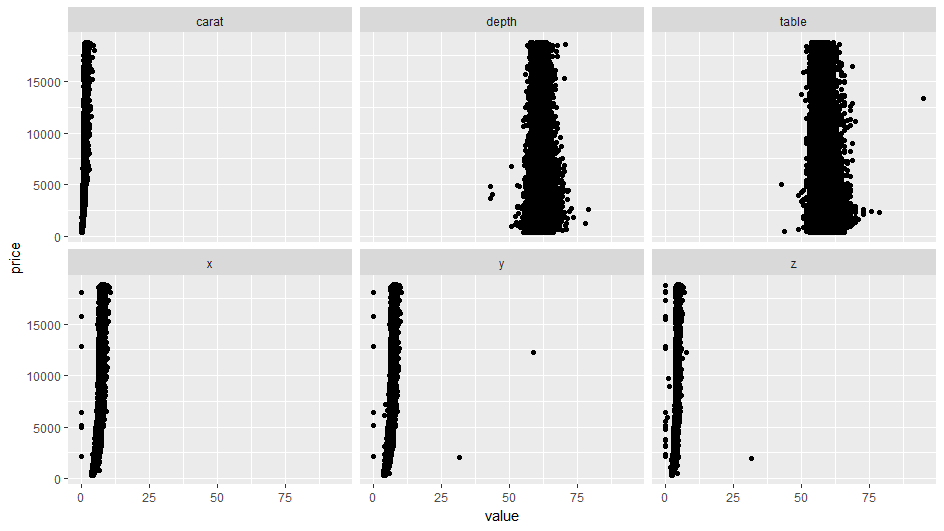
ggplot(df1)+
  geom_point(aes(x=value,y=price))+
  facet_wrap(~key)
このように**tidyr::gather()とggplot2::facet_wrap()**を使うと目的変数と説明変数の散布図の一覧が描けます。
しかし、この図だとx軸のスケールが共通のものとなってしまい、目的変数と説明変数の関係がわかりづらいです。
そこで、説明変数をMin-Max Normalization(正規化)してみます。正規化についてはいろいろなサイトで開設されています。
(参考)データの正規化(最大値・最小値バージョン、平均・分散バージョン)
df2 <-
  df1 %>% group_by(key) %>%
  mutate(ScaledValue=(value-min(value))/(max(value)-min(value))) #group_by()で指定したkeyのグループ毎に、正規化を行う
df2 %>% head() #データの確認
# A tibble: 6 x 7
# Groups:   key [1]
  cut       color clarity price key   value ScaledValue
  <ord>     <ord> <ord>   <int> <chr> <dbl>       <dbl>
1 Ideal     E     SI2       326 carat 0.23      0.00624
2 Premium   E     SI1       326 carat 0.21      0.00208
3 Good      E     VS1       327 carat 0.23      0.00624
4 Premium   I     VS2       334 carat 0.290     0.0187
5 Good      J     SI2       335 carat 0.31      0.0229
6 Very Good J     VVS2      336 carat 0.24      0.00832
group_by()でグループ化した後の関数の挙動については以下の記事が参考になります。
dplyrでdoして楽をする
dplyrのsummarise, doの使い分けについてのメモ
例えば、以下のコードで、keyのグループの先頭2行ずつを見ることができます。
df2 %>% do(head(.,2))
# A tibble: 12 x 7
# Groups:   key [6]
   cut     color clarity price key   value ScaledValue
   <ord>   <ord> <ord>   <int> <chr> <dbl>       <dbl>
 1 Ideal   E     SI2       326 carat  0.23     0.00624
 2 Premium E     SI1       326 carat  0.21     0.00208
 3 Ideal   E     SI2       326 depth 61.5      0.514
 4 Premium E     SI1       326 depth 59.8      0.467
 5 Ideal   E     SI2       326 table 55        0.231
 6 Premium E     SI1       326 table 61        0.346
 7 Ideal   E     SI2       326 x      3.95     0.368
 8 Premium E     SI1       326 x      3.89     0.362
 9 Ideal   E     SI2       326 y      3.98     0.0676
10 Premium E     SI1       326 y      3.84     0.0652
11 Ideal   E     SI2       326 z      2.43     0.0764
12 Premium E     SI1       326 z      2.31     0.0726
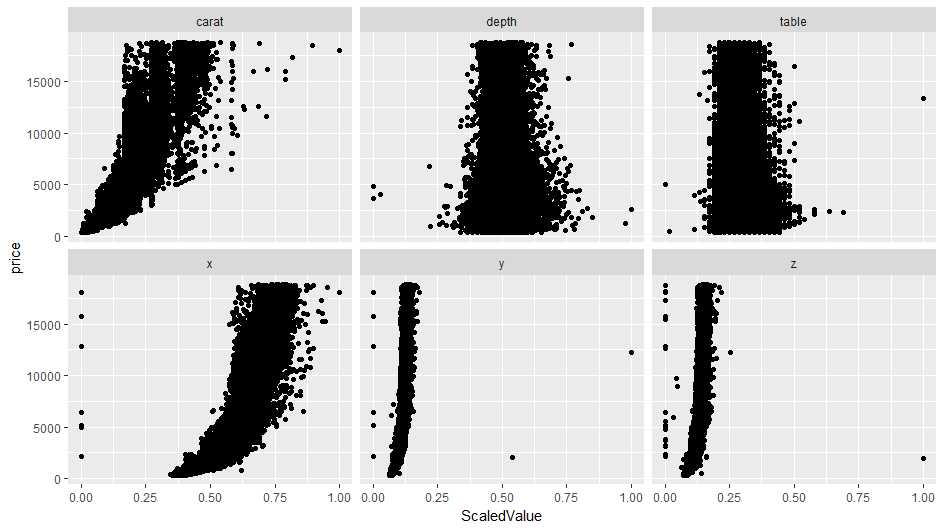
ggplot(df2)+
  geom_point(aes(x=ScaledValue,y=price))+
  facet_wrap(~key)
目的変数を正規化することで、それぞれの説明変数と目的変数の関係が見やすくなりました。

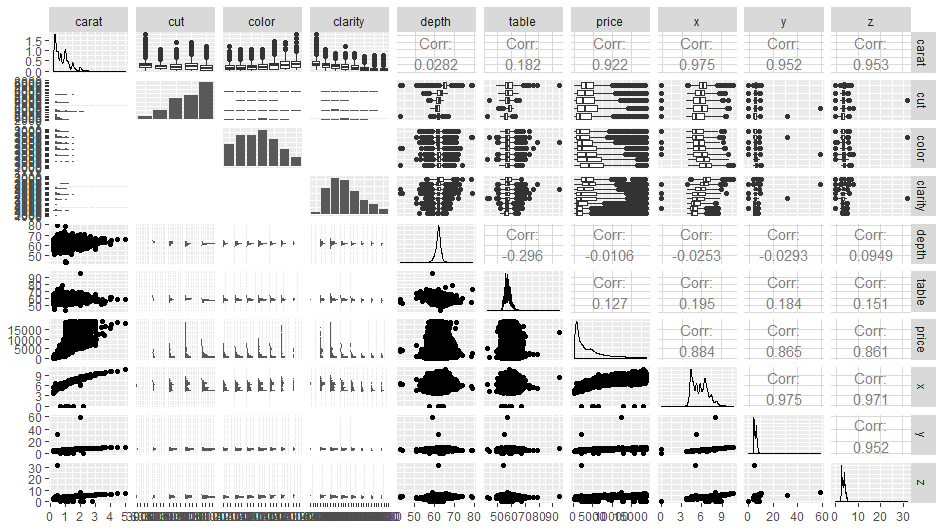
ちなみに、ggpairs()を今回のデータセットに用いると、以下のような出力が得られます。
library(GGally)
ggpairs(df)

