熱狂的なHadley Wickhamファンな私ですが、最近、Hadleyのあゆみについていけていない感があります。
**{purrr}だの、{multidplyr}**だの次々と新しいパッケージが登場したり、やっとの事で1.0.0メジャーバージョンになった **{ggplot2}**の次期マイナーバージョンである1.1.0の開発がGitHubで始まったりと、ちょっと待ってくれよ、と戸惑いを感じる今日この頃です。というわけで新しい(わけでもないけど)関数の使い方を覚えようという心構えです。
今日はみんな大好き **{dplyr}から、便利なdo()関数の使い方を紹介します。do()関数は、はじめは意味がわからなすぎて辛いですが、{ggplot2}**のように使い方がわかれば大変便利な関数です。
まずは必要なパッケージを読み込みます。{dplyr}が今回の主ですが、後半に{broom}、**{ggplot2}を利用した応用例を紹介します。{knitr}**は記事を書くために利用しているパッケージなので、特に必要ではありません。
私が使用している**{dplyr}**のバージョンは0.4.3.9000ですが、do()関数はCRANに上がっている0.4.3でもあります(0.2くらいから?)。
library(dplyr)
library(broom)
library(ggplot2)
# library(knitr)
do()関数の機能をざっくり説明すると、データフレームに対して任意の関数を適用するというものです。特にいくつかのグループがあるようなデータに対して強力な機能を持っています。
何はともあれ関数の働きを見てみましょう。
 do()の基本動作
iris %>% do(head(., 2)) # head(iris, 2) と同じ働き
##   Sepal.Length Sepal.Width Petal.Length Petal.Width Species
## 1          5.1         3.5          1.4         0.2  setosa
## 2          4.9         3.0          1.4         0.2  setosa
iris %>% group_by(Species) %>% do(head(., 2))
## Source: local data frame [6 x 5]
## Groups: Species [3]
##
##   Sepal.Length Sepal.Width Petal.Length Petal.Width    Species
##          (dbl)       (dbl)        (dbl)       (dbl)     (fctr)
## 1          5.1         3.5          1.4         0.2     setosa
## 2          4.9         3.0          1.4         0.2     setosa
## 3          7.0         3.2          4.7         1.4 versicolor
## 4          6.4         3.2          4.5         1.5 versicolor
## 5          6.3         3.3          6.0         2.5  virginica
## 6          5.8         2.7          5.1         1.9  virginica
# Speciesごとにグループ化されているので、Speciesの各水準に対してhead()を実行する
do()関数を使いこなすには、グループ化の概念とdo()関数で処理した後の値の扱いについて承知していることが重要です。先の例では、irisデータセットの3つの水準(品種名)を持つSpecies変数をgroup_by()関数によりグループ化し、水準ごとにdo()関数ないで記述したhead()関数を動作させたということになります。
levels(iris$Species)
## [1] "setosa" "versicolor" "virginica"
# irisのSpeciesは3つの水準を持つ
最初の例ではグループ化せずにirisオブジェクトをそのままdo(head())に渡したため、グループ化はされずに単にhead(iris)とした時と同じ結果が返ってきました。また次の例のように一度グループ化してもungroup()関数でグループを解除した場合もhead(iris)と同じ値を返します。
iris %>% group_by(Species) %>% ungroup() %>% do(head(., 2))
## Source: local data frame [2 x 5]
##
##   Sepal.Length Sepal.Width Petal.Length Petal.Width Species
##          (dbl)       (dbl)        (dbl)       (dbl)  (fctr)
## 1          5.1         3.5          1.4         0.2  setosa
## 2          4.9         3.0          1.4         0.2  setosa
# ungroup()しておくと、グループ化が解除され、head(iris, 2)と同じになる
水準ごとの処理に便利
もう少し詳しく見ていきましょう。水準ごとに同じ関数を実行するという、次のような例はみなさんやったことがあるかと思います。
iris %$% lm(Petal.Length ~ Sepal.Length, data = ., subset = Species == .$Species[1])
iris %$% lm(Petal.Length ~ Sepal.Length, data = ., subset = Species == .$Species[2])
iris %$% lm(Petal.Length ~ Sepal.Length, data = ., subset = Species == .$Species[3])
こんな風にするのは面倒臭い。特に要因がたくさんあると辛いです。そんな時doするか...
iris_lm <- iris %>% group_by(Species) %>%
  do(
    lm.res = lm(Petal.Length ~ Sepal.Length,
                data = .))
do()関数の強みはグループごとに関数を処理することでしたので、このようにすると個々にlm()関数を実行する場合と比べて楽です。
今の結果はiris_lmというオブジェクトに代入してあります。そのオブジェクトを見てみると
iris_lm
## Source: local data frame [3 x 2]
## Groups: <by row>
##
##      Species  lm.res
##       (fctr)  (list)
## 1     setosa <S3:lm>
## 2 versicolor <S3:lm>
## 3  virginica <S3:lm>
見慣れない形式の値が返ってきました。しかしその実態は
iris_lm %>% {
  class(.) %>% print()
  names(.)
}
## [1] "rowwise_df" "tbl_df"     "data.frame"

## [1] "Species" "lm.res"
行ごとに処理する段階(rowwise()状態)にあるただのデータフレームです。データフレーム内ではグループ化の基準となるSpeciesと、Speciesの各水準に対してlm()を実行した結果をlm.resという変数で保存しています。
do()で処理した帰り値はデータフレームオブジェクトである。このことをしっかりと覚えておきましょう。関数の返り値をデータフレームオブジェクトにするには、data.frame()を使うか、**{dplyr}**のsummarise()などのデータフレームオブジェクトとして渡すか、といったことが考えられます。
今回のようにデータフレームオブジェクトに対応しない関数をdo()に渡すには、別途、変数名を与えてやる必要があります。次は失敗例です。
# data.frameにするための変数名を与える必要がある。
iris_lm <- iris %>% group_by(Species) %>%
  do(lm(Petal.Length ~ Sepal.Length, data = .))

Error: Results are not data frames at positions: 1, 2, 3
iris %>% group_by(Species) %>% do(cor(.$Sepal.Length, .$Petal.Length) %>% data.frame())
## Source: local data frame [3 x 2]
## Groups: Species [3]
##
##      Species         .
##       (fctr)     (dbl)
## 1     setosa 0.2671758
## 2 versicolor 0.7540490
## 3  virginica 0.8642247
# cor()の返り値をdata.frame()で処理する
また、do()の中では複数の関数を実行することができます。
iris %>% group_by(Species) %>%
  do(data.frame(Length.max = max(.$Sepal.Length),
                Length.min = min(.$Sepal.Length)))
## Source: local data frame [3 x 3]
## Groups: Species [3]
##
##      Species Length.max Length.min
##       (fctr)      (dbl)      (dbl)
## 1     setosa        5.8        4.3
## 2 versicolor        7.0        4.9
## 3  virginica        7.9        4.9
do()関数で処理した後の値の取り出し
do()関数で任意の関数を実行した後、それぞれの水準が持つ値をみたいということがあります。話を単純にするためまずはグループ化していない(水準を考慮しない)関数の処理とその値の参照方法を見てみましょう。
iris_lm_all <- iris %>% lm(Petal.Length ~ Sepal.Length, data = .)

iris_lm_all %>% {
  class(.) %>% print()
  names(.) %>% print()
  summary(.) %>% names() %>% print()
  coef(.) %>% names() %>% print()
}
## [1] "lm"
##  [1] "coefficients"  "residuals"     "effects"       "rank"
##  [5] "fitted.values" "assign"        "qr"            "df.residual"
##  [9] "xlevels"       "call"          "terms"         "model"
##  [1] "call"          "terms"         "residuals"     "coefficients"
##  [5] "aliased"       "sigma"         "df"            "r.squared"
##  [9] "adj.r.squared" "fstatistic"    "cov.unscaled"
## [1] "(Intercept)"  "Sepal.Length"
上記のような関数を実行して、その変数にアクセスするというのが通常の手段になります。do()関数でもそのようにして各水準ごとに求められた値を参照します。
単回帰を行った際の決定係数を参照するにはsummary()$r.squaredですので、水準ごとに求めた決定係数を参照するには、同様に
iris_lm %>% summarise(r2 = summary(lm.res)$r.squared)
とします。どの行がどの水準を表しているかがわかった方が良いので、
iris_lm %>% summarise(Species = Species,
                      r2 = summary(lm.res)$r.squared)
## Source: local data frame [3 x 2]
##
##      Species         r2
##       (fctr)      (dbl)
## 1     setosa 0.07138289
## 2 versicolor 0.56858983
## 3  virginica 0.74688439
としておくと便利でしょう。
次は単回帰の最小二乗法によって求められたパラメーターを取り出してみたいと思います。
coef(iris_lm_all)
##  (Intercept) Sepal.Length
##    -7.101443     1.858433
  # 係数は`coef()`によって求められる
iris_lm %>% do(
  data.frame(Species   = .$Species,
             intercept = coef(.$lm.res)[1],
             slope     = coef(.$lm.res)[2]))
## Source: local data frame [3 x 3]
## Groups: <by row>
##
##      Species intercept     slope
##       (fctr)     (dbl)     (dbl)
## 1     setosa 0.8030518 0.1316317
## 2 versicolor 0.1851155 0.6864698
## 3  virginica 0.6104680 0.7500808
グループ化がもたらす副作用に注意
少し脇道にそれますが、一度グループ化したデータフレームオブジェクトのグループは別の関数に値を渡した際も引き継がれます。group_by()しておいて、うっかりそのまま集計用の関数を適用したりすると思わぬ結果を導くことがあるので、適宜ungroup()関数でグループを解除するのを忘れないようにしましょう。
 **
**{broom}**との組み合わせ
これまで見てきたように、do()関数は回帰モデルなどの関数と相性が良いので、**{broom}**パッケージと組み合わせて使うとさらに便利です。
このあたりのことは**{broom}**パッケージのvignettesに詳しい解説がありますので、ここでは紹介するに留めさせていただきます。
iris %>% group_by(Species) %>%
  do(cor.test(.$Sepal.Length, .$Petal.Length) %>% tidy()) %>%
  kable()
| Species | estimate | statistic | p.value | parameter | conf.low | conf.high |
|---|---|---|---|---|---|---|
| setosa | 0.2671758 | 1.920876 | 0.0606978 | 48 | -0.0120695 | 0.5077623 |
| versicolor | 0.7540490 | 7.953806 | 0.0000000 | 48 | 0.6020680 | 0.8532995 |
| virginica | 0.8642247 | 11.901120 | 0.0000000 | 48 | 0.7714542 | 0.9210172 |
iris_lm %>% tidy(lm.res)
iris_lm %>% augment(lm.res)
iris_lm %>% glance(lm.res)
 **
**{ggplot2}**と組み合わせる
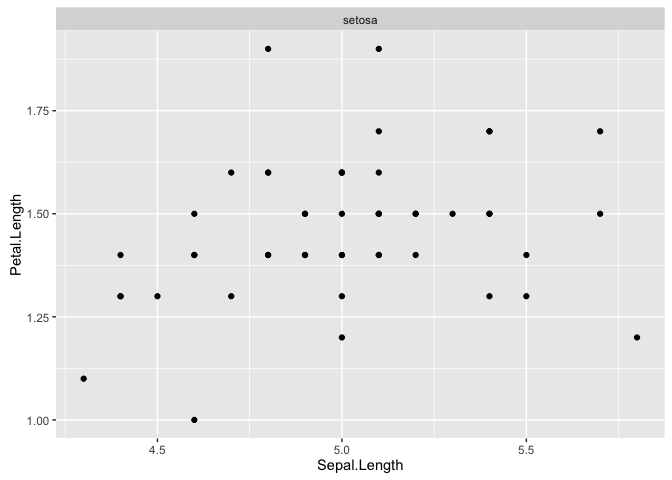
水準ごとに図を描きたい... これもdo()関数を使えば簡単にできます。海外にも同様の願望を持った人がいました。
このページで挙げられている質問とそれに対する一つの解答例でdo()関数を使って水準ごとにggplot2の図を描いてみます。
p <- iris %>% ggplot(aes(Sepal.Length, Petal.Length)) + geom_point()
  # 元となるggplotオブジェクトを作る
iris_sp_plots <- iris %>% group_by(Species) %>%
  do(plots = p %+% . + facet_wrap(~Species))
  # Speciesの水準ごとに図を描く
出力は次のようにします。
iris_sp_plots$plots[1]
便利ですね。
Enjoy!
