ggplotで作成した複数のグラフを1つの画像にまとめて出力します。
色々と複数の図をまとめるパッケージがあるみたいですが、今回はgridExtraパッケージを使います。興味のある方は参考ページを見てください。
まず、各グラフを作成します。作成の仕方はRのデータ可視化パッケージggplotの基本を参考にして下さい。
# パッケージの読み込み
library(ggplot2)
library(gridExtra)
# 各グラフの作成
df <- diamonds       #データはdiamondsを使います。
p1 <-
  ggplot(df,aes(x=carat,y=price))+
  geom_point()
p2 <-
ggplot(df,aes(x=cut,y=price))+
  geom_boxplot()
p3 <-
ggplot(df,aes(x=price))+
  geom_histogram()
p4 <-
ggplot(df,aes(x=price, y = ..density..,fill=cut))+
  geom_histogram(position = "fill",alpha=0.3,color="black")
次に、まとめるグラフのレイアウトを指定します。
grid.arrange()関数のlayout_matrix引数にマトリクス形式で指定します。
layout <- rbind(c(1,1,1),c(2,3,4))
上記のように指定すると、以下のような出力になります。
1,2,3,4がそれぞれp1,p2,p3,p4が占める領域を表しています。
>layout
     [,1] [,2] [,3]
[1,]    1    1    1
[2,]    2    3    4
グラフを確認すると、
gridExtra::grid.arrange(p1,p2,p3,p4,layout_matrix=layout)
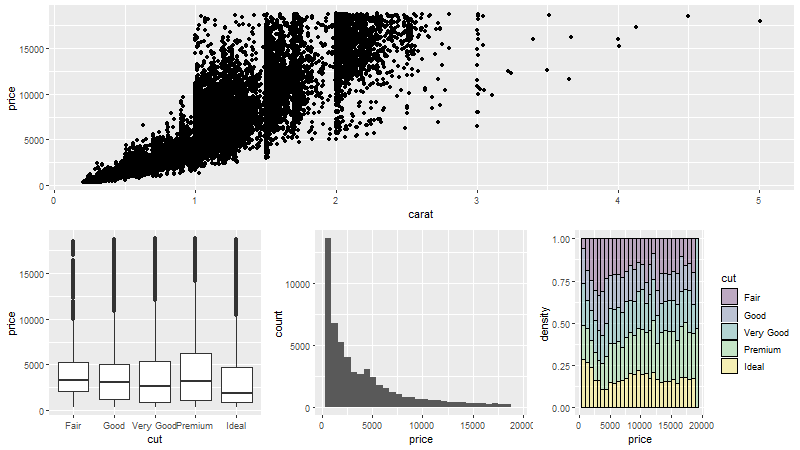
のように指定したレイアウト通りの図が出力されます。
ちなみに、png形式で出力するには、
png("multiplot.png", height=450, width=800, res=72)
gridExtra::grid.arrange(p1,p2,p3,p4,layout_matrix=layout)
dev.off()
とします。
参考サイト
ggplot2 ライブラリで作った複数のグラフを1枚にまとめるには、gridExtra ライブラリが使える
ggplot2で複数のプロットをまとめて表示する方法あれこれ