今回はtidyではないデータをtidyなデータに変形することで、より簡単にggplotでデータを可視化する方法について書きたいと思います。
tidyなデータとは何ぞやという方、参考にあげているページをご覧ください(なげやりですみません。。)。
まず、tidyではないデータとして、以下のデータフレームを用意します。
tibbleはRのデータフレームオブジェクトを拡張させたオブジェクトで多くのメリットを持ちます。
library(tidyverse)
# 今回使用するtibble,tidyr,dplyr,stringr,ggplotパッケージはtidyverseパッケージに内包されています。

tb1 <- tibble(Place=c("Hiroshima","Osaka","Tokyo"),
  "2018-08-01 temperature" = c(30,33,28),
  "2018-10-01 temperature" = c(26,22,24),
  "2018-12-01 temperature" = c(15,16,13),
  "2018-08-01 humidity"=c(80,85,90),
  "2018-10-01 humidity"=c(55,70,67),
  "2018-12-01 humidity"=c(70,75,80)
)
> tb1
# A tibble: 3 x 7
  Place     `2018-08-01 temperature` `2018-10-01 temperature` `2018-12-01 temperature` `2018-08-01 humidity` `2018-10-01 humidity` `2018-12-01 humidity`
  <chr>                        <dbl>                    <dbl>                    <dbl>                 <dbl>                 <dbl>                 <dbl>
1 Hiroshima                       30                       26                       15                    80                    55                    70
2 Osaka                           33                       22                       16                    85                    70                    75
3 Tokyo                           28                       24                       13                    90                    67                    80
これらのPlaceを除く列には2つの情報が含まれています。
1つは、日付のデータ、2つ目はtemperature,humidityというデータの種類です。
こういった形式のデータはtidyなデータとは言いません。そこで、まずこれらのデータをtidyな形式に直します。この際、データを成型するためのパッケージであるtidyr,dplyr,文字列を扱うためのパッケージであるstringrパッケージを利用します。
gatherによってPlace以外の列を縦長のデータフレームに変形する ※"-"をつかって縦長にしない列名を指定する場合。
tb2 <-
  tb1 %>% gather(key = "KEY",value = "VALUE",-Place)
> tb2
# A tibble: 18 x 3
   Place     KEY                    VALUE
   <chr>     <chr>                  <dbl>
 1 Hiroshima 2018-08-01 temperature    30
 2 Osaka     2018-08-01 temperature    33
 3 Tokyo     2018-08-01 temperature    28
 4 Hiroshima 2018-10-01 temperature    26
 5 Osaka     2018-10-01 temperature    22
 6 Tokyo     2018-10-01 temperature    24
 7 Hiroshima 2018-12-01 temperature    15
 8 Osaka     2018-12-01 temperature    16
 9 Tokyo     2018-12-01 temperature    13
10 Hiroshima 2018-08-01 humidity       80
11 Osaka     2018-08-01 humidity       85
12 Tokyo     2018-08-01 humidity       90
13 Hiroshima 2018-10-01 humidity       55
14 Osaka     2018-10-01 humidity       70
15 Tokyo     2018-10-01 humidity       67
16 Hiroshima 2018-12-01 humidity       70
17 Osaka     2018-12-01 humidity       75
18 Tokyo     2018-12-01 humidity       80
tb2<-
  tb1 %>% gather(key = "KEY",value = "VALUE",
               c(`2018-08-01 temperature`,`2018-10-01 temperature`,`2018-12-01 temperature`,`2018-08-01 humidity`,`2018-10-01 humidity`,`2018-12-01 humidity`)))
上記のコードのように、縦長にする列を明示的に示すコードでも同じ結果が得られる。
> tb2
# A tibble: 18 x 3
   Place     KEY                    VALUE
   <chr>     <chr>                  <dbl>
 1 Hiroshima 2018-08-01 temperature    30
 2 Osaka     2018-08-01 temperature    33
 3 Tokyo     2018-08-01 temperature    28
 4 Hiroshima 2018-10-01 temperature    26
 5 Osaka     2018-10-01 temperature    22
 6 Tokyo     2018-10-01 temperature    24
 7 Hiroshima 2018-12-01 temperature    15
 8 Osaka     2018-12-01 temperature    16
 9 Tokyo     2018-12-01 temperature    13
10 Hiroshima 2018-08-01 humidity       80
11 Osaka     2018-08-01 humidity       85
12 Tokyo     2018-08-01 humidity       90
13 Hiroshima 2018-10-01 humidity       55
14 Osaka     2018-10-01 humidity       70
15 Tokyo     2018-10-01 humidity       67
16 Hiroshima 2018-12-01 humidity       70
17 Osaka     2018-12-01 humidity       75
18 Tokyo     2018-12-01 humidity       80
KEY列には日付データとデータの種類を表すデータ(temperature,humidity)が含まれているので、それぞれ別々の列にする。
tb2 <-
  tb2 %>%
  mutate(Date=KEY %>% str_sub(1,10)) %>% #KEY列の1文字目から10文字絵までを抽出し、Dateに書き込む
  mutate(Data=if_else(condition = KEY %>% str_detect("temperature"),true = "temperature",false ="NO" )) %>%
  #↑KEY列に"temperature"が含まれればData列に"temperature"を書き込む。"temperature"をふくまなければとりあえず"NO"を書き込む
  mutate(Data=if_else(condition = KEY %>% str_detect("humidity"),true = "humidity",false = Data)) %>%
  #↑KEY列に"humidity"が含まれればData列に"humidity"を書き込む。"humidity"をふくまなければ元のData列の値を書き込む(今回は"temperature"のはず)
  select(-KEY)#KEY列を削除
> tb2
# A tibble: 18 x 4
   Place     VALUE Date       Data
   <chr>     <dbl> <chr>      <chr>
 1 Hiroshima    30 2018-08-01 temperature
 2 Osaka        33 2018-08-01 temperature
 3 Tokyo        28 2018-08-01 temperature
 4 Hiroshima    26 2018-10-01 temperature
 5 Osaka        22 2018-10-01 temperature
 6 Tokyo        24 2018-10-01 temperature
 7 Hiroshima    15 2018-12-01 temperature
 8 Osaka        16 2018-12-01 temperature
 9 Tokyo        13 2018-12-01 temperature
10 Hiroshima    80 2018-08-01 humidity
11 Osaka        85 2018-08-01 humidity
12 Tokyo        90 2018-08-01 humidity
13 Hiroshima    55 2018-10-01 humidity
14 Osaka        70 2018-10-01 humidity
15 Tokyo        67 2018-10-01 humidity
16 Hiroshima    70 2018-12-01 humidity
17 Osaka        75 2018-12-01 humidity
18 Tokyo        80 2018-12-01 humidity
これで日付データDateとデータの種類Dataを別の列に変換できました。しかし、これではまだtidyなデータとはいえません。
ここで、さらにspread()関数によって"temperature"と"humidity"を別の列に変形します。
tb3 <-
  tb2 %>% spread(key = Data,value=VALUE)
> tb3
# A tibble: 9 x 4
  Place     Date       humidity temperature
  <chr>     <chr>         <dbl>       <dbl>
1 Hiroshima 2018-08-01       80          30
2 Hiroshima 2018-10-01       55          26
3 Hiroshima 2018-12-01       70          15
4 Osaka     2018-08-01       85          33
5 Osaka     2018-10-01       70          22
6 Osaka     2018-12-01       75          16
7 Tokyo     2018-08-01       90          28
8 Tokyo     2018-10-01       67          24
9 Tokyo     2018-12-01       80          13
これがtidyなデータ形式です。
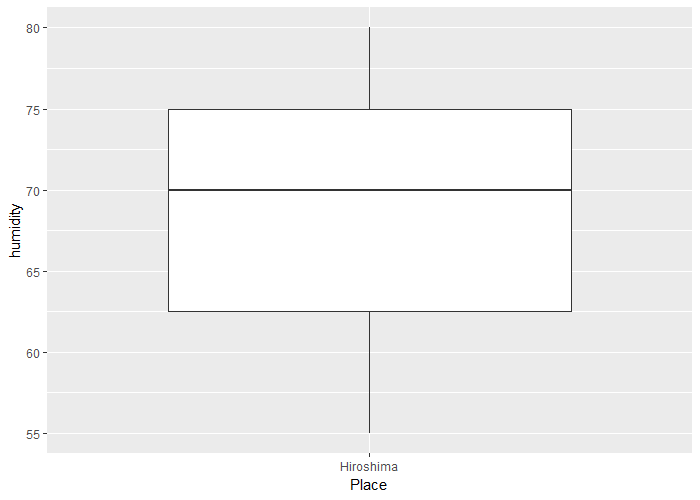
この形式にしておくと、filter()関数で日付や場所によってデータをフィルタリングできます。
ggplot(tb3 %>% filter(Place=="Hiroshima"),aes(x=Place,y=humidity))+geom_boxplot()
[参考]
tidyなデータ関連
Nisshi's Notebook
R for Data Science: 12 Tidy data
tidyr
tibble関連
ある日tidyと一緒に: tidyverseは厳しいがとても優しい
stringrパッケージ関連
R for Data Science: 14 Strings
heavywatal:stringr — Rの文字列をまともな方法で処理する
dplyrパッケージ関連
heavywatal:dplyr — 高速data.frame処理
tidyrパッケージ関連
heavywatal:tidyr — シンプルなデータ変形ツール
tidyverse
tidyverse