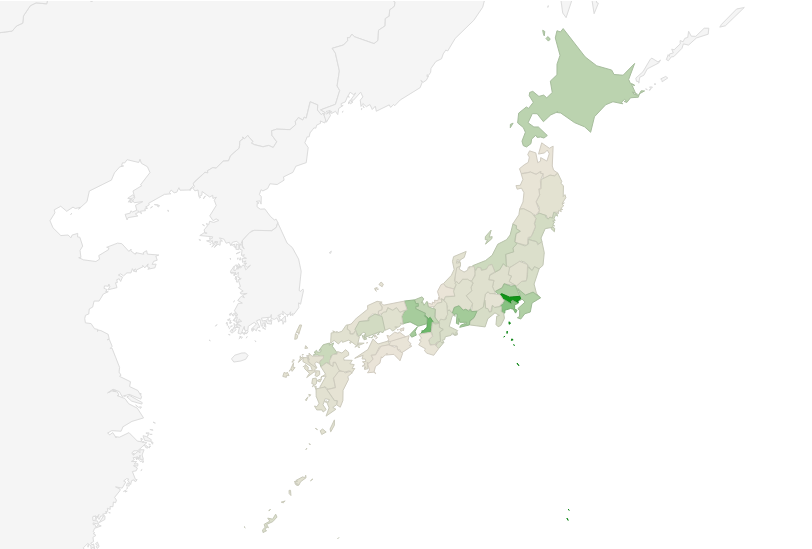
GoogleChart便利ですね。
下記のような分布マップを簡単に作成できます。
<script src="https://www.google.com/jsapi"></script>
<script>
google.load('visualization', '1', {packages:['geochart']});
google.setOnLoadCallback(graphChart);

function graphChart() {
  var data = google.visualization.arrayToDataTable([
    ["都道府県", "データ"],
    ["北海道", 20],
    ["青森", 3],
    ...
  ]);

  var option = {
    region: 'JP',
    resolution: 'provinces'
  };

  var chart = new google.visualization.GeoChart(document.getElementById('chart'));
  chart.draw(data, option);
}
</script>

<div id="chart"></div>
都道府県のデータを入れてるところで適切にデータを入れれば簡単に分布マップを作成してくれます。
「青森県」じゃなくて「青森」にしないとうまく動作しないので要注意です。
