先日Plotly.jsに入門したんですが、ただグラフを描くだけならJavaScriptのライブラリを使う必要はないわけで、やっぱりEvent Handler使って動的にグラフを変化させてナンボだろうという事でEvent Handler関係のサンプルコードを勉強したまとめです
入門編の記事は以下です
https://qiita.com/studio_haneya/items/b689b4c27acbd12a888d
やり方
以下の2つのやり方があるようです
1. Plotly.jsのEventHandlerを使う
2. updatemenusに動作を指定する
1. Plotly.jsのEventHandlerを使う
Ploly.jsイベントを受け取って関数を実行するよく見るやり方です
Plotly.js公式のEvent Referenceのページに使用例がいろいろ載ってます
https://plotly.com/javascript/plotlyjs-events/
1-1. 基本の使い方
Plotly.jsグラフの書き出し先になっている要素のon()メソッドにPlotly.jsイベントを指定してやればPlotly.jsグラフ上で起こったイベントに対応して関数を実行してくれます
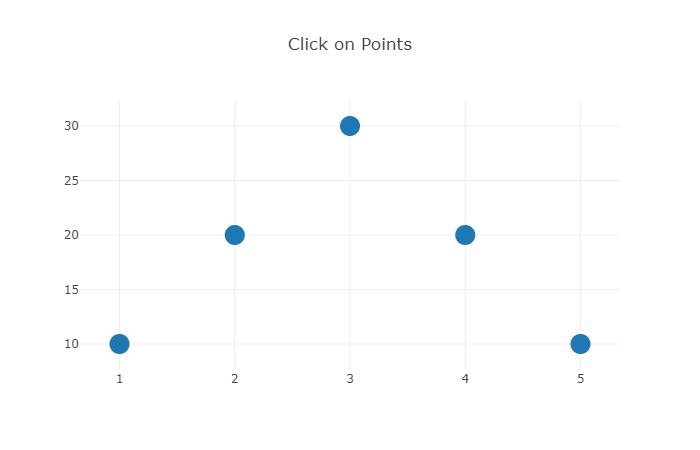
以下の場合は'plotly_click'でalert()を呼ぶように指定しています
<head>
  <script src="https://cdn.plot.ly/plotly-latest.min.js"></script>
</head>

<body>
  <div id="myDiv"><!-- Plotly chart will be drawn here --></div>
  <script>
    var myPlot = document.getElementById('myDiv'),
    x = [1, 2, 3, 4, 5],
    y = [10, 20, 30, 20, 10],
    data = [{x:x, y:y, type:'scatter',
             mode:'markers', marker:{size:20}
            }],
    layout = {hovermode:'closest',
              title:'Click on Points'
     };

    Plotly.newPlot('myDiv', data, layout);

    myPlot.on('plotly_click', function(){
        alert('You clicked this Plotly chart!');
    });
  </script>
</body>
1-2. グラフの表示を変える
既に表示しているグラフの表示内容を変更するには以下の2つのやり方があるようです
1. Plotly.restyle()に変更内容を与える
2. Plotly.newPlot()で上書きする
以下はクリックしたときにrestyle()を実行して色を変え、ダブルクリックしたときにrestyle()で元の色に戻す例です
<head>
  <script src="https://cdn.plot.ly/plotly-latest.min.js"></script>
  <script src="https://d3js.org/d3.v6.min.js"></script>
</head>

<body>
  <div id="myDiv"><!-- Plotly chart will be drawn here --></div>
  <script>
    var myPlot = document.getElementById('myDiv'),
      x = [1, 2, 3, 4, 5, 6],
      y = [1, 2, 3, 2, 3, 4],
      colors = ['#00000','#00000','#00000',
                '#00000','#00000','#00000'],
      data = [{x:x, y:y, type:'scatter',
              mode:'markers', marker:{size:16, color:colors}}],
      layout = {
          hovermode:'closest',
          title:'Click on a Point to Change Color<br>Double Click (anywhere) to Change it Back'
      };

    Plotly.newPlot('myDiv', data, layout);

    myPlot.on('plotly_click', function(data){
      var pn='',
          tn='',
          colors=[];
      for(var i=0; i < data.points.length; i++){
        pn = data.points[i].pointNumber;
        tn = data.points[i].curveNumber;
        colors = data.points[i].data.marker.color;
      };
      colors[pn] = '#C54C82';

      var update = {'marker':{color: colors, size:16}};
      Plotly.restyle('myDiv', update, [tn]);
    });

    myPlot.on('plotly_doubleclick', function(data){
      console.log('double click');
      var orgColors = ['#00000','#00000','#00000',
                      '#00000','#00000','#00000'];
      var update = {'marker':{color: orgColors, size:16}};
      Plotly.restyle('myDiv', update);
    });

  </script>
</body>
1-3. イベントいろいろ
myPlot.on('plotly_click', function(){})
myPlot.on('plotly_doubleclick', function(){})
myPlot.on('plotly_legendclick', function(){})
myPlot.on('plotly_hover', function(){})
myPlot.on('plotly_unhover', function(){})
myPlot.on('plotly_selected', function(){})
myPlot.on('plotly_afterplot', function(){})
myPlot.on('plotly_legendclick', function(){})
myPlot.on('plotly_legendclick', function(){})
1-4. 作例いろいろ
1-4-1. 凡例クリックを利用した例
点をクリックしたら色が付き、凡例をクリックすると元に戻る例です
<head>
  <script src="https://cdn.plot.ly/plotly-latest.min.js"></script>
</head>

<body>
  <div id="myDiv"><!-- Plotly chart will be drawn here --></div>
  <script>
    var myPlot = document.getElementById('myDiv'),
      x = [1, 2, 3, 4, 5, 6],
      y = [1, 2, 3, 2, 3, 4],
      y2 = [1, 4, 7, 6, 1, 5],
      colors = [['#5C636E','#5C636E','#5C636E','#5C636E','#5C636E','#5C636E'],
                ['#393e46','#393e46','#393e46','#393e46','#393e46','#393e46']],
      data = [{x:x, y:y, type:'scatter',
              mode:'line', line:{ color:'#5C636E'},marker:{size:16, color:colors[0]}},
              {x:x, y:y2, type:'scatter',
              mode:'line',line:{ color:'#393e46'}, marker:{size:16, color:colors[1]}}],
      layout = {
          showlegend: true,
          hovermode:'closest',
          title:'Click on a Point to Change Color<br>Click on a Trace in the Legend to Change Back One Trace Only'
      };

    Plotly.newPlot('myDiv', data, layout);

    myPlot.on('plotly_click', function(data){
      var pn='',
          tn='',
          colors=[];
      for(var i=0; i < data.points.length; i++){
        pn = data.points[i].pointNumber;
        tn = data.points[i].curveNumber;
        colors = data.points[i].data.marker.color;
      };
      colors[pn] = '#C54C82';
      var update = {'marker':{color: colors, size:16}};
      Plotly.restyle('myDiv', update,[tn]);
    });

    myPlot.on('plotly_legendclick', function(data){
      var trColors = [['#5C636E','#5C636E','#5C636E','#5C636E','#5C636E','#5C636E'],
                  ['#393e46','#393e46','#393e46','#393e46','#393e46','#393e46']];
      var update = {'marker':{color: trColors[data.curveNumber], size:16}};
      Plotly.restyle('myDiv', update,[data.curveNumber]);
      return false;
    });
  </script>
</body>
1-4-2. hoverで色を変える例
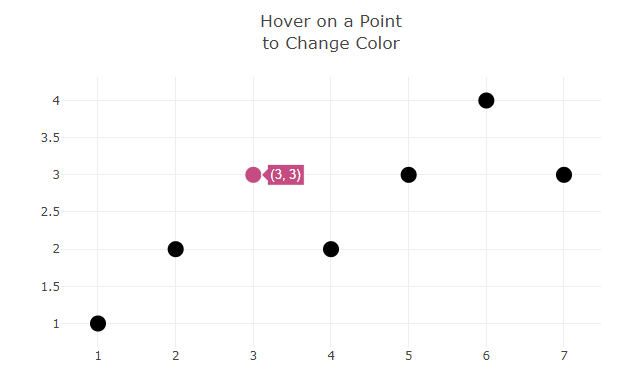
hoverで色を変え、hoverが外れると色が戻る例です
<head>
  <script src="https://cdn.plot.ly/plotly-latest.min.js"></script>
</head>

<body>
  <div id="myDiv"><!-- Plotly chart will be drawn here --></div>
  <script>
    var myPlot = document.getElementById('myDiv'),
      x = [1, 2, 3, 4, 5, 6, 7],
      y = [1, 2, 3, 2, 3, 4, 3],
      colors =['#00000','#00000','#00000',
              '#00000','#00000','#00000',
              '#00000'],
      data = [{x:x, y:y,
              type:'scatter',
              mode:'markers', marker:{size:16, color:colors}}],
      layout = {
          hovermode:'closest',
          title:'Hover on a Point<br>to Change Color'
      };

    Plotly.newPlot('myDiv', data, layout);

    myPlot.on('plotly_hover', function(data){
      var pn='',
          tn='',
          colors=[];
      for(var i=0; i < data.points.length; i++){
        pn = data.points[i].pointNumber;
        tn = data.points[i].curveNumber;
        colors = data.points[i].data.marker.color;
      };
      colors[pn] = '#C54C82';

      var update = {'marker':{color: colors, size:16}};
      Plotly.restyle('myDiv', update, [tn]);
    });

    myPlot.on('plotly_unhover', function(data){
      var pn='',
          tn='',
          colors=[];
      for(var i=0; i < data.points.length; i++){
        pn = data.points[i].pointNumber;
        tn = data.points[i].curveNumber;
        colors = data.points[i].data.marker.color;
      };
      colors[pn] = '#00000';

      var update = {'marker':{color: colors, size:16}};
      Plotly.restyle('myDiv', update, [tn]);
    });

  </script>
</body>
1-4-3. 選択範囲のヒストグラムを描く例
plotly_selectedイベントを取得して選択されたデータのみを対象にヒストグラムを描きます
<head>
  <script src="https://cdn.plot.ly/plotly-latest.min.js"></script>
</head>

<body>
  <div id="myDiv"><!-- Plotly chart will be drawn here --></div>
  <script>
    var graphDiv = document.getElementById('myDiv');
    var N = 1000;
    var color1 = '#7b3294';
    var color1Light = '#c2a5cf';
    var colorX = '#ffa7b5';
    var colorY = '#fdae61';

    function randomArray() {
      var out = new Array(N);
      for(var i = 0; i < N; i++) {
        out[i] = Math.random();
      }
      return out;
    }
    var x = randomArray();
    var y = randomArray();

    Plotly.newPlot(graphDiv, [{
      type: 'scatter',
      mode: 'markers',
      x: x,
      y: y,
      xaxis: 'x',
      yaxis: 'y',
      name: 'random data',
      marker: {color: color1, size: 10}
    }, {
      type: 'histogram',
      x: x,
      xaxis: 'x2',
      yaxis: 'y2',
      name: 'x coord dist.',
      marker: {color: colorX}
    }, {
      type: 'histogram',
      x: y,
      xaxis: 'x3',
      yaxis: 'y3',
      name: 'y coord dist.',
      marker: {color: colorY}
    }], {
      title: 'Lasso around the scatter points to see sub-distributions',
      dragmode: 'lasso',
      xaxis: {
        zeroline: false,
      },
      yaxis: {
        domain: [0.55, 1],
      },
      xaxis2: {
        domain: [0, 0.45],
        anchor: 'y2',
      },
      yaxis2: {
        domain: [0, 0.45],
        anchor: 'x2'
      },
      xaxis3: {
        domain: [0.55, 1],
        anchor: 'y3'
      },
      yaxis3: {
        domain: [0, 0.45],
        anchor: 'x3'
      }
    });

    graphDiv.on('plotly_selected', function(eventData) {
      var x = [];
      var y = [];

      var colors = [];
      for(var i = 0; i < N; i++) colors.push(color1Light);

      eventData.points.forEach(function(pt) {
        x.push(pt.x);
        y.push(pt.y);
        colors[pt.pointNumber] = color1;
      });

      Plotly.restyle(graphDiv, {
        x: [x, y],
        xbins: {}
      }, [1, 2]);

      Plotly.restyle(graphDiv, 'marker.color', [colors], [0]);
    });

  </script>
</body>
1-4-4. グラフの表示完了イベントを使う例
グラフを表示完了時にconsole.log()する例です
<head>
  <script src="https://cdn.plot.ly/plotly-latest.min.js"></script>
  <script src="https://d3js.org/d3.v6.min.js"></script>
</head>

<body>
  <div id="myDiv"><!-- Plotly chart will be drawn here --></div>
  <script>
    var myPlot = document.getElementById('myDiv'),
      N = 20,
      x = [1, 2, 3, 4, 5, 6, 7],
      y = [1, 2, 3, 2, 3, 4, 3],
      data = [{x:x, y:y, type:'scatter',
              mode:'markers', marker:{size:14}}
            ];

    Plotly.newPlot('myDiv', data);

    myPlot.on('plotly_afterplot', function(){
        console.log('done plotting');
    });

  </script>
</body>
2. updatemenusに動作を指定する
Plotly.newPlot()に渡すlayoutにupdatemenus要素を設定しておくことで、ボタンやドロップダウンを配置してグラフの表示情報やスタイルを変更する事が出来ます
詳しくはAPIリファレンスを参照してください
https://plotly.com/javascript/reference/layout/updatemenus/
公式ページに例も載ってます
https://plotly.com/javascript/dropdowns/#add-two-dropdown-menus-to-a-chart-with-plotly.js
2-1. ドロップダウンを配置する例
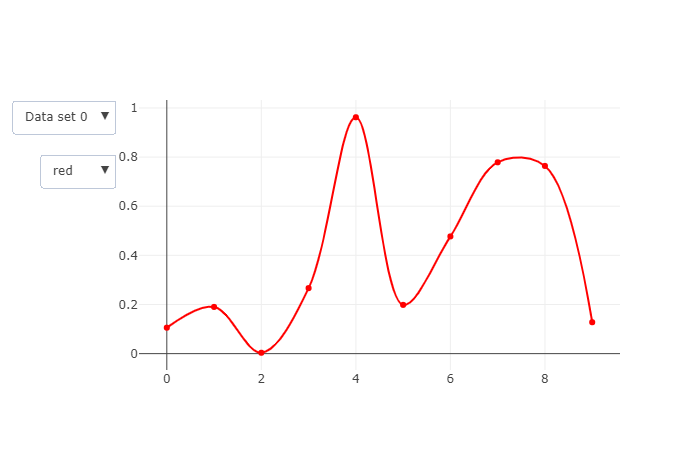
typeを省略するか、'dropdown'にすることでドロップダウンを配置して操作できます
<head>
  <script src="https://cdn.plot.ly/plotly-latest.min.js"></script>
  <script src="https://d3js.org/d3.v6.min.js"></script>
</head>

<body>
  <div id="myDiv"><!-- Plotly chart will be drawn here --></div>
  <script>
    function makeTrace(i) {
        return {
            y: Array.apply(null, Array(10)).map(() => Math.random()),
            line: {
                shape: 'spline' ,
                color: 'red'
            },
            visible: i === 0,
            name: 'Data set ' + i,
        };
    }

    Plotly.newPlot('myDiv', [0, 1, 2, 3].map(makeTrace), {
        updatemenus: [{
            type: 'dropdown',
            y: 0.8,
            yanchor: 'top',
            buttons: [{
                method: 'restyle',
                args: ['line.color', 'red'],
                label: 'red'
            }, {
                method: 'restyle',
                args: ['line.color', 'blue'],
                label: 'blue'
            }, {
                method: 'restyle',
                args: ['line.color', 'green'],
                label: 'green'
            }]
        }, {
            type: 'dropdown',
            y: 1,
            yanchor: 'top',
            buttons: [{
                method: 'restyle',
                args: ['visible', [true, false, false, false]],
                label: 'Data set 0'
            }, {
                method: 'restyle',
                args: ['visible', [false, true, false, false]],
                label: 'Data set 1'
            }, {
                method: 'restyle',
                args: ['visible', [false, false, true, false]],
                label: 'Data set 2'
            }, {
                method: 'restyle',
                args: ['visible', [false, false, false, true]],
                label: 'Data set 3'
            }]
        }],
    });
  </script>
</body>
2-2. ボタンを配置する例
typeのところをbuttonsに変えればボタンにすることも出来ます
<head>
  <script src="https://cdn.plot.ly/plotly-latest.min.js"></script>
  <script src="https://d3js.org/d3.v6.min.js"></script>
</head>

<body>
  <div id="myDiv"><!-- Plotly chart will be drawn here --></div>
  <script>
    // drop down1

    function makeTrace(i) {
        return {
            y: Array.apply(null, Array(10)).map(() => Math.random()),
            line: {
                shape: 'spline' ,
                color: 'red'
            },
            visible: i === 0,
            name: 'Data set ' + i,
        };
    }

    Plotly.newPlot('myDiv', [0, 1, 2, 3].map(makeTrace), {
        updatemenus: [{
            type: 'buttons',
            y: 0.4,
            yanchor: 'top',
            buttons: [{
                method: 'restyle',
                args: ['line.color', 'red'],
                label: 'red'
            }, {
                method: 'restyle',
                args: ['line.color', 'blue'],
                label: 'blue'
            }, {
                method: 'restyle',
                args: ['line.color', 'green'],
                label: 'green'
            }]
        }, {
            type: 'buttons',
            y: 1,
            yanchor: 'top',
            buttons: [{
                method: 'restyle',
                args: ['visible', [true, false, false, false]],
                label: 'Data set 0'
            }, {
                method: 'restyle',
                args: ['visible', [false, true, false, false]],
                label: 'Data set 1'
            }, {
                method: 'restyle',
                args: ['visible', [false, false, true, false]],
                label: 'Data set 2'
            }, {
                method: 'restyle',
                args: ['visible', [false, false, false, true]],
                label: 'Data set 3'
            }]
        }],
    });

  </script>
</body>
2-3. csvを読み込んで表示する例
d3を使ってCSVを読んで表示する例です
公式ページのコードだと動かなかったので少し変更しました
<head>
  <script src="https://cdn.plot.ly/plotly-latest.min.js"></script>
  <script src="https://d3js.org/d3.v6.min.js"></script>
</head>

<body>
  <div id="myDiv"><!-- Plotly chart will be drawn here --></div>

  <div class="showcase__section" id="bubble">
    <div class="spacer --small"></div>
    <div id="bubbleplots">
      <div class="bubbleplot" data-num="0">
        <div class="plot" id="plotdiv"></div>
        <div class="control-row">
          Country: <select class="countrydata">
          </select>
        </div>
      </div>
    </div>
  </div>
  <script>
    d3.csv('https://raw.githubusercontent.com/plotly/datasets/master/gapminderDataFiveYear.csv', function(data, i){
      return {
        index: i,
        data: data
      }
    }).then(function(data) {
      function unpack(data, key) {
        return data.map(function(row) { return row['data'][key]; });
      }

      var allCountryNames = unpack(data, 'country'),
        allYear = unpack(data, 'year'),
        allGdp = unpack(data, 'gdpPercap'),
        listofCountries = [],
        currentCountry,
        currentGdp = [],
        currentYear = [];

    for (var i = 0; i < allCountryNames.length; i++ ){
      if (listofCountries.indexOf(allCountryNames[i]) === -1 ){
          listofCountries.push(allCountryNames[i]);
      }
    }

    function getCountryData(chosenCountry) {
        currentGdp = [];
        currentYear = [];
        for (var i = 0 ; i < allCountryNames.length ; i++){
            if ( allCountryNames[i] === chosenCountry ) {
                currentGdp.push(allGdp[i]);
                currentYear.push(allYear[i]);
            }
        }
    };

    // Default Country Data
    setBubblePlot('Afghanistan');

    function setBubblePlot(chosenCountry) {
        getCountryData(chosenCountry);

        var trace1 = {
            x: currentYear,
            y: currentGdp,
            mode: 'lines+markers',
            marker: {
                size: 12,
                opacity: 0.5
            }
        };

        var data = [trace1];

        var layout = {
            title:'Line and Scatter Plot',
            height: 400,
            width: 480
        };

        Plotly.newPlot('myDiv', data, layout);
    };

    var innerContainer = document.querySelector('[data-num="0"'),
        plotEl = innerContainer.querySelector('.plot'),
        countrySelector = innerContainer.querySelector('.countrydata');

    function assignOptions(textArray, selector) {
        for (var i = 0; i < textArray.length;  i++) {
            var currentOption = document.createElement('option');
            currentOption.text = textArray[i];
            selector.appendChild(currentOption);
        }
    }

    assignOptions(listofCountries, countrySelector);

    function updateCountry(){
        setBubblePlot(countrySelector.value);
    }

    countrySelector.addEventListener('change', updateCountry, false);
    }
  );

</script>
</body>
まとめ
この辺が出来るとJavaScriptらしくなってきますね
レッツトライ


