データ可視化ライブラリD3.js v5を使って表をつくる方法をまとめます
1. d3のDOM操作
1-1. 対象を選択する
単独の対象を選択する
d3.select()がやってくれます
d3.select('div')
d3.select('#hoge')
複数の対象をすべて選択する
d3.selectAll()がやってくれます
d3.selectAll('div')
続けて選択する
連ねて書くと最初に指定した条件のタグからスタートして内側を検索できます
d3.select('#hoge').selectAll('div')
1-2. 操作する
d3.append('div')
d3.attr('class', 'hoge')
d3.style("color", "red")
d3.text('fuga')
d3.remove()
d3.on('click', function(){})
1-3. 実装例
ここまでのメソッドを使って実際に動かしてみます
<head>
  <script src="https://d3js.org/d3.v5.min.js"></script>
</head>

<body>
  <div id="chart"></div>
</body>

<script>
  d3.select("#chart")
    .append("div")
      .attr("class", "hoge")
      .style("color", "red")
      .text('いっぽんでもにんじん');
      .on('click', function(){ console.log("clicked"); });
</script>
上記をブラウザ上で開くと以下のように書き換わって表示されます
<body>
  <div id="chart">
    <div class="hoge" style="color: red;">いっぽんでもにんじん</div>
  </div>
</body>

また、文字列が表示されている部分をクリックするとclickイベントを拾ってconsole.log("clicked")してくれます

こんな感じでシンプルにDOM操作を記述できます
1-4. 配列を展開する
d3.data()に配列やオブジェクトを渡してやると、操作対象とデータを重ねた状態にしてくれます。ここがd3のすごいところでもあり、ちょっと分かりにくい部分でもあると思います
d3.data(['1', '2', '3'])
このdata()で受け取った内容をどう扱うかについてenter, update, exitの3種類の扱い方があります
こちらの記事のコードが分かりやすかったのでお借りしてやってみましょう
https://kita-note.com/d3-basic-001
enter()でタグを追加する
enter()した場合は該当タグが存在しないときに指定通りに追加します
例えば、以下のようにした場合、id='chart'であるタグ内にあるdivタグ内にdivタグを足して、書き出す文字列を配列から受け取った値を使って決めるという挙動になります。何故selectAll('div')した上でappend('div')しないといけないのかよく分かってないんで誰か教えてほしいんですが、どちらか消すと動かなくなります
text()の引数に関数を与えた場合、d3が第1引数に値、第2引数に順番を入れて実行した結果を書き出してくれます。また、以下のように第2引数を省略して第1引数だけ受け取ることも出来ます。
<head>
  <script src="https://d3js.org/d3.v5.min.js"></script>
</head>

<body>
  <div id="chart"></div>
</body>

<script>
  const data = ['1', '2', '3'];
  d3.select("#chart")  // 既に書いてあるid='chart'のタグをこれで選択
    .selectAll("div")  // まだ存在してないdivタグを指定
      .data(data)  // 配列を渡す
      .enter()  // enter()
      .append("div")  // divタグを足す
        .style("color", "red")  // styleを足す
        .text(function(d) { return 'div:' + d; });  // 文字列を書き出す
</script>
こんな感じになります
<body>
  <div id="chart">
    <div style="color: red;">div:1</div>
    <div style="color: red;">div:2</div>
    <div style="color: red;">div:3</div>
  </div>
</body>
enter()では更新がかからない
では、以下のようにdivタグが1つある状態でenter()するとどうなるでしょうか
<head>
  <script src="https://d3js.org/d3.v5.min.js"></script>
</head>

<body>
  <div id="chart">
    <div></div>
  </div>
</body>

<script>
  const data = ["1", "2", "3"];
  d3.select("#chart")
    .selectAll("div")
      .data(data)
      .enter()
      .append("div")
        .style("color", "red")
        .text(function(d) { return "create div element:" + d; });
</script>
enter()は既にあるタグについては更新が掛からないので以下のようになります
<body>
  <div id="chart">
    <div></div>
    <div style="color: red;">create div element:2</div>
    <div style="color: red;">create div element:3</div>
  </div>
</body>
updateで既に存在するタグを更新する
enter()を省略すると更新のみ行うupdateになります
<head>
  <script src="https://d3js.org/d3.v5.min.js"></script>
</head>

<body>
  <div id="chart">
    <div></div>
  </div>
</body>

<script>
  const data = ["1", "2", "3"];
  d3.select("#chart")
    .selectAll("div")
      .data(data)
      .append("div")
        .style("color", "red")
        .text(function(d) { return "create div element:" + d; });
</script>
updateではタグの追加は行われないので以下のようになります
<body>
  <div id="chart">
    <div style="color: red;">create div element:1</div>
  </div>
</body>
merge()で追加と更新を両方やる
追加しつつ更新もやりたい場合は両方書けば出来るわけですが、ダサいですし内部処理的にも重複して遅くなっちゃいそうです
<head>
  <script src="https://d3js.org/d3.v5.min.js"></script>
</head>

<body>
  <div id="chart">
    <div></div>
  </div>
</body>

<script>
  const data = ["1", "2", "3"];
  d3.select("#chart")
    .selectAll("div")
      .data(data)
      .enter()
      .append("div")

  d3.select("#chart")
    .selectAll("div")
      .data(data)
      .style("color", "blue")
      .text(function(d) { return "create div element:" + d; });
</script>
そんなときはmerge()で両方をまとめて書けば処理的にも最適化するというのが出来るようです
<head>
  <script src="https://d3js.org/d3.v5.min.js"></script>
</head>

<body>
  <div id="chart">
    <div></div>
  </div>
</body>

<script>
  const data = ["1", "2", "3"];
  const data_div = d3.select("#chart")  // 共通部分のselectionを作っておきます
    .selectAll("div")
    .data(data)

  data_div.enter()  // enter().append()したものとupdateで実行するものをmerge()します
    .append("div")
    .merge(data_div)
      .style("color", "red")
      .text(function(d) { return "create div element:" + d; });
</script>
上手くいったようです
<body>
  <div id="chart">
    <div style="color: red;">create div element:1</div>
    <div style="color: red;">create div element:2</div>
    <div style="color: red;">create div element:3</div>
  </div>
</body>
exit()で削除する
データが2件でタグが既に3つあるような場合、不要なタグを消す操作をexit().remove()がやってくれます
<head>
  <script src="https://d3js.org/d3.v5.min.js"></script>
</head>

<body>
  <div id="chart">
    <div style="color: red;">remove div element:1</div>
    <div style="color: red;">remove div element:2</div>
    <div style="color: red;">remove div element:3</div>
  </div>
</body>

<script>
  const data = ["1", "2"];
  const data_div = d3.select("#chart")
    .selectAll("div")
      .data(data)
      .style("color", "red")
      .text(function(d) { return "update div element:" + d; })
      .exit().remove()
</script>
<body>
  <div id="chart">
    <div style="color: red;">update div element:1</div>
    <div style="color: red;">update div element:2</div>
  </div>
</body>
1-5. オブジェクトを展開する
オブジェクトを要素とする配列を展開する場合もdata()を使えます
<head>
  <script src="https://d3js.org/d3.v5.min.js"></script>
</head>

<body>
  <div id="chart">
  </div>
</body>

<script>
  const data = [
    { "name": "A", "num": 1 },
    { "name": "B", "num": 2 },
    { "name": "C", "num": 3 }
  ]

  const data_div = d3.select("#chart")
    .selectAll("div")
      .data(data)
      .enter()
      .append("div")
        .style("color", "red")
        .text(function(d, idx) { return idx + " th num: " + d["num"] + ": name: " + d["name"] ; })
</script>
d3でCSVを開くと上記のような形式で出てくるので、CSVを読んで表を書くような場合は同じやり方で展開することが出来ます
1-6. CSVファイルを読み込む
d3.csv()でURLまたはPATHを指定すれば読んできてくれます
  d3.csv(ここにURLかPATHを書く, function(row, i){
    return {
      index: i,
      data: row
    }
  }).then(function(data) {
    console.log(data);
  })
上記のコードで下のようなCSVファイルを開くと1行ごとにオブジェクトに入れた配列にしてくれます
a, b, c
1, 1, 1
2, 4, 8
3, 9, 27
[{'a': 1, 'b': 1, 'c': 1},
 {'a': 2, 'b': 4, 'c': 8},
 {'a': 3, 'b': 9, 'c': 27}]
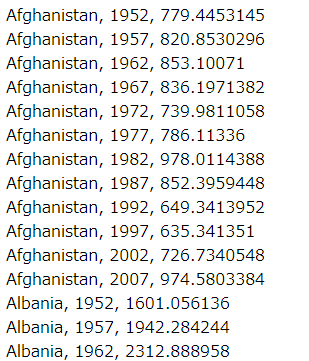
plotly.jsのサンプルページにあったCSVファイルをお借りして表示してみると以下のように出来ます
<head>
  <script src="https://d3js.org/d3.v5.min.js"></script>
</head>

<body>
  <div id="chart"></div>
</body>

<script>
  d3.csv('https://raw.githubusercontent.com/plotly/datasets/master/gapminderDataFiveYear.csv', function(data, i){
    return {
      index: i,
      data: data
    }
  }).then(function(data) {
    d3.select("#chart")
    .selectAll("div")
      .data(data)
      .enter()
      .append("div")
        .text(function(d) { return d["data"]["country"] + ", " + d["data"]["year"] + ", " + d["data"]["gdpPercap"]; });
  })
</script>
 この調子でグラフや表に流し込んで表示することも出来ます
1-7. アロー関数を使うときは注意
なお、値を展開するときに使う関数をアロー関数で書くと思ったような動作にならないことがあるようです。これはアロー関数がthisを束縛しない性質によるようで、d3.selectionに渡す関数を書くときはアロー関数にしない方が無難っぽいです。
2. 表をつくる
というのを踏まえて表を作ってみましょう
こちらのコードが分かりやすかったのでお借りしてやってみます
https://wizardace.com/d3-table/
<!DOCTYPE html>
<html>

<head>
  <meta charset="utf-8">
  <title>sample</title>
  <link href="https://cdn.jsdelivr.net/npm/bootstrap@5.0.0-beta1/dist/css/bootstrap.min.css" rel="stylesheet" integrity="sha384-giJF6kkoqNQ00vy+HMDP7azOuL0xtbfIcaT9wjKHr8RbDVddVHyTfAAsrekwKmP1" crossorigin="anonymous">
  <script src="https://d3js.org/d3.v5.min.js"></script>
</head>

<body>
  <script>
    var dataset = [
      { "name": "A", "para1": 0, "para2": 5 },
      { "name": "B", "para1": 1, "para2": 6 },
      { "name": "C", "para1": 2, "para2": 7 },
      { "name": "D", "para1": 3, "para2": 8 },
      { "name": "E", "para1": 4, "para2": 9 }
    ]

    const names = d3.keys(dataset[0]);

    function make_table(div){
      const table = d3.select("body")
        .append('div')
        .attr('class', 'table-responsive')
        .append("table")
        .attr('class', 'table table-light') // table-striped table-hover

      table.append("thead")
        .append("tr")
        .selectAll("th")
        .data(names)
        .enter()
        .append("th")
        .text(function(d) { return d; });

      table.append("tbody")
        .selectAll("tr")
        .data(dataset)
        .enter()
        .append("tr")
        .selectAll("td")
        .data(function(row) { return d3.entries(row); })
        .enter()
        .append("td")
        .text(function(d) { return d.value; })

      let selected = Array(dataset.length).fill(false);
      const index = Array.from({length: dataset.length}, (_, i) => i);
      const activated = [null, 'table-active'];

      d3.select('tbody')
        .selectAll("tr")
        .data(index)
        .on('click', function(i) {
          selected[i] = !selected[i];
          d3.select(this).attr('class', activated[selected[i] * 1]);
        });

      return selected;
    }

    function remove_table(){
      const div = d3.select('body')
        .select('div')
        .remove();
    }

    function update_table(){
      remove_table();
      make_table();
    }

    let selected = make_table();

  </script>
</body>

</html>
やってる事はベタなDOM操作です
<div class="table-responsive">
  <table class="table table-light">
    <thead>
      <tr>
        <th>name</th>
        <th>para1</th>
        <th>para2</th>
      </tr>
    </thead>
    <tbody>
      <tr>
        <td>A</td>
        <td>0</td>
        <td>5</td>
      </tr>
      <tr>
        <td>B</td>
        <td>1</td>
        <td>6</td>
      </tr>
      <tr>
        <td>C</td>
        <td>2</td>
        <td>7</td>
      </tr>
      <tr>
        <td>D</td>
        <td>3</td>
        <td>8</td>
      </tr>
      <tr>
        <td>E</td>
        <td>4</td>
        <td>9</td>
      </tr>
    </tbody>
  </table>
</div>
完成です

イベントハンドラも簡単に付けられるのが素晴らしいですね
3. 表とプロットを組み合わせる
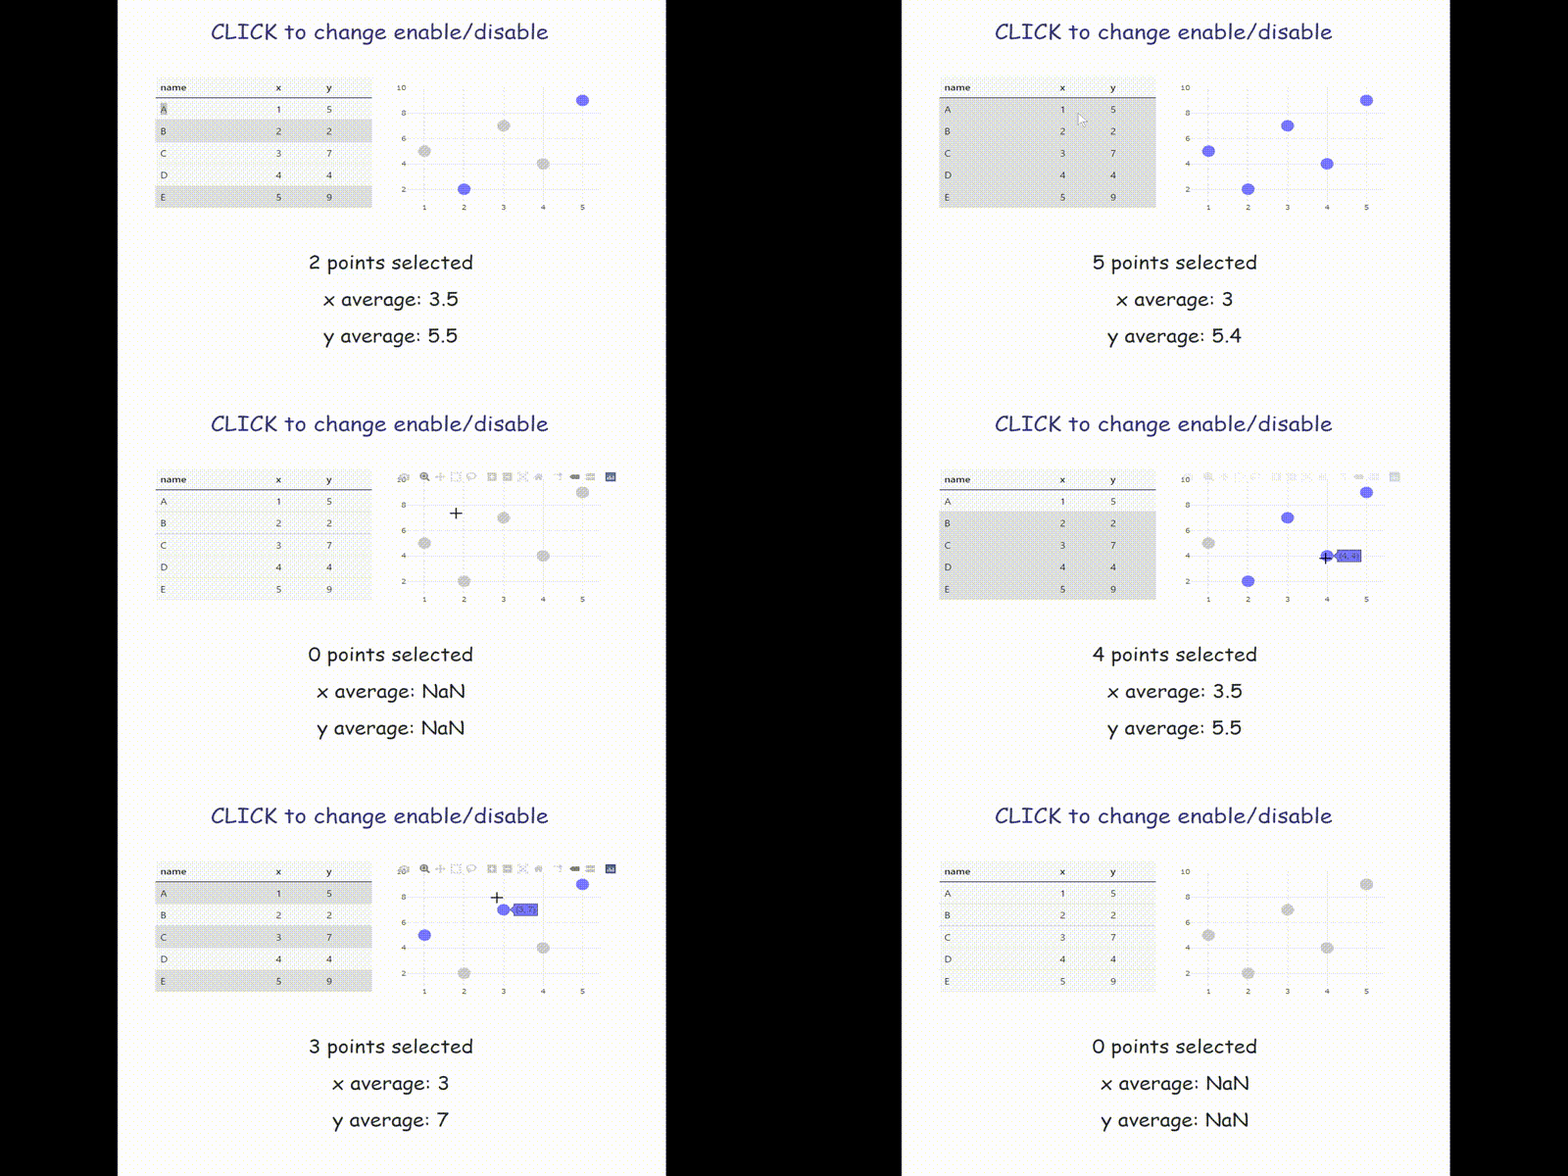
Plotly.jsのプロットと組み合わせて選択対象をクリックイベントで切り替えるように作ってみます
<head>
  <title>EventHandlerサンプル</title>
  <link href="https://cdn.jsdelivr.net/npm/bootstrap@5.0.0-beta1/dist/css/bootstrap.min.css" rel="stylesheet" integrity="sha384-giJF6kkoqNQ00vy+HMDP7azOuL0xtbfIcaT9wjKHr8RbDVddVHyTfAAsrekwKmP1" crossorigin="anonymous">
  <link href="https://fonts.googleapis.com/css?family=Amatic+SC:700 rel="stylesheet">
  <script src="https://d3js.org/d3.v5.min.js"></script>
  <script src="https://cdn.plot.ly/plotly-latest.min.js"></script>
  <style type="text/css">
    h1 {text-align:center; color:#337; font-family: 'Amatic SC', cursive; padding-top: 40; padding-bottom: 50;}
    p {text-align:center; font-family: 'Amatic SC', cursive; font-size: 200%; padding-left: 5%;}
  </style>
</head>
<body>
  <h1>CLICK to change enable/disable</h1>
  <div class="container">
    <div class="row">
      <div id="table" class="col-6"><!-- table here --></div>
      <div id="myDiv" class="col-6"><!-- Plotly chart here --></div>
      <div id="msg1"><p></p></div>
      <div id="msg2"><p></p><p></p></div>
    </div>
  </div>
</body>

<script src="./js/main.js"></script>
const dataset = [
  { "name": "A", "x": 1, "y": 5 },
  { "name": "B", "x": 2, "y": 2 },
  { "name": "C", "x": 3, "y": 7 },
  { "name": "D", "x": 4, "y": 4 },
  { "name": "E", "x": 5, "y": 9 }
];

///////////////////////////////////////////////////////////

const activated = [null, 'table-active'];
let selected = [false, true, true, false, false];

function get_xy(dataset, key) {
  return dataset.map((row) => { return row[key] });
}

function get_x(dataset) {
  return get_xy(dataset, 'x')
}

function get_y(dataset) {
  return get_xy(dataset, 'y')
}

function select_x(x, selected) {
  return x.filter(function(_, i) {
    return (selected[i]);
  });
}

function mean(x) {
  return Math.round(d3.mean(x)*100)/100
}

///////////////////////////////////////////////////////////

function make_plot(dataset, selected) {
  console.log('make_plot()');

  const myPlot = document.getElementById('myDiv'),

  data = [{ x:get_x(dataset),
            y:get_y(dataset),
            visible: selected,
            type:'scatter',
            mode:'markers',
            marker:{size:20}
          }],
  layout = {hovermode:'closest',
            height: 300,
            margin: {
              t: 20,
              l: 30,
              r: 30
            }
   };

  Plotly.newPlot('myDiv', data, layout);

  myPlot.on('plotly_click', function(data){
    console.log('plotly_clicked');

    const i = data.points[0].pointIndex
    update(selected, i, activated);
  });
}

///////////////////////////////////////////////////////////

function make_table(dataset, selected, activated){
  console.log('make_table()');

  const names = d3.keys(dataset[0]);
  const table = d3.select("#table")
    .append('div')
    .attr('class', 'table-responsive')
    .append("table")
    .attr('class', 'table table-light') // table-striped table-hover

  table.append("thead")
    .append("tr")
    .selectAll("th")
    .data(names)
    .enter()
    .append("th")
    .text(function(d) { return d; });

  table.append("tbody")
    .selectAll("tr")
    .data(dataset)
    .enter()
    .append("tr")
    .selectAll("td")
    .data(function(row) { return d3.entries(row); })
    .enter()
    .append("td")
    .text(function(d) { return d.value; })

  const activated_arr = selected.map((b) => { return activated[b*1]; });

  d3.select('tbody')
    .selectAll("tr")
      .data(activated_arr)
      .on('click', function(_, i){
        console.log('table clicked');
        update(selected, i, activated);
      })
}

///////////////////////////////////////////////////////////

function update(selected, i, activated) {
  update_selected(selected, i);
  update_table(selected, activated);
  update_plot(selected);
  update_msg(dataset, selected)
}

function update_selected(selected, i) {
  selected[i] = !selected[i];
  console.log(selected);
}

function update_plot(selected) {
  const color = ['#ccc', '#77f']
  const colors = selected.map((select) => color[select * 1])
  const update = {'marker':{color: colors, size: 20}};
  Plotly.restyle('myDiv', update);
}

function update_table(selected, activated) {
  const activated_arr = selected.map((b) => { return activated[b*1]; });
  d3.select('tbody')
    .selectAll("tr")
      .data(activated_arr)
      .attr('class', function(d){ return d; });
}

function update_msg(dataset, selected){
  const x = select_x(get_x(dataset), selected);
  const y = select_x(get_y(dataset), selected);

  d3.select('#msg1')
    .selectAll('p')
      .text(x.length + ' points selected')

  d3.select('#msg2')
    .selectAll('p')
      .data([['x', x], ['y', y]])
      .text(function(values){ return values[0] + ' average: ' + mean(values[1]); })
}

///////////////////////////////////////////////////////////

make_table(dataset, selected, activated);
make_plot(dataset, selected);

console.log(selected);
update_table(selected, activated);
update_plot(selected);
update_msg(dataset, selected)
出来ました
d3でやるんだからプロットもd3で作れば良かったんですが、都合でPlotly.jsにしたかったのでこんな感じになりました
まとめ
d3.jsめっちゃ便利
みんなも使おう
参考にしたサイト


