背景
元々の目的はユーザー定義プロジェクトのモニタリングを使うことではなく、Argo RolloutsでProgressive Deliveryを実施する際の分析にPrometheusのメトリクスを使うユースケースを試したかったのが発端です。
そこで、OpenShift上でPrometheusのメトリクスを使う方法を色々と調査してみるとv4.6でユーザー定義プロジェクトのモニタリング機能がGAされており、これを使ってArgo Rolloutsと連携できないものかと考えました。
結論としてはArgo Rolloutsでは認証なしのHTTPエンドポイントしかサポートされていない(GitHub上で確認中)模様ですが、ユーザー定義プロジェクトのモニタリング機能は認証が必要なHTTPSエンドポイントで構成されるためそのまま利用できないということでした。
どうしても、HTTPの認証無しでアクセスできるようにしたい場合は、個別にプロキシー用のPodを用意してくださいとのことでした。
今回はArgo RolloutsとPrometheusの連携を試したいだけなので、個別のプロキシーを用意するよりも、従来から使用されているPrometheus Operatorをユーザー定義プロジェクトのメトリクス用に別途インストールするほうが簡単そうなので、こちらの記事ではその構成手順をまとめています。
※v4.6でGAされたユーザー定義プロジェクトのモニタリング機能を構成する手順についてはこちらの記事を参照してください。
実施手順
ユーザー定義プロジェクトのモニタリングの無効化
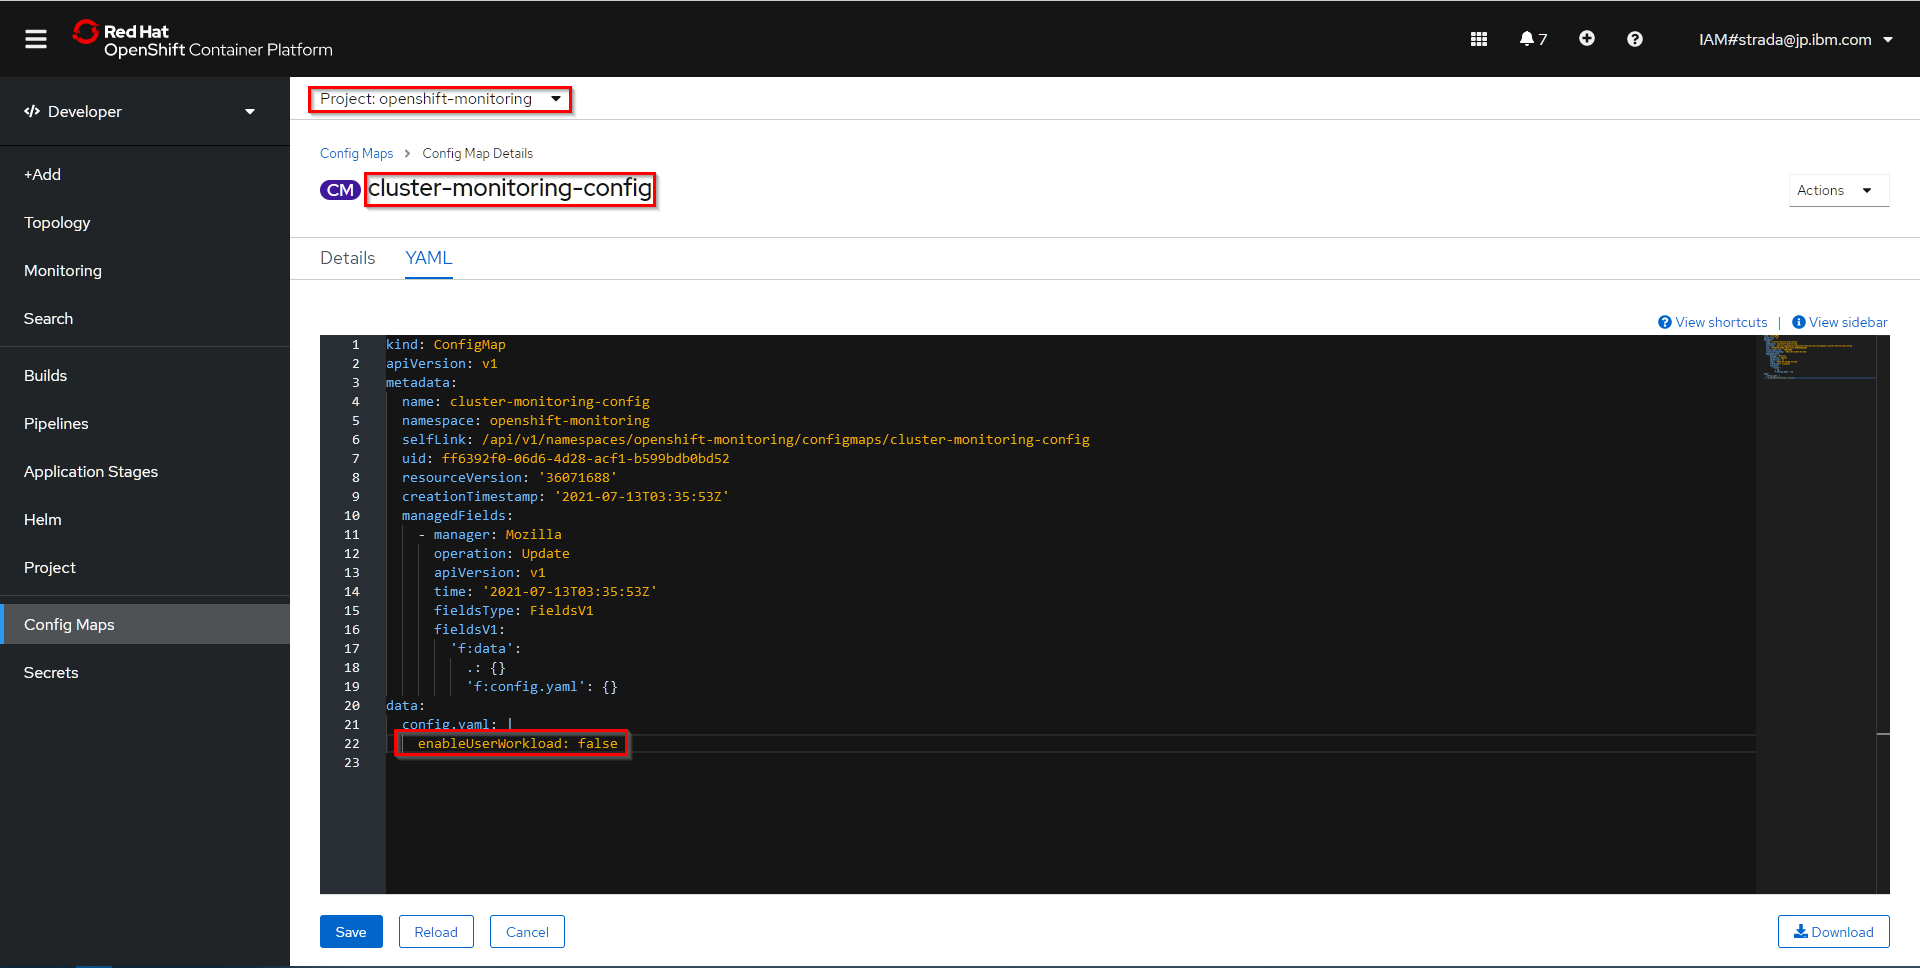
ユーザー定義プロジェクトのモニタリング機能を有効化している場合はPrometheus Operatorの機能とバッティングしてしまい双方の機能が正しく動作しなくなってしまうようなので、以下のマニュアルを参考にユーザー定義プロジェクトのモニタリング機能を無効にします。
-
openshift-monitoringプロジェクトのcluster-monitoring-configConfigMapのdata/config.yamlでenableUserWorkloadをfalseに設定
-
prometheus-operator、prometheus-user-workloadおよびthanos-ruler-user-workloadPodがopenshift-user-workload-monitoringプロジェクトで終了していることを確認
PS D:\git> oc -n openshift-user-workload-monitoring get pod
No resources found in openshift-user-workload-monitoring namespace.
PS D:\git>
Prometheus OperatorをOperatroHubより導入
-
prometheus-operatorプロジェクトを作成
PS D:\git> oc new-project prometheus-operator
Now using project "prometheus-operator" on server "https://c103-e.us-south.containers.cloud.ibm.com:31989".

You can add applications to this project with the 'new-app' command. For example, try:

    oc new-app rails-postgresql-example

to build a new example application in Ruby. Or use kubectl to deploy a simple Kubernetes application:

    kubectl create deployment hello-node --image=k8s.gcr.io/serve_hostname

PS D:\git>
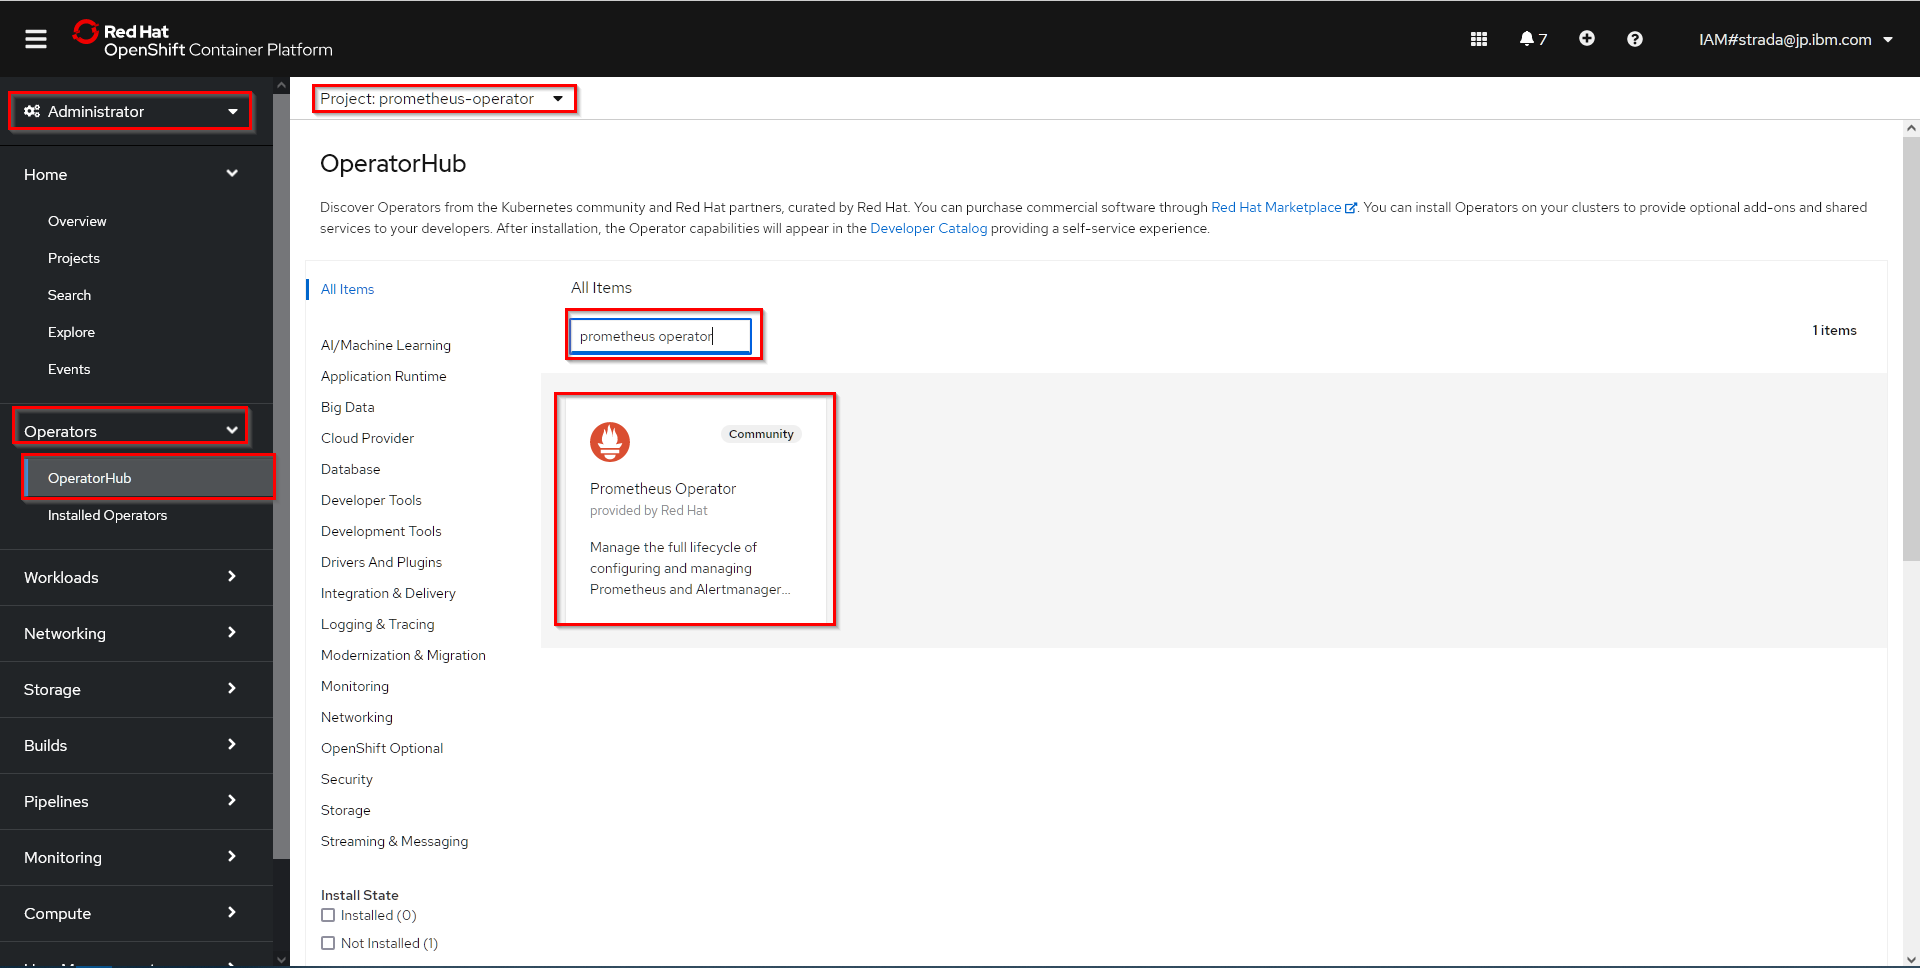
- Administratorパースペクティブを選択し、左メニューよりOperators->OperatorHubを選択
-
prometheus-operatorプロジェクトを選択 - フィルター入力欄に
prometheus operatorを入力し、表示されたPrometheus Operatorをクリック
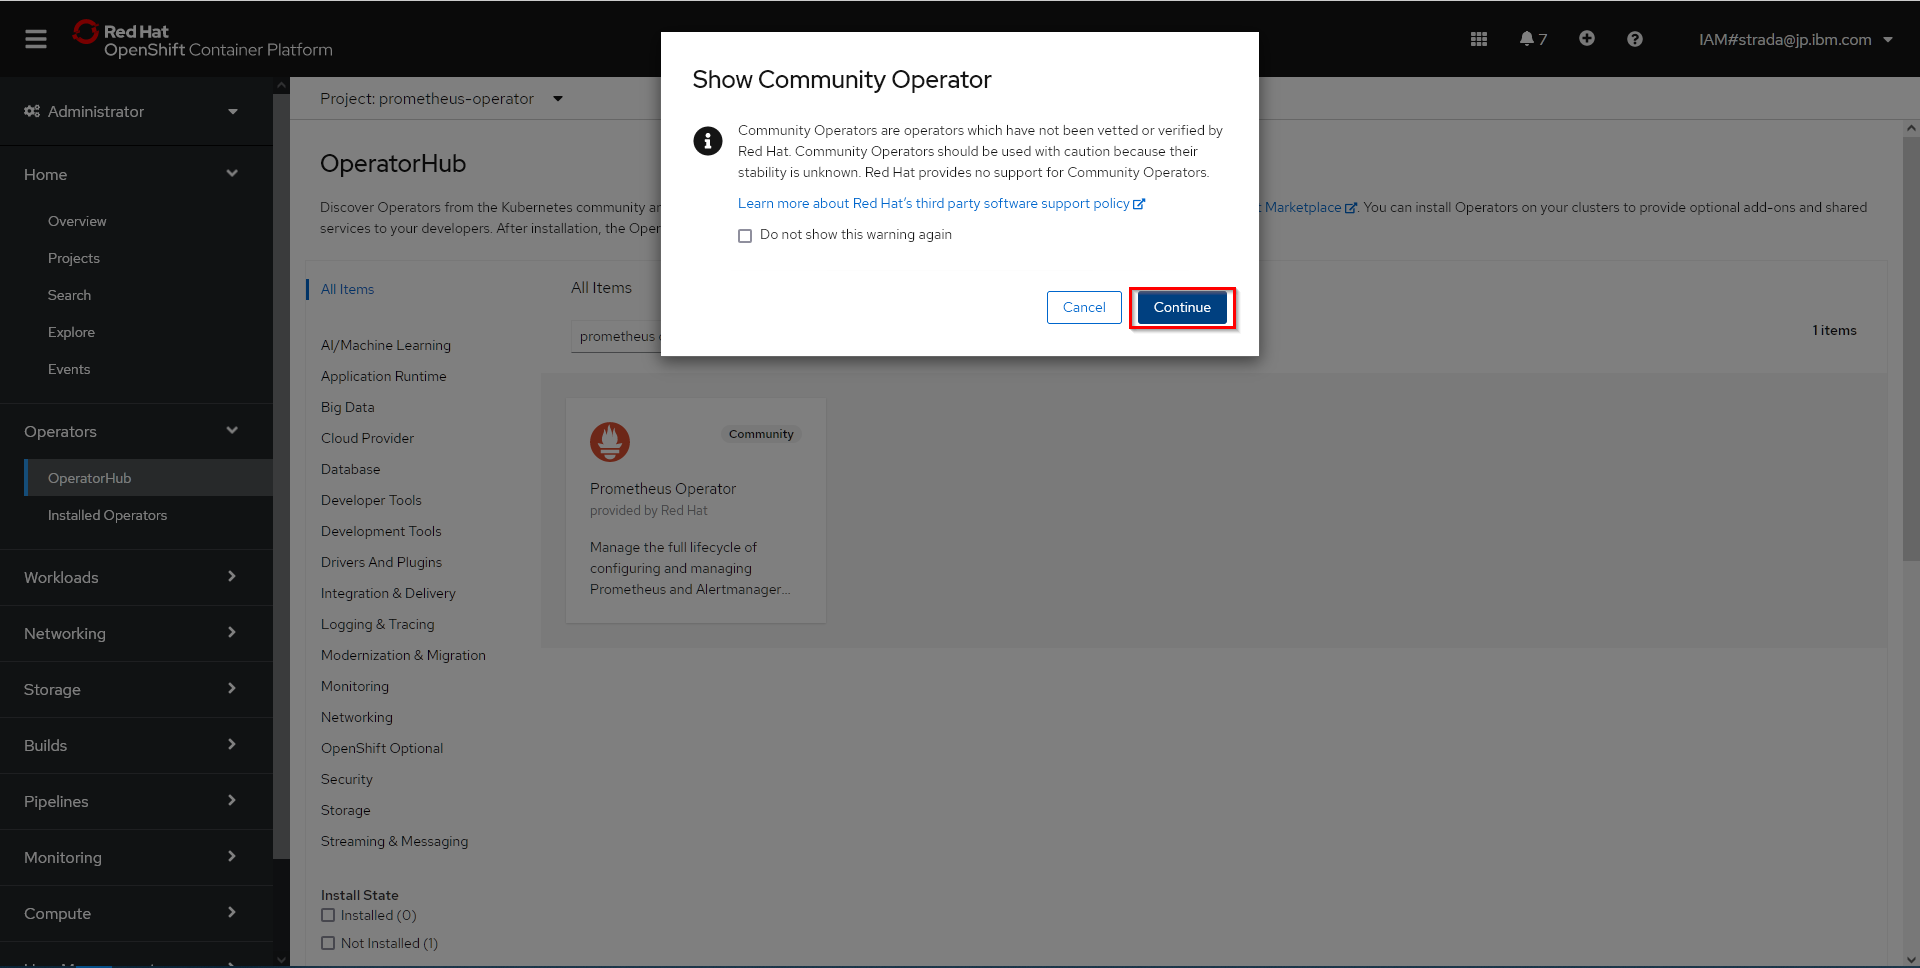
- Show Community Operatorのダイアログが表示された場合はそのままContinueをクリック
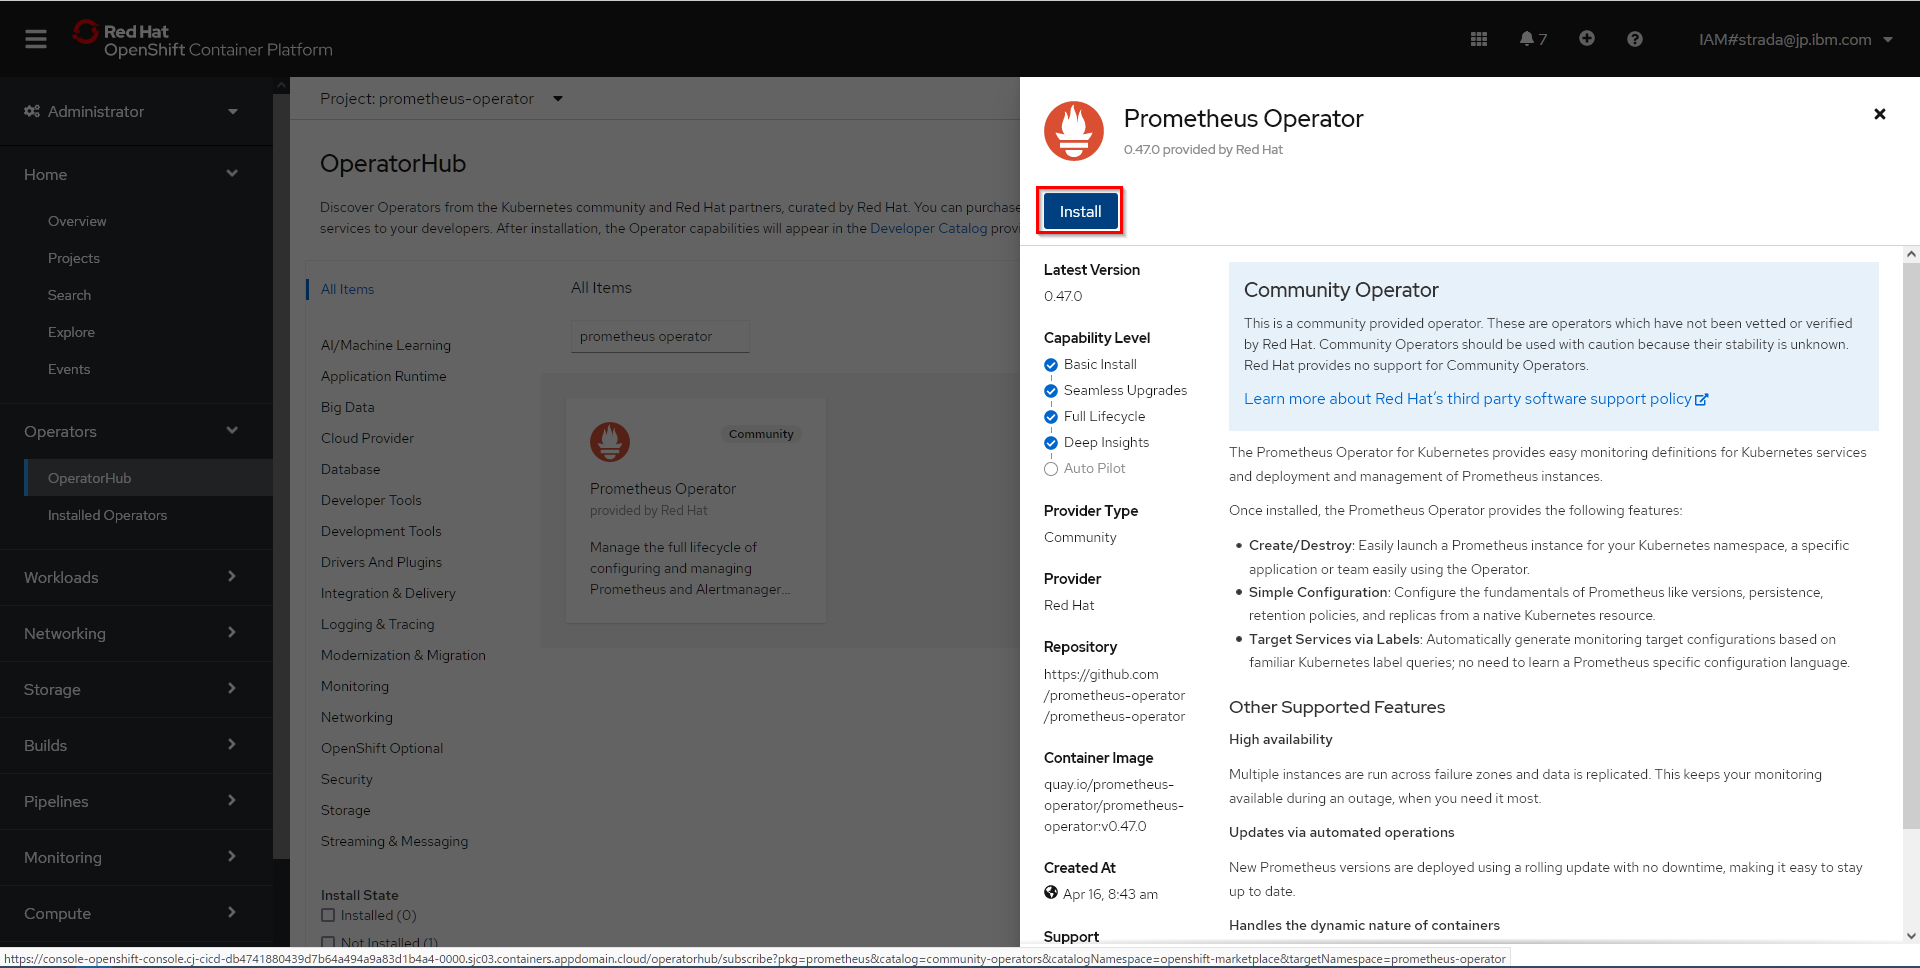
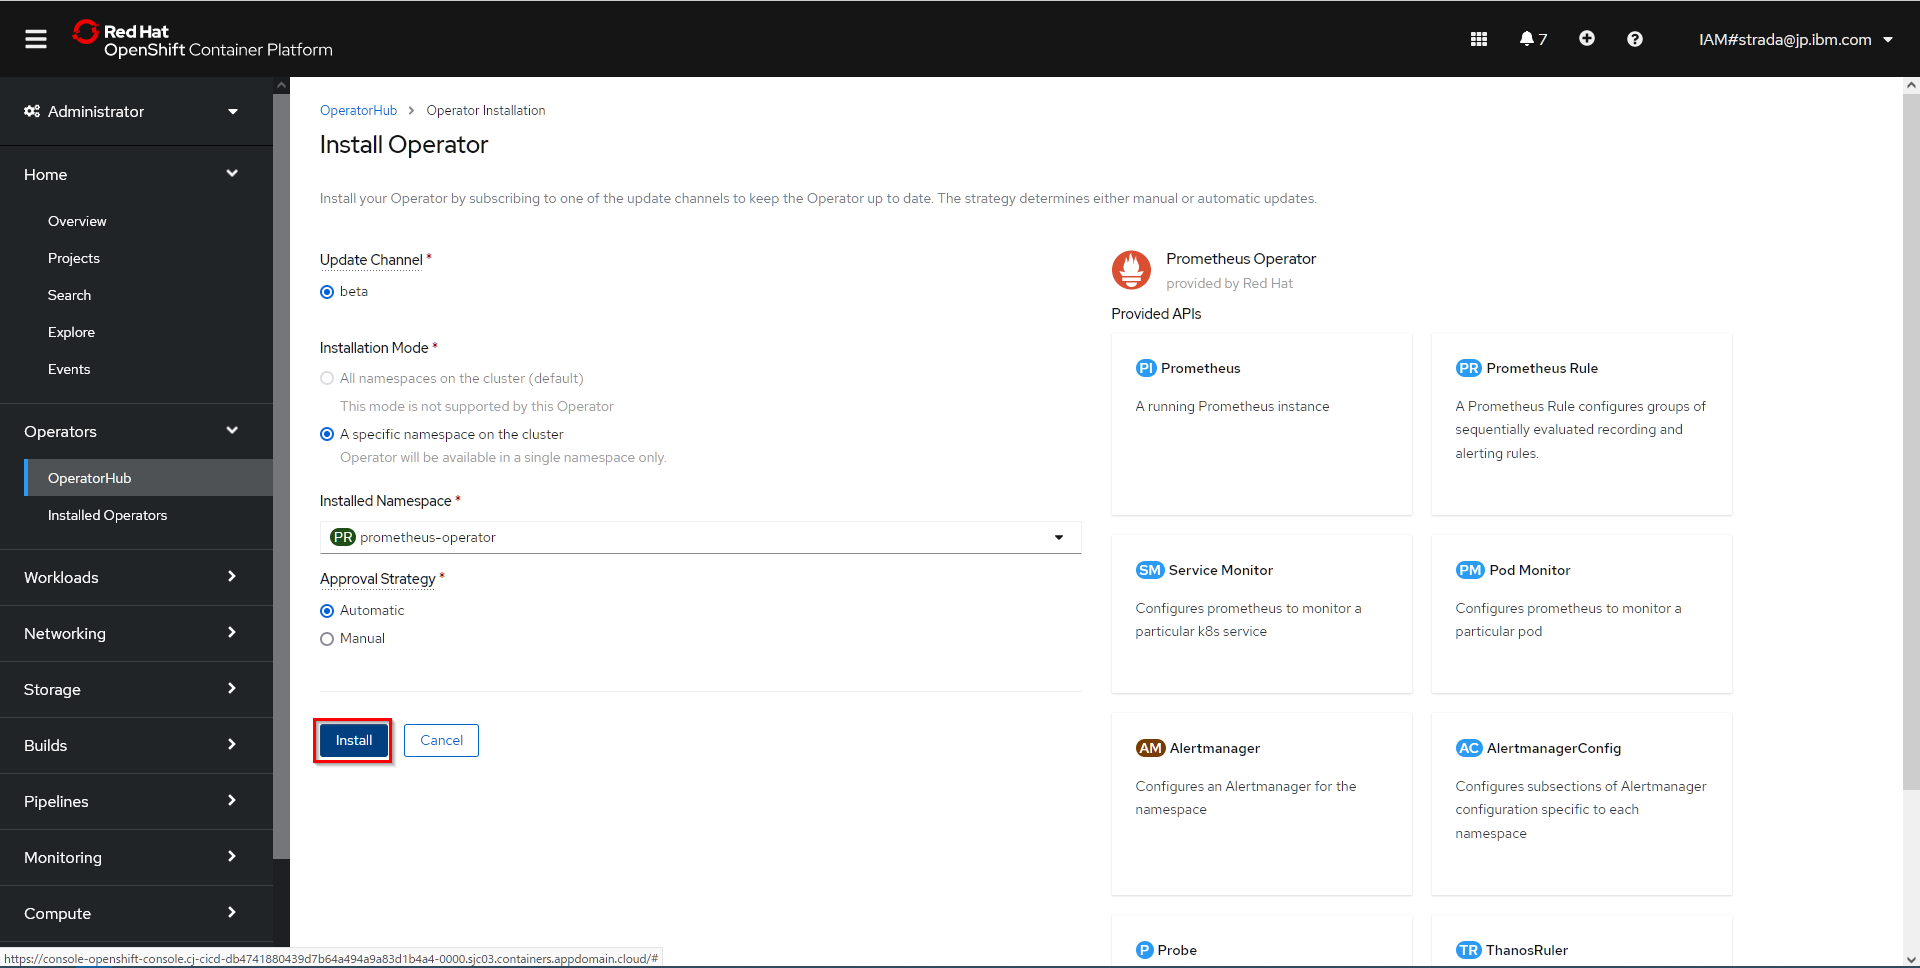
- Operatorの説明の画面で内容を確認し、Installをクリック
- Operatorの設定画面で特に設定は変更せずにInstallをクリック
-
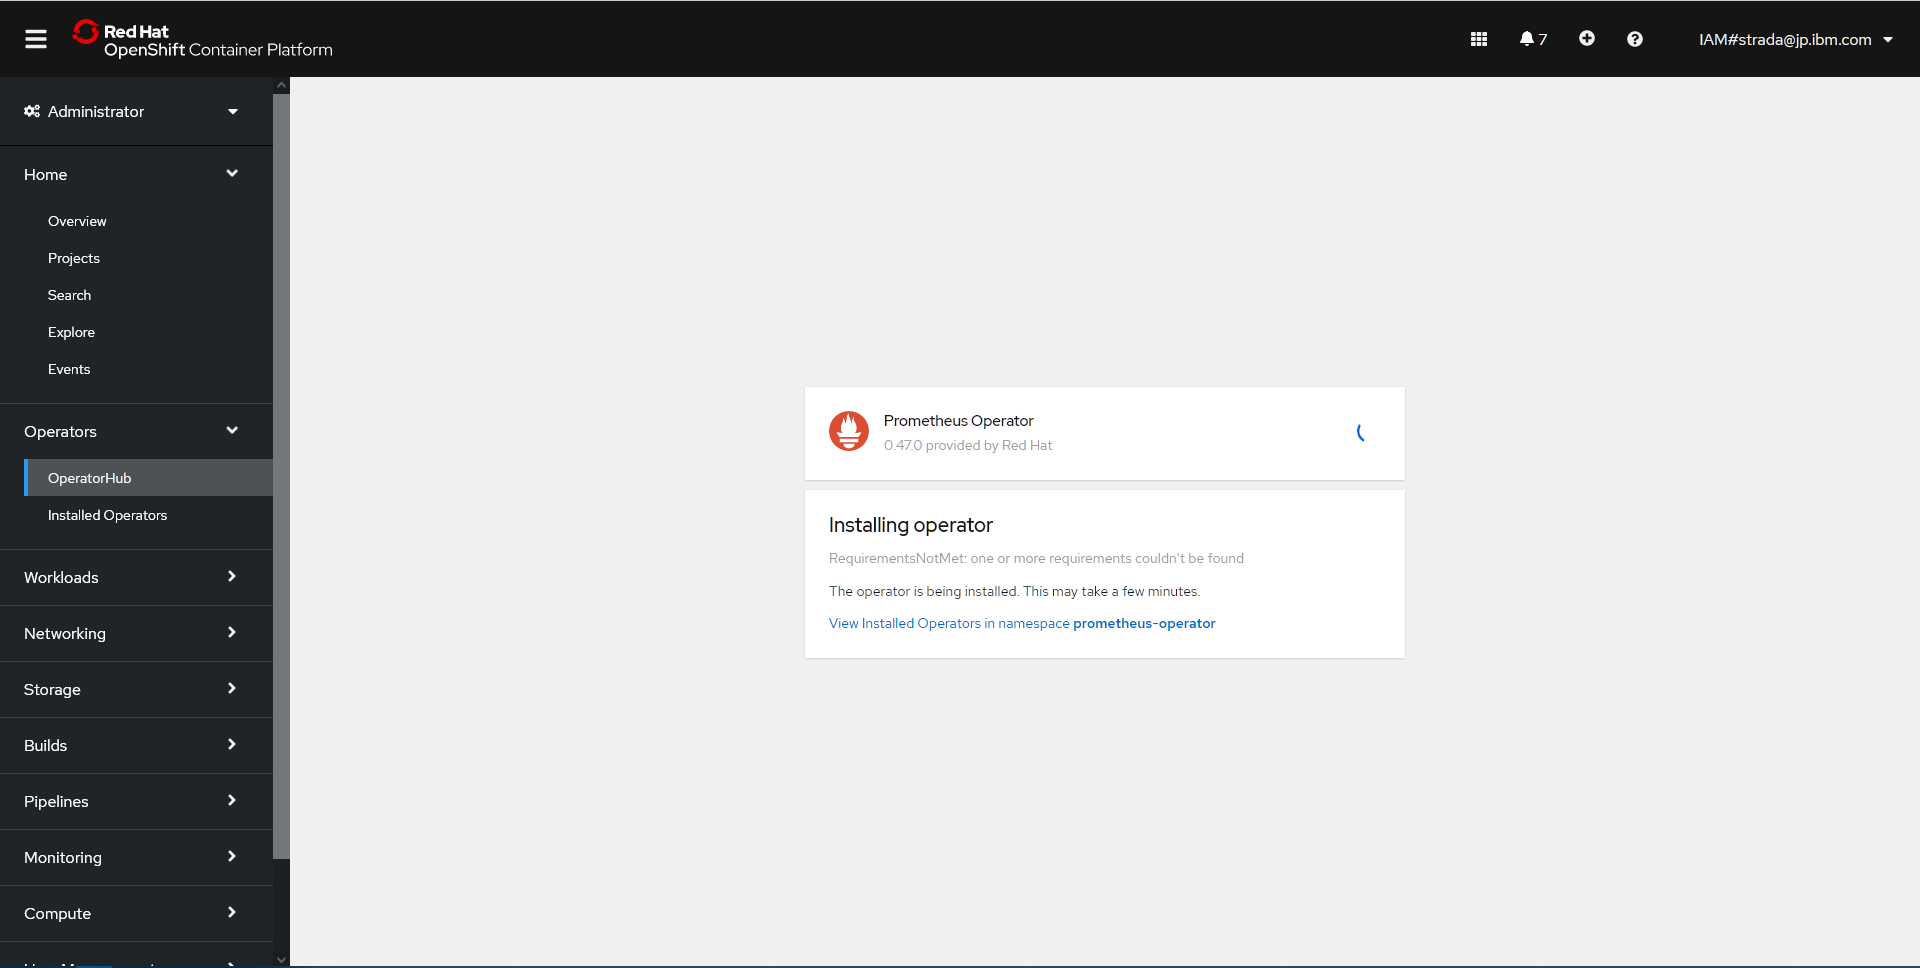
以下の画面が表示されたらインストールが完了するまで待機
-
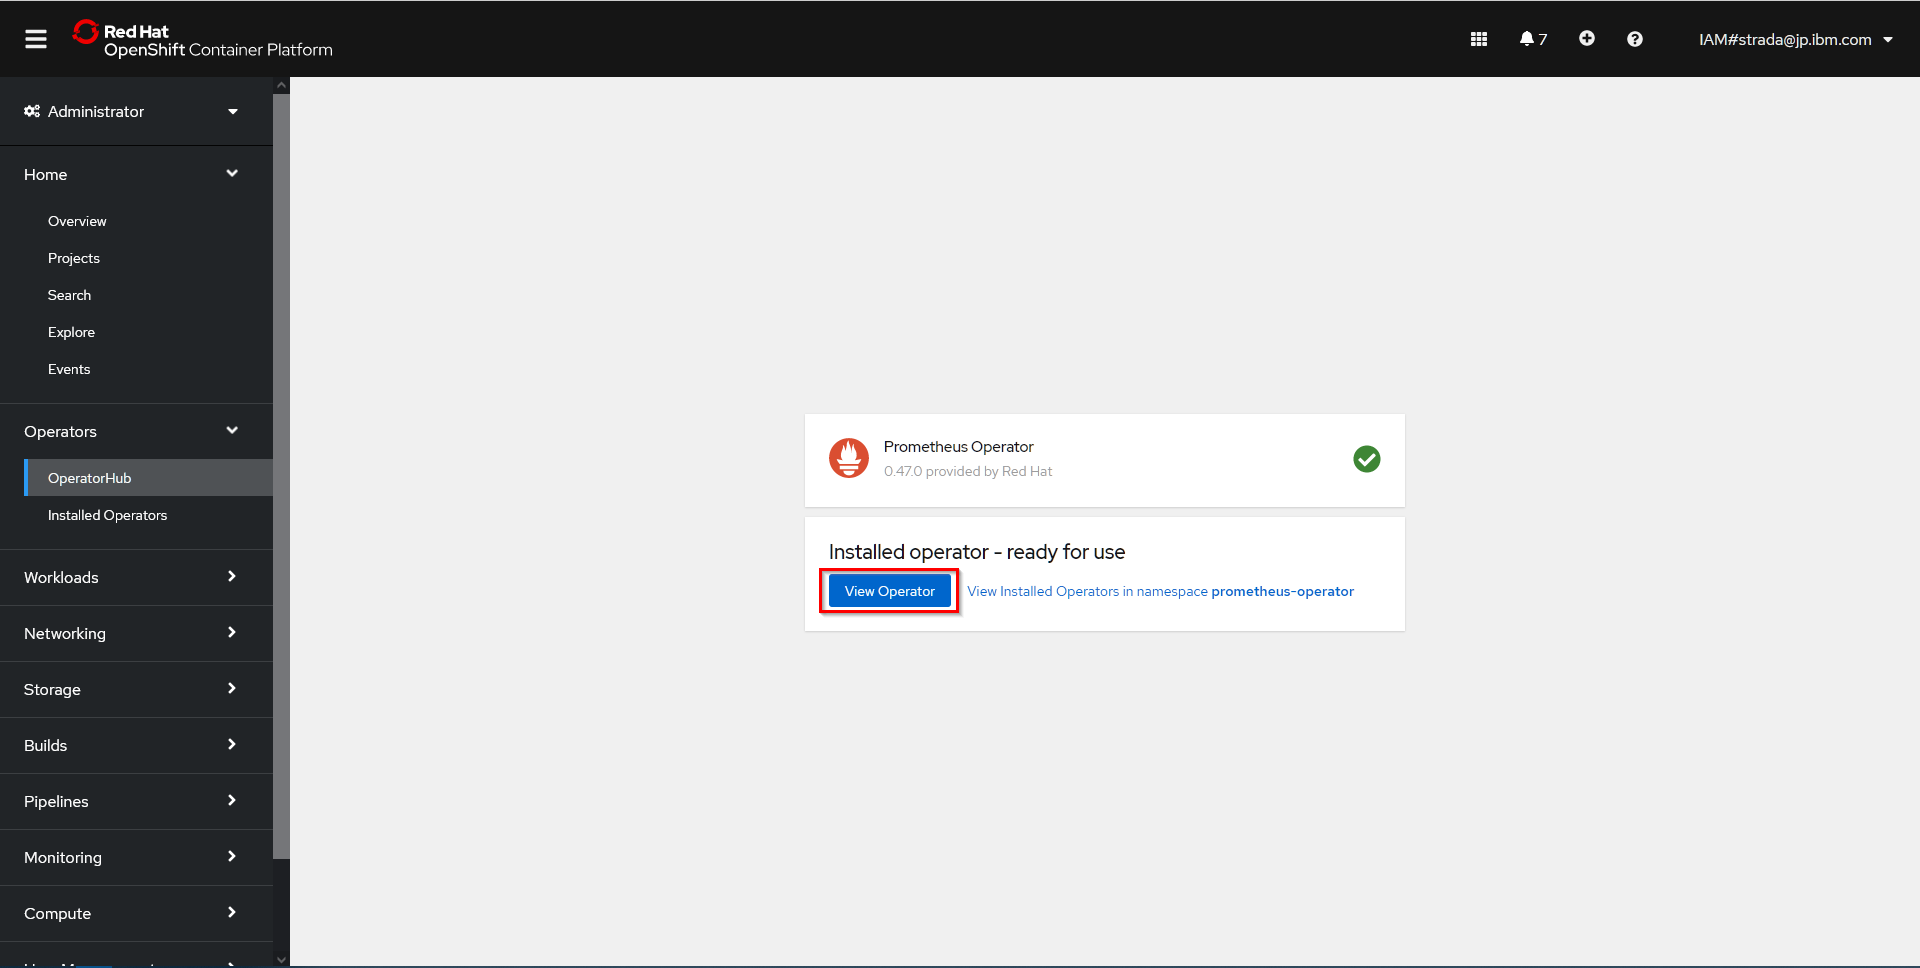
インストールが完了すると以下画面に切り替わるのでView Operatorをクリック
-
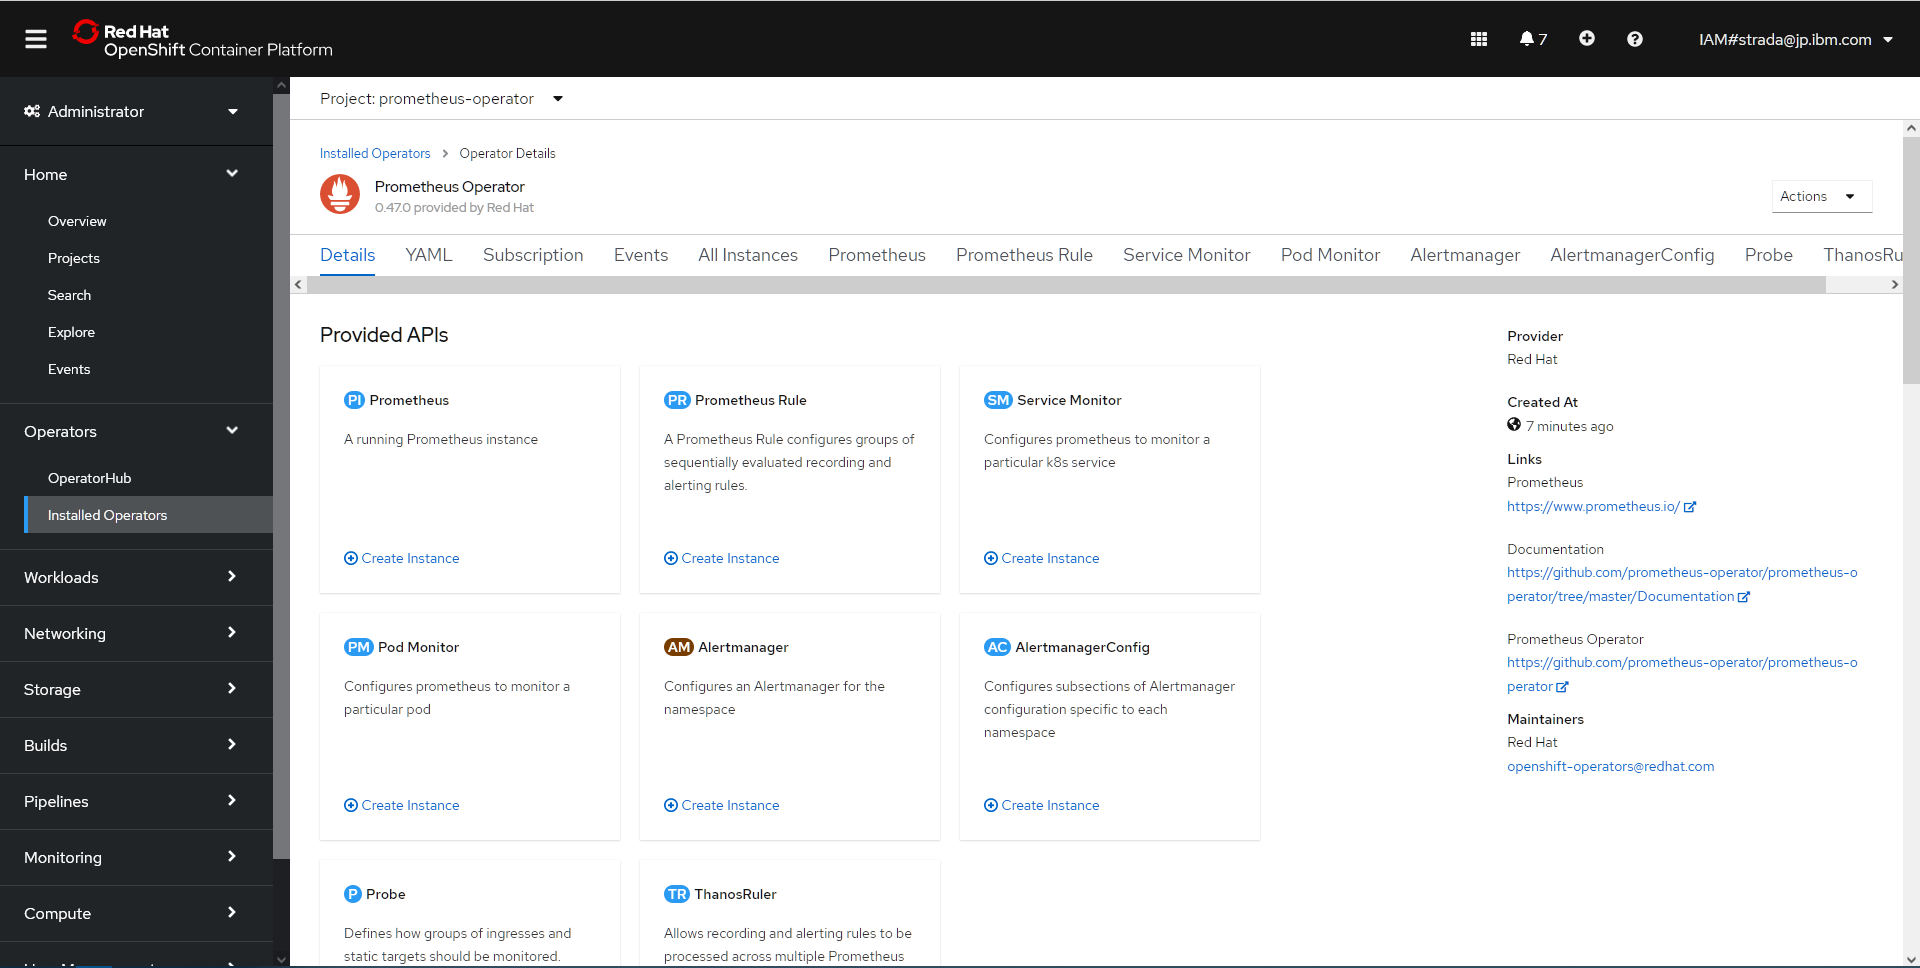
以下の画面が表示されればOK
必要なリソースの作成
以下のマニュアルを参考に必要なリソースの作成を行います。
Prometheus Operator用のサンプルマニフェストファイルを適用
- Prometheus OperatorのGitHubリポジトリをクローン
PS D:\git> git clone https://github.com/prometheus-operator/prometheus-operator.git
Cloning into 'prometheus-operator'...
remote: Enumerating objects: 62454, done.
remote: Counting objects: 100% (1248/1248), done.
remote: Compressing objects: 100% (581/581), done.
remote: Total 62454 (delta 816), reused 977 (delta 647), pack-reused 61206 eceiving objects: 100% (62454/62454), 74.74 MReceiving objects: 100% (62454/62454), 75.78 MiB | 5.68 MiB/s, done.

Resolving deltas: 100% (37198/37198), done.
PS D:\git>
- Prometheus Operator用のサンプルマニフェストファイルを適用
PS D:\git> oc apply -f .\prometheus-operator\bundle.yaml
customresourcedefinition.apiextensions.k8s.io/alertmanagerconfigs.monitoring.coreos.com created
Warning: oc apply should be used on resource created by either oc create --save-config or oc apply
customresourcedefinition.apiextensions.k8s.io/alertmanagers.monitoring.coreos.com configured
Warning: oc apply should be used on resource created by either oc create --save-config or oc apply
customresourcedefinition.apiextensions.k8s.io/podmonitors.monitoring.coreos.com configured
Warning: oc apply should be used on resource created by either oc create --save-config or oc apply
customresourcedefinition.apiextensions.k8s.io/probes.monitoring.coreos.com configured
Warning: oc apply should be used on resource created by either oc create --save-config or oc apply
customresourcedefinition.apiextensions.k8s.io/prometheuses.monitoring.coreos.com configured
Warning: oc apply should be used on resource created by either oc create --save-config or oc apply
customresourcedefinition.apiextensions.k8s.io/prometheusrules.monitoring.coreos.com configured
Warning: oc apply should be used on resource created by either oc create --save-config or oc apply
customresourcedefinition.apiextensions.k8s.io/servicemonitors.monitoring.coreos.com configured
Warning: oc apply should be used on resource created by either oc create --save-config or oc apply
customresourcedefinition.apiextensions.k8s.io/thanosrulers.monitoring.coreos.com configured
clusterrolebinding.rbac.authorization.k8s.io/prometheus-operator created
clusterrole.rbac.authorization.k8s.io/prometheus-operator created
deployment.apps/prometheus-operator created
serviceaccount/prometheus-operator created
service/prometheus-operator created
PS D:\git>
サンプルアプリケーション用のマニフェストファイルを作成
- Deployment、Service、ServiceMonitorのマニフェストを作成
apiVersion: apps/v1
kind: Deployment
metadata:
  name: example-app
spec:
  replicas: 3
  selector:
    matchLabels:
      app: example-app
  template:
    metadata:
      labels:
        app: example-app
    spec:
      containers:
      - name: example-app
        image: fabxc/instrumented_app
        ports:
        - name: web
          containerPort: 8080
kind: Service
apiVersion: v1
metadata:
  name: example-app
  labels:
    app: example-app
spec:
  selector:
    app: example-app
  ports:
  - name: web
    port: 8080
apiVersion: monitoring.coreos.com/v1
kind: ServiceMonitor
metadata:
  name: example-app
  labels:
    team: frontend
spec:
  selector:
    matchLabels:
      app: example-app
  endpoints:
  - port: web
- マニフェストファイルを適用
PS D:\git> oc apply -f .\example-app-deployment.yaml
deployment.apps/example-app created
PS D:\git> oc apply -f .\example-app-service.yaml
service/example-app created
PS D:\git> oc apply -f .\example-app-service-monitor.yaml
servicemonitor.monitoring.coreos.com/example-app created
PS D:\git>
Prometheus PodのためのRBACルールを有効化
- ServiceAccount、ClusterRole、ClusterRoleBindingのマニフェストファイルを作成
apiVersion: v1
kind: ServiceAccount
metadata:
  name: prometheus
apiVersion: rbac.authorization.k8s.io/v1beta1
kind: ClusterRole
metadata:
  name: prometheus
rules:
- apiGroups: [""]
  resources:
  - nodes
  - nodes/metrics
  - services
  - endpoints
  - pods
  verbs: ["get", "list", "watch"]
- apiGroups: [""]
  resources:
  - configmaps
  verbs: ["get"]
- apiGroups:
  - networking.k8s.io
  resources:
  - ingresses
  verbs: ["get", "list", "watch"]
- nonResourceURLs: ["/metrics"]
  verbs: ["get"]
apiVersion: rbac.authorization.k8s.io/v1beta1
kind: ClusterRoleBinding
metadata:
  name: prometheus
roleRef:
  apiGroup: rbac.authorization.k8s.io
  kind: ClusterRole
  name: prometheus
subjects:
- kind: ServiceAccount
  name: prometheus
  namespace: prometheus-operator
- マニフェストファイルを適用
PS D:\git> oc apply -f .\prometheus-serviceaccount.yaml
serviceaccount/prometheus created
PS D:\git> oc apply -f .\prometheus-clusterrole.yaml
W0713 15:13:03.597032   12648 warnings.go:67] rbac.authorization.k8s.io/v1beta1 ClusterRole is deprecated in v1.17+, unavailable in v1.22+; use rbac.authorization.k8s.io/v1 ClusterRole
W0713 15:13:03.898235   12648 warnings.go:67] rbac.authorization.k8s.io/v1beta1 ClusterRole is deprecated in v1.17+, unavailable in v1.22+; use rbac.authorization.k8s.io/v1 ClusterRole
clusterrole.rbac.authorization.k8s.io/prometheus created
PS D:\git> oc apply -f .\prometheus-clusterrolebinding.yaml
W0713 15:13:13.667507   18008 warnings.go:67] rbac.authorization.k8s.io/v1beta1 ClusterRoleBinding is deprecated in v1.17+, unavailable in v1.22+; use rbac.authorization.k8s.io/v1 ClusterRoleBinding
W0713 15:13:13.937245   18008 warnings.go:67] rbac.authorization.k8s.io/v1beta1 ClusterRoleBinding is deprecated in v1.17+, unavailable in v1.22+; use rbac.authorization.k8s.io/v1 ClusterRoleBinding
clusterrolebinding.rbac.authorization.k8s.io/prometheus created
PS D:\git>
ServiceRoleを含める
- PrometheusのインスタンスにServiceRoleを含めるためのマニフェストファイルを作成
apiVersion: monitoring.coreos.com/v1
kind: Prometheus
metadata:
  name: prometheus
spec:
  serviceAccountName: prometheus
  serviceMonitorSelector:
    matchLabels:
      team: frontend
  resources:
    requests:
      memory: 400Mi
  enableAdminAPI: false
- マニフェストファイルを適用
PS D:\git> oc apply -f .\prometheus-include-servicemonitor.yaml
prometheus.monitoring.coreos.com/prometheus created
PS D:\git>
Prometheusを公開
- Prometheus公開用のServiceのマニフェストファイルを作成
apiVersion: v1
kind: Service
metadata:
  name: prometheus
spec:
  type: NodePort
  ports:
  - name: web
    nodePort: 30900
    port: 9090
    protocol: TCP
    targetPort: web
  selector:
    prometheus: prometheus
- マニフェストファイルを適用
PS D:\git> oc apply -f .\prometheus-service.yaml
service/prometheus created
PS D:\git>
稼働確認
- Prometheus Serviceの9090ポートをlocalhostに転送
PS D:\git> oc port-forward svc/prometheus 9090:9090
Forwarding from 127.0.0.1:9090 -> 9090
Forwarding from [::1]:9090 -> 9090
- localhost:9090に接続し、Expressionに
http_requests_totalを入力しExecuteをクリック
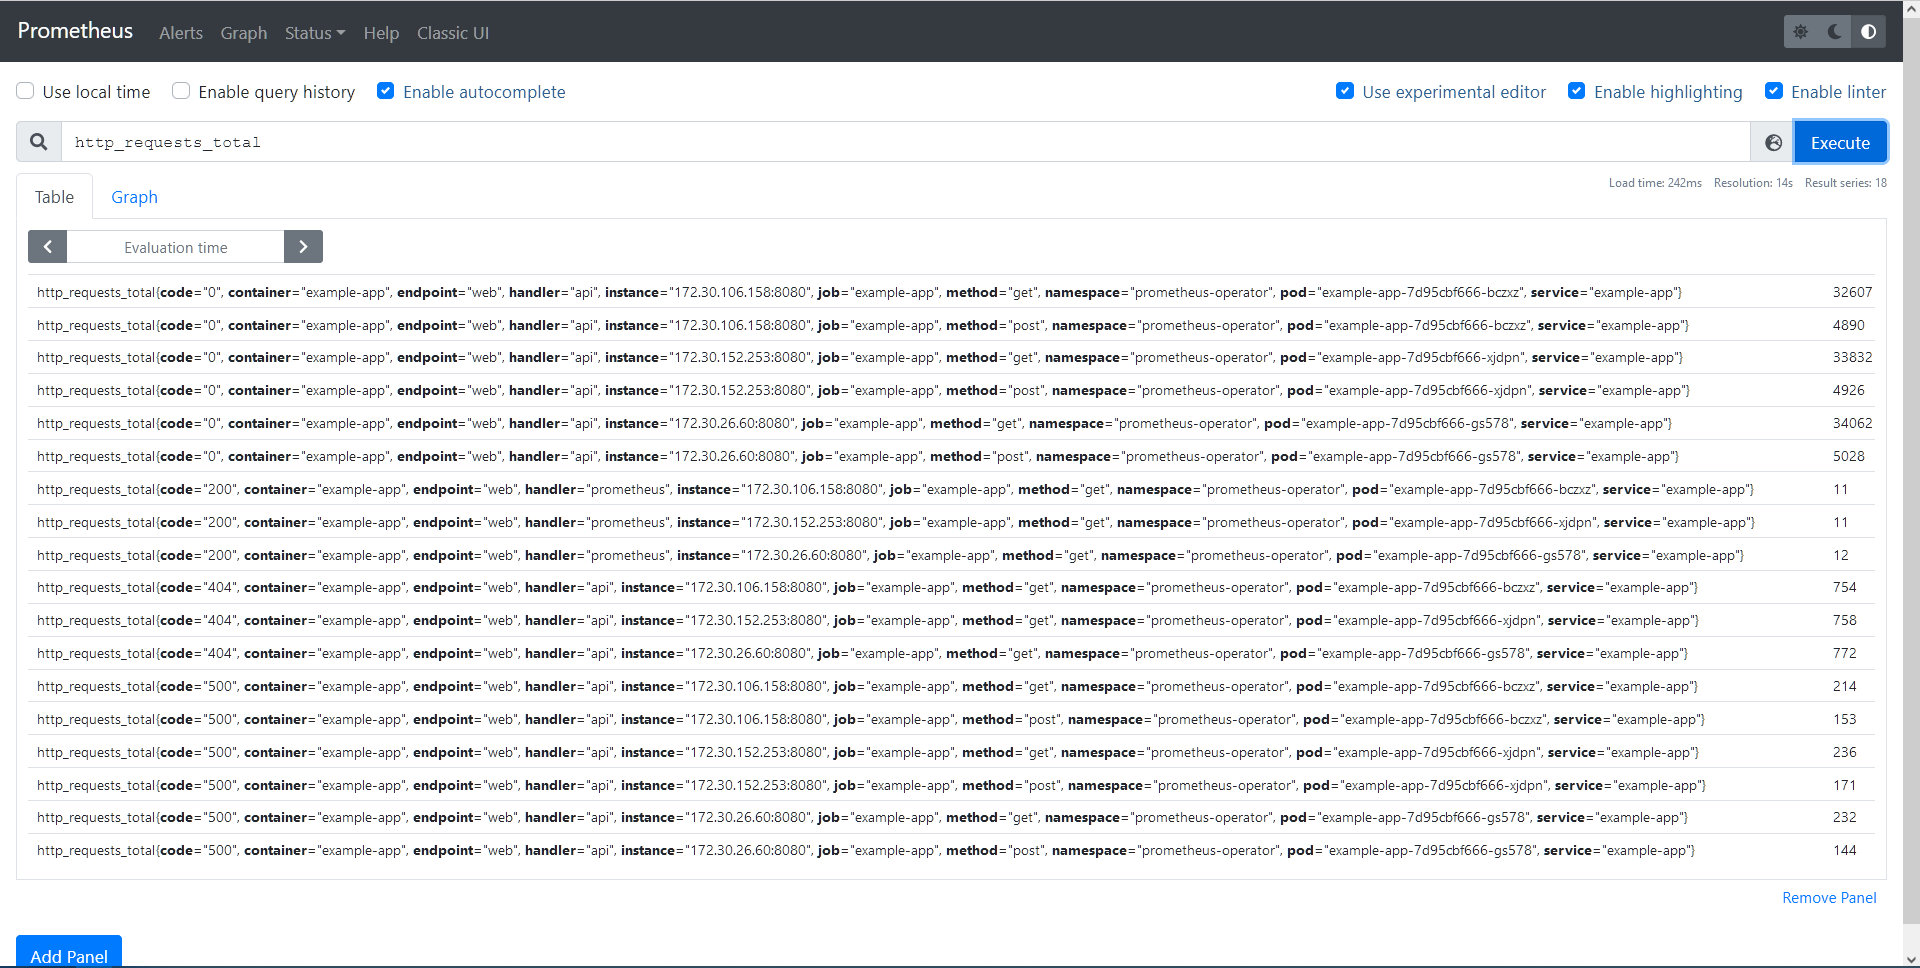
サンプルアプリケーションのメトリクスが取得できました。
まとめ
OpenShift v4.6でユーザー定義プロジェクトのモニタリング機能がリリースされていますが、従来どおりPrometheus Operatorを個別に導入してもユーザー定義プロジェクトのモニタリングが可能であることがわかりました。
ただし、ユーザー定義プロジェクトのモニタリング機能とPrometheus Operatorは同居することができないようなので、今回のようにPrometheusのメトリクスを使用する別のツールがHTTPの認証なしのエンドポイントを使用する場合など特殊な事情がない場合はユーザー定義プロジェクトのモニタリング機能を利用したほうが良さそうです。
参考にした情報源