背景
元々の目的はユーザー定義プロジェクトのモニタリングを使うことではなく、Argo RolloutsでProgressive Deliveryを実施する際の分析にPrometheusのメトリクスを使うユースケースを試したかったのが発端です。
そこで、OpenShift上でPrometheusのメトリクスを使う方法を色々と調査してみるとv4.6でユーザー定義プロジェクトのモニタリング機能がGAされており、これを使ってArgo Rolloutsと連携できないものかと考えました。
結論としてはArgo Rolloutsでは認証なしのHTTPエンドポイントしかサポートされていない(GitHub上で確認中)模様ですが、ユーザー定義プロジェクトのモニタリング機能は認証が必要なHTTPSエンドポイントで構成されるためそのまま利用できないということでした。
2022/08/26追記
その後の調査でArgo RolloutsのAnalysis Templateではユーザー定義プロジェクトのモニタリング機能のHTTPSエンドポイントに対して認証ありで接続することが可能であることがわかりました。
当初の目的ではユーザー定義プロジェクトのモニタリング機能は使用することができませんが、実際に構成してPrometheusのメトリクスを使う事はできることがわかったので、こちらの記事ではその構成手順をまとめています。
2022/08/26追記
この記事ではユーザー定義プロジェクトのモニタリング機能を構成してPrometheusのメトリクスを取得する構成手順のみを記載しています。
実施手順
ユーザー定義プロジェクトのモニタリングを有効化
まずはじめに、ユーザー定義プロジェクトのモニタリング機能を有効化する必要があります。
手順は以下のマニュアルを参考に実施します。
-
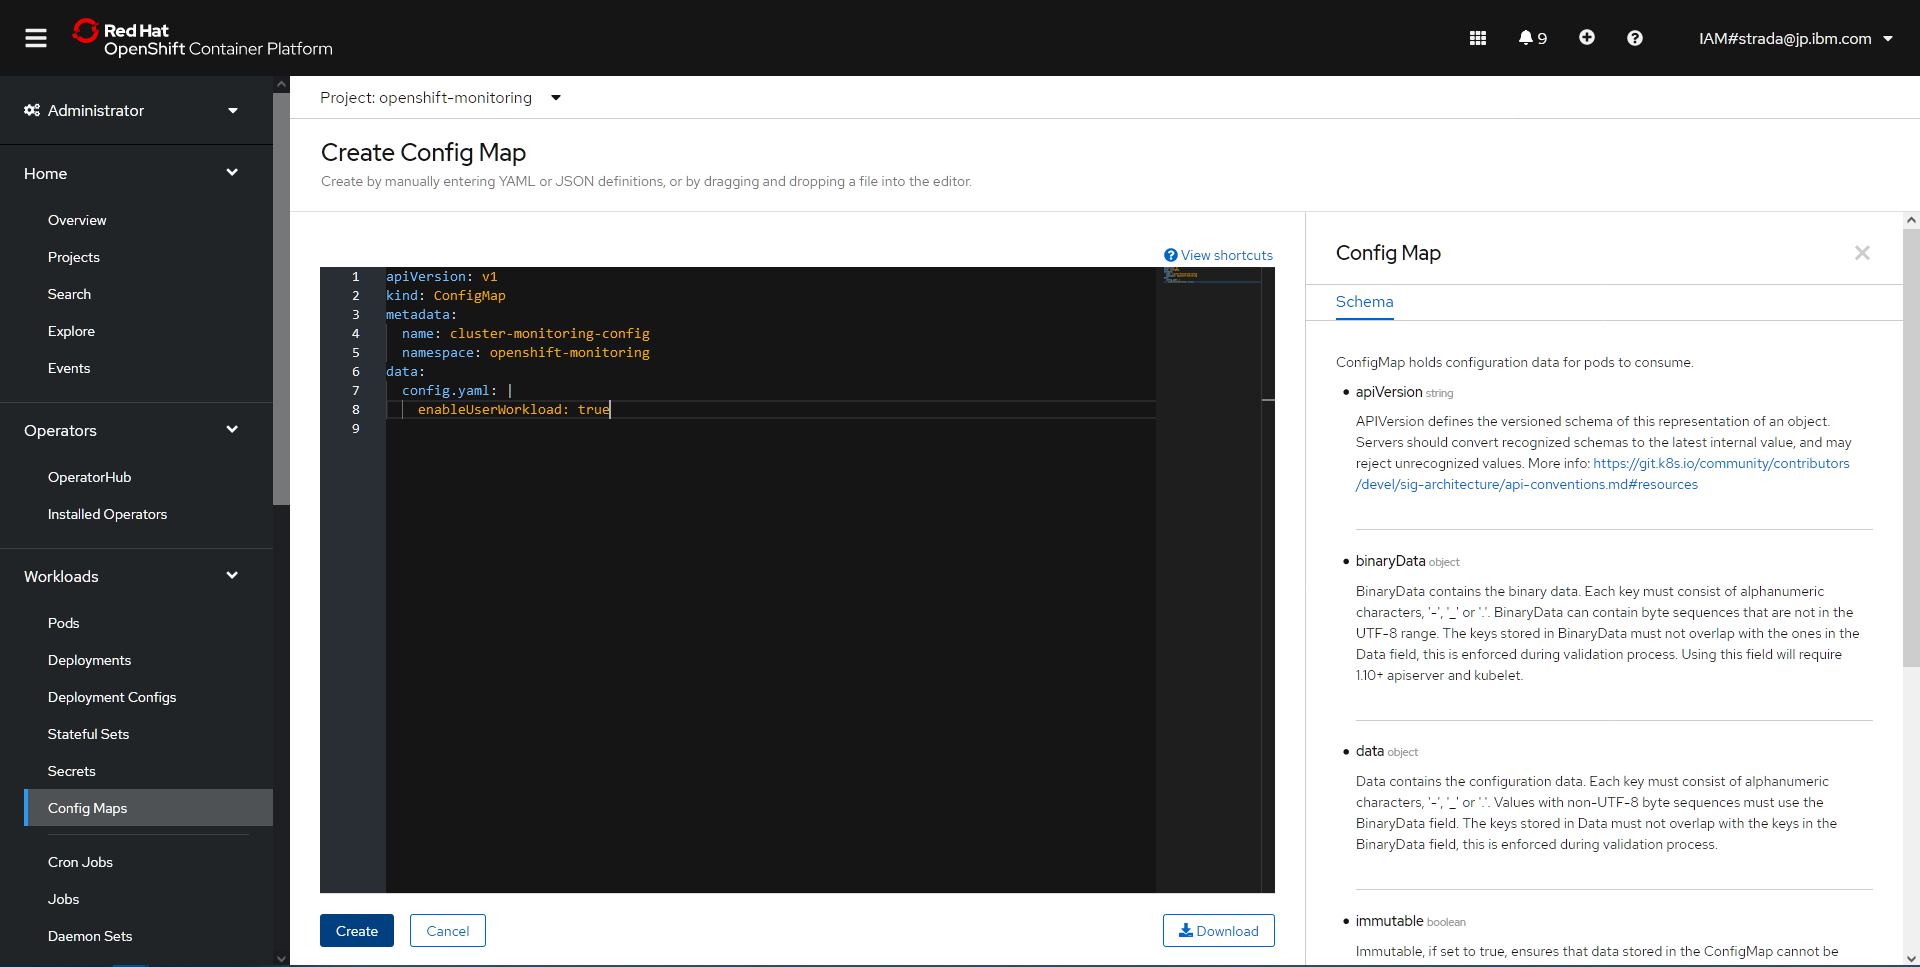
openshift-monitoring名前空間にcluster-monitoring-configという名前のConfigMapを作成
piVersion: v1
kind: ConfigMap
metadata:
  name: cluster-monitoring-config
  namespace: openshift-monitoring
data:
  config.yaml: |
    enableUserWorkload: true
-
prometheus-operator、prometheus-user-workloadおよびthanos-ruler-user-workloadPod がopenshift-user-workload-monitoringプロジェクトで実行中であることを確認
PS D:\git> oc -n openshift-user-workload-monitoring get pod
NAME                                   READY   STATUS    RESTARTS   AGE
prometheus-operator-5c9f57bbf7-mtwqj   2/2     Running   0          82s
prometheus-user-workload-0             4/4     Running   1          76s
prometheus-user-workload-1             4/4     Running   1          76s
thanos-ruler-user-workload-0           3/3     Running   0          75s
thanos-ruler-user-workload-1           3/3     Running   0          74s
PS D:\git>
ユーザー定義プロジェクトのメトリクスコレクションの設定
以下のマニュアルを参考にユーザー定義プロジェクトのメトリクスコレクションの設定を実施します。
検証用サンプルアプリケーション用のNamespace、Deployment、Serviceを定義するマニフェストファイルを作成
Namespaceは適宜変更してください
apiVersion: v1
kind: Namespace
metadata:
  name: kubota-test
---
apiVersion: apps/v1
kind: Deployment
metadata:
  labels:
    app: prometheus-example-app
  name: prometheus-example-app
  namespace: kubota-test
spec:
  replicas: 1
  selector:
    matchLabels:
      app: prometheus-example-app
  template:
    metadata:
      labels:
        app: prometheus-example-app
    spec:
      containers:
      - image: quay.io/brancz/prometheus-example-app:v0.2.0
        imagePullPolicy: IfNotPresent
        name: prometheus-example-app
---
apiVersion: v1
kind: Service
metadata:
  labels:
    app: prometheus-example-app
  name: prometheus-example-app
  namespace: kubota-test
spec:
  ports:
  - port: 8080
    protocol: TCP
    targetPort: 8080
    name: web
  selector:
    app: prometheus-example-app
  type: ClusterIP
- マニフェストファイルを適用
PS D:\git> oc apply -f .\prometheus-example-app.yaml
namespace/kubota-test created
deployment.apps/prometheus-example-app created
service/prometheus-example-app created
PS D:\git>
- 稼働確認
PS D:\git> oc get po -n kubota-test
NAME                                      READY   STATUS    RESTARTS   AGE
prometheus-example-app-79697bd67f-2lddr   1/1     Running   0          47s
PS D:\git>
サービスのモニター方法の指定
- 検証用サンプルアプリケーション用のServiceMonitorを定義するマニフェストファイルを作成
apiVersion: monitoring.coreos.com/v1
kind: ServiceMonitor
metadata:
  labels:
    k8s-app: prometheus-example-monitor
  name: prometheus-example-monitor
  namespace: kubota-test
spec:
  endpoints:
  - interval: 30s
    port: web
    scheme: http
  selector:
    matchLabels:
      app: prometheus-example-app
PS D:\git> oc apply -f .\example-app-service-monitor.yaml
servicemonitor.monitoring.coreos.com/prometheus-example-monitor created
- 稼働確認
PS D:\git> oc get servicemonitor -n kubota-test
NAME                         AGE
prometheus-example-monitor   61s
PS D:\git>
開発者としてのユーザー定義プロジェクトのメトリクスのクエリー
以下のマニュアルを参考にユーザー定義プロジェクトのメトリクスのクエリーを実施します。
- Developerパースペクティブの左メニューよりMonitoringを選択
- Projectで検証用プロジェクトを選択し、Metricsタブを選択
- Custome Queryを選択し、入力欄に
versionを指定し、Enterキーを押下し、クエリーを実行
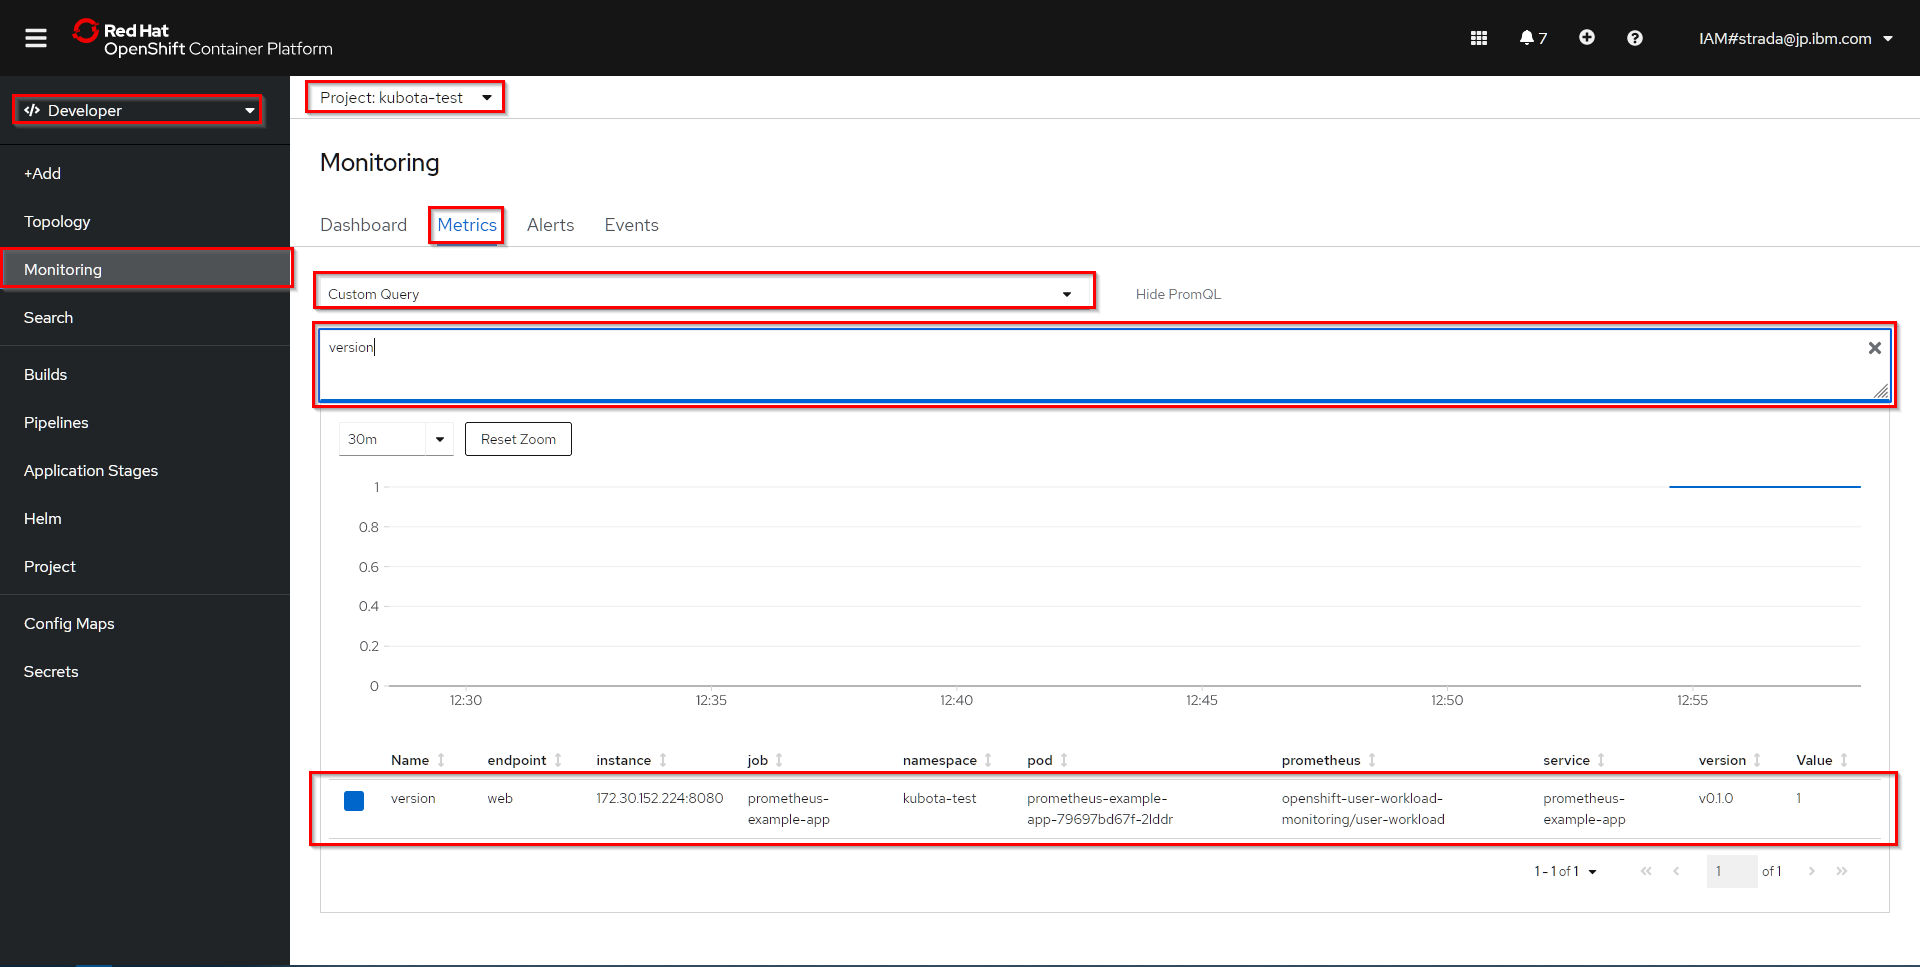
検証用アプリケーションで公開されているversionメトリクスが取得できました。
なお、アプリケーションで公開されているメトリクスは該当アプリケーションの/metricsにアクセスすることで確認できます。
- 検証用アプリケーションのServiceで公開されている8080ポートをlocalhostに転送
PS D:\git> oc port-forward svc/prometheus-example-app 8080:8080 -n kubota-test
Forwarding from 127.0.0.1:8080 -> 8080
Forwarding from [::1]:8080 -> 8080
- コマンドプロンプトからサンプルアプリケーションにアクセス
C:\Windows\System32>curl http://localhost:8080/
Hello from example application.
C:\Windows\System32>curl http://localhost:8080/err
- サンプルアプリケーションの/metricsにアクセス
C:\Windows\System32>curl http://localhost:8080/metrics
# HELP http_requests_total Count of all HTTP requests
# TYPE http_requests_total counter
http_requests_total{code="200",method="get"} 1
http_requests_total{code="404",method="get"} 1
# HELP version Version information about this binary
# TYPE version gauge
version{version="v0.1.0"} 1
サンプルアプリケーションにアクセスしたことでhttp_requests_totalのメトリクスも取得できました。
サードパーティのモニタリングUI(Thanos Querier UI)からのメトリクスの取得
また、以下のマニュアルに記載されている通りユーザー定義プロジェクトのメトリクスに関してはOpenShiftのコンソールだけではなく、サードパーティのモニタリングUIからも確認することができます。
Prometheus UI ではOpenShiftを構成するコンポーネントに関するメトリクスを取得することができます。
Thanos Querier UI では今回の記事で対象としていたユーザー定義プロジェクトのメトリクスを取得することができます。
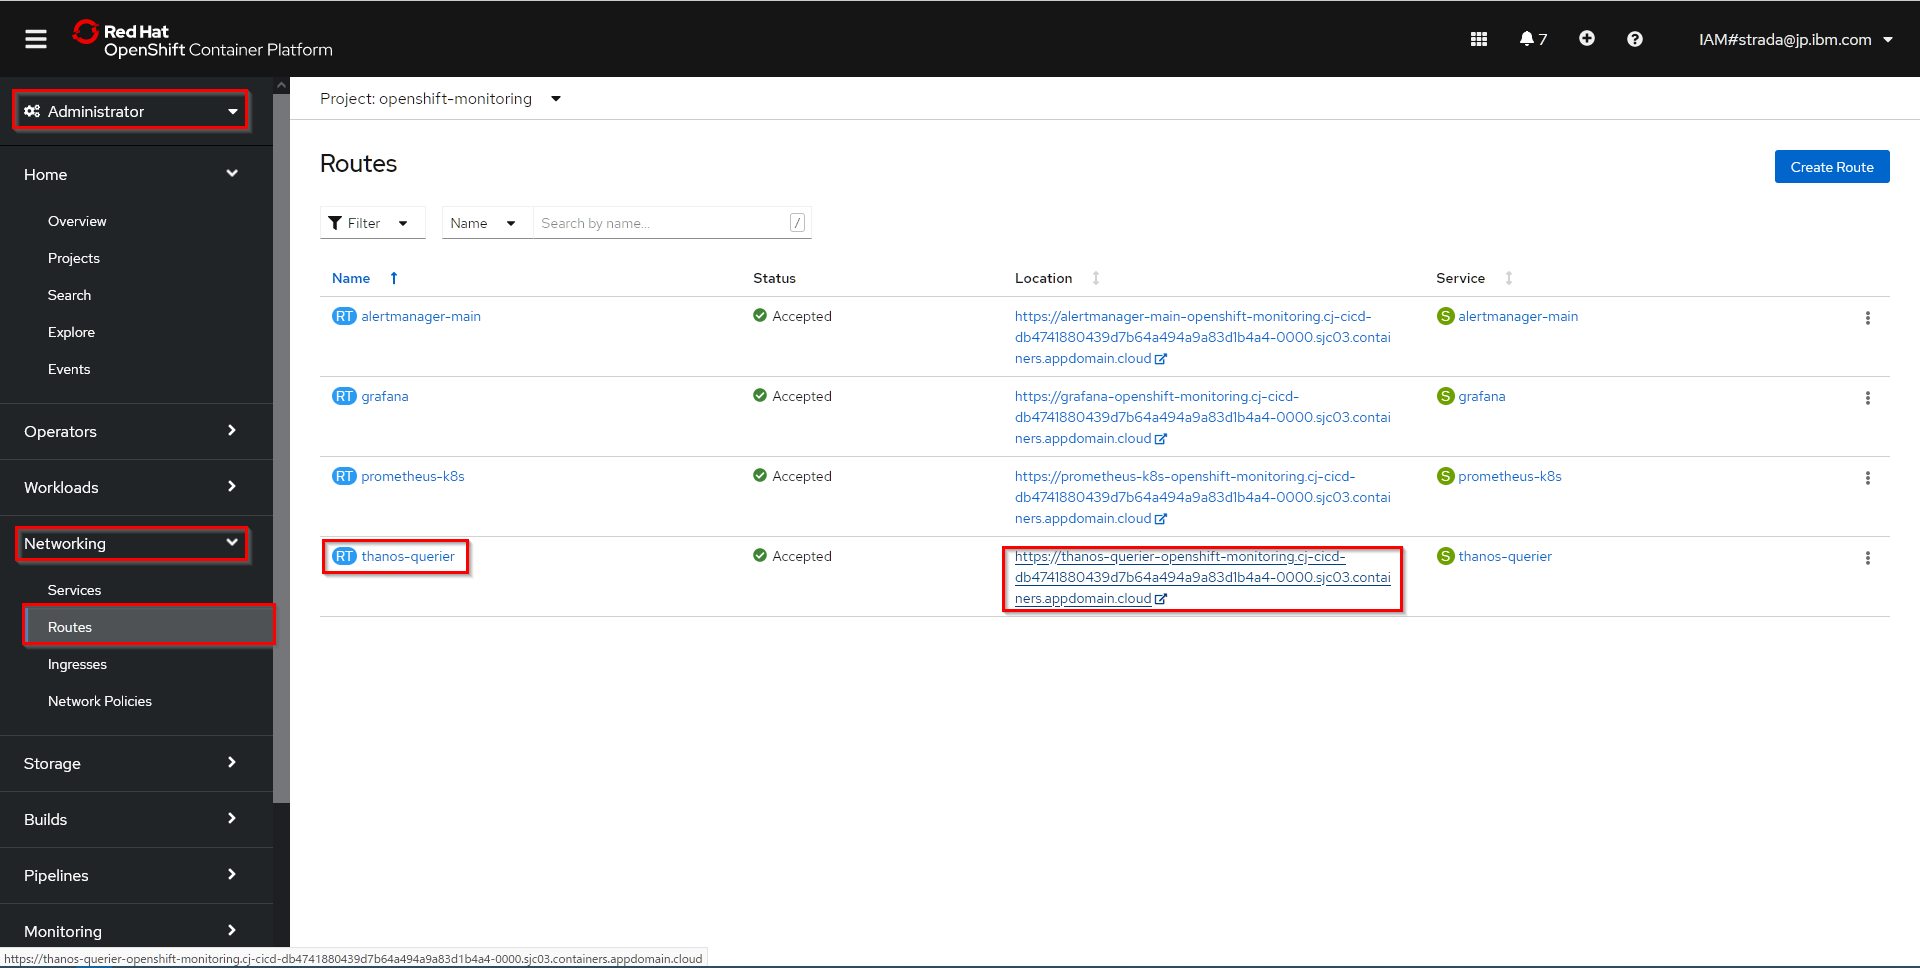
- Administratorパースペクティブを選択し、左メニューよりNetworking->Routeを選択
- Route一覧より
thanos-querierのLocationを選択
- Expressionに
versionと入力し、Executeをクリック
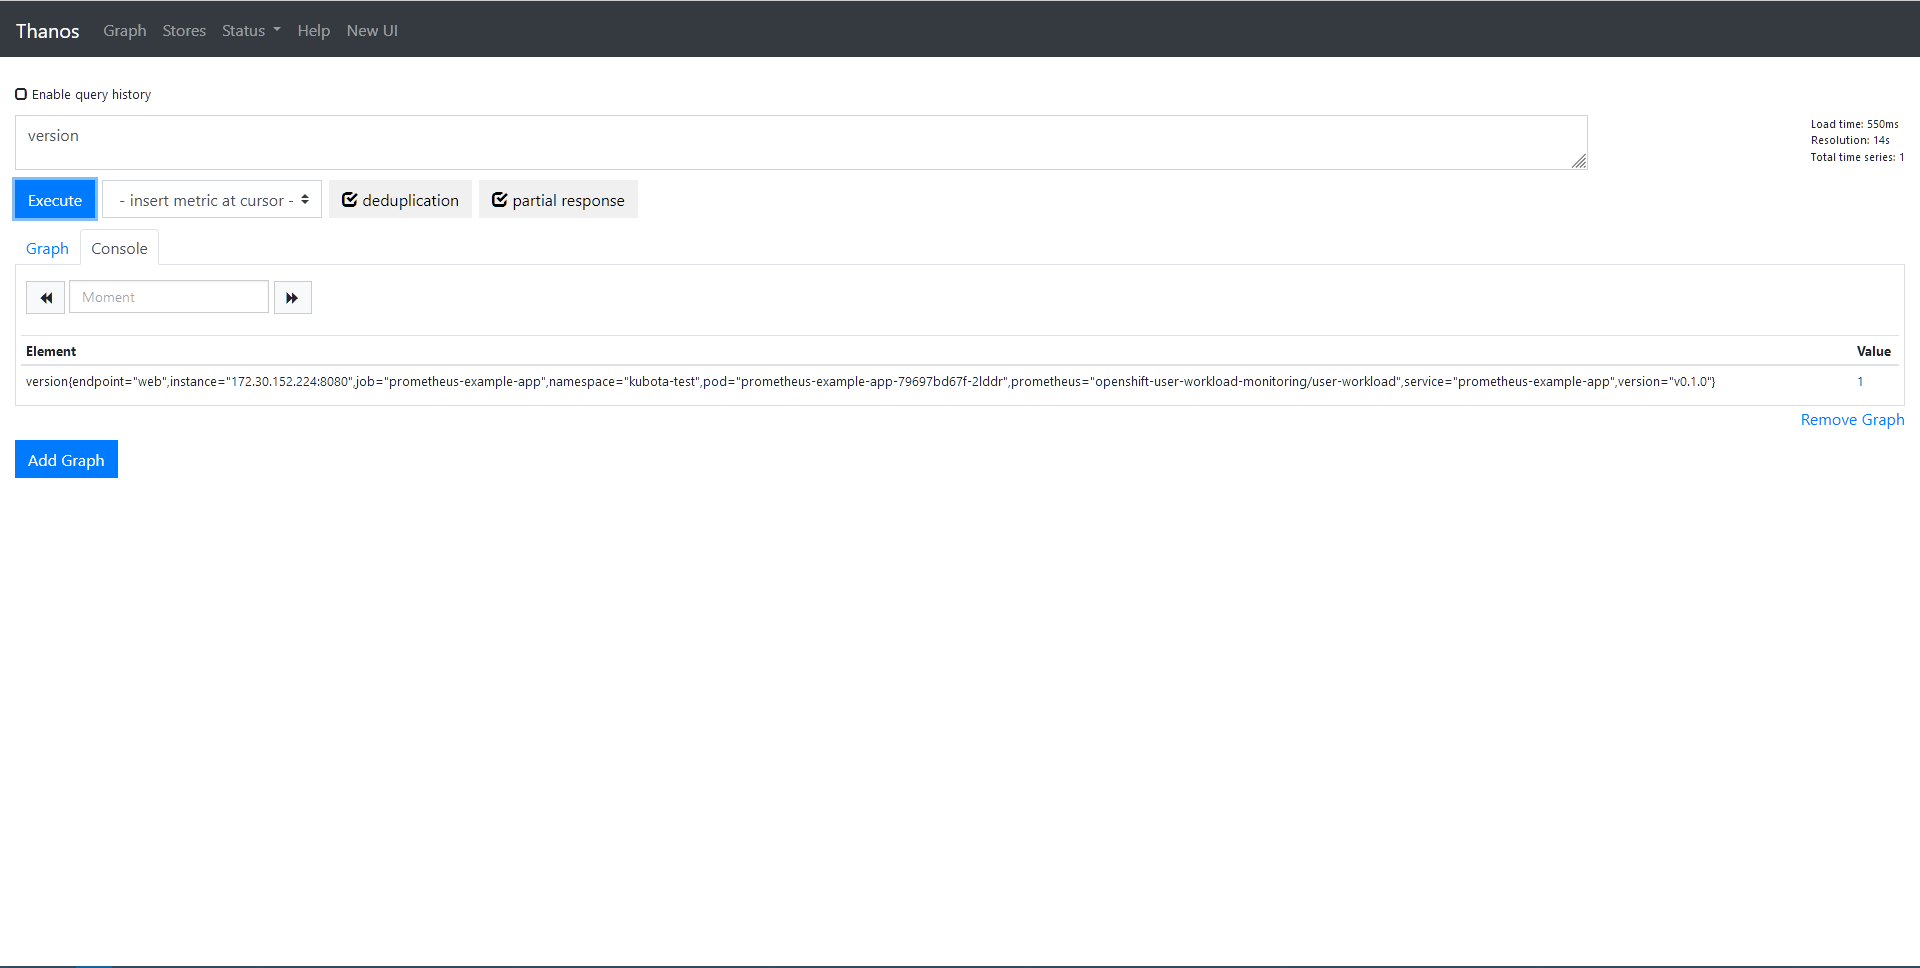
OpenShiftコンソールと同様の結果を取得することができました。
CLIからのユーザー定義プロジェクトのメトリクスのクエリー
また、以下のナレッジベースで公開されている手順でCLIからユーザー定義プロジェクトのメトリクスをクエリーすることが可能です。
sh-4.4$ curl -X GET -k 'https://thanos-querier-openshift-monitoring.cj-cicd-db4741880439d7b64a494a9a83d1b4a4-0000.sjc03.containers.appdomain.cloud/api/v1/query?query=version' -H "Authorization: Bearer xxxxxxxx"
{"status":"success","data":{"resultType":"vector","result":[{"metric":{"__name__":"version","endpoint":"web","instance":"172.30.152.224:8080","job":"prometheus-example-app","namespace":"kubota-test","pod":"prometheus-example-app-79697bd67f-2lddr","prometheus":"openshift-user-workload-monitoring/user-workload","service":"prometheus-example-app","version":"v0.1.0"},"value":[1626151306.707,"1"]}]}}
Windows 10から直接実行できないのでopenshift-user-workload-monitoringプロジェクトのthanos-ruler-user-workload-0PodのTerminalから実行した結果となりますが、OpenShiftコンソールおよびThanos Querier UI で取得したのと同様のメトリクスを取得することができます。
まとめ
OpenShift v4.6でGAされたユーザー定義プロジェクトのモニタリングを有効化することで、デフォルトでインストールされているOpenShift Operatorの機能を利用しつつ、OpenShiftを構成するコンポーネントだけでなく、ユーザー定義プロジェクトのメトリクスを取得することが出来ることがわかりました。
また、取得する方法としてはOpenShiftコンソール、Thanos Querier UI 、CLIの3通りの取得方法があることもわかりました。
なお、冒頭で記載した通り、ユーザー定義プロジェクトのメトリクスをHTTPエンドポイントで認証無しで公開することはできません。
OpenShiftのサポートケースを起票して確認しましたが、現在HTTPSで認証ありで公開されているエンドポイントをHTTPで認証無しで構成することはサポートしていないと回答頂きました。
どうしても、HTTPの認証無しでアクセスできるようにしたい場合は、個別にプロキシー用のPodを用意してくださいとのことでした。
今回はArgo RolloutsとPrometheusの連携を試したいだけなので、個別のプロキシーを用意するよりも、従来から使用されているPrometheus Operatorをユーザー定義プロジェクトのメトリクス用に別途インストールするほうが簡単そうなので、次回の記事ではPrometheus Operatorを導入してメトリクスを収集する手順を試してみたいと思います。
2022/08/26追記
冒頭にも記載したとおりArgo RolloutsのAnalysis Templateではユーザー定義プロジェクトのモニタリング機能のHTTPSエンドポイントに対して認証ありで接続することが可能であることがわかりました。CLIからのユーザー定義プロジェクトのメトリクスのクエリーで前述した際にThanos Querierのエンドポイントに対してAuthorizationヘッダーで認証Tokenを送信してHTTPS認証ありでアクセスをしていますので、Argo RolloutsのAnalysis TemplateでもAuthorizationヘッダーの設定を追加することで、Argo Rolloutsでも認証ありのエンドポイントからメトリクスのクエリーが取得できます。こちらは実際に同僚が試行して成功しているので間違いありません。
Argo RolloutsのAnalysis Templateの構成は以下を参考にしてください。
https://argo-rollouts.readthedocs.io/en/latest/features/analysis/#analysis-template-arguments
参考にした情報