5
1

Delete article

Deleted articles cannot be recovered.

Draft of this article would be also deleted.

Are you sure you want to delete this article?

More than 1 year has passed since last update.

データ周期を集約する(SPSS Modeler データ加工逆引き5-13)

Last updated at Posted at 2023-03-02

データ周期の集約

image.png

1.想定される利用目的

・センサーデータの周期の統一
・時系列データのデータ量削減

2.サンプルストリームのダウンロード

サンプルストリーム
https://github.com/hkwd/spsssample/raw/master/230302%E3%83%87%E3%83%BC%E3%82%BF%E5%91%A8%E6%9C%9F%E3%81%AE%E9%9B%86%E7%B4%84/%E3%83%87%E3%83%BC%E3%82%BF%E5%91%A8%E6%9C%9F%E3%81%AE%E9%9B%86%E7%B4%84.str

サンプルデータ
https://raw.githubusercontent.com/hkwd/spsssample/master/230302%E3%83%87%E3%83%BC%E3%82%BF%E5%91%A8%E6%9C%9F%E3%81%AE%E9%9B%86%E7%B4%84/Sensor300.csv

3.サンプルストリームの説明

image.png

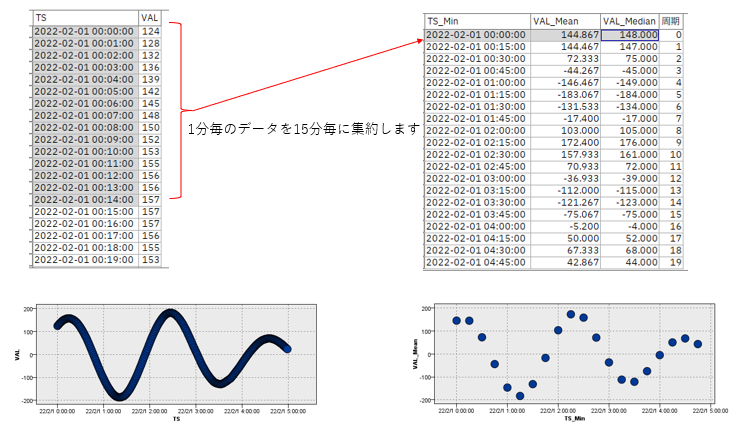
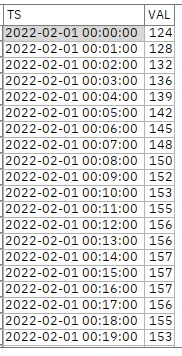
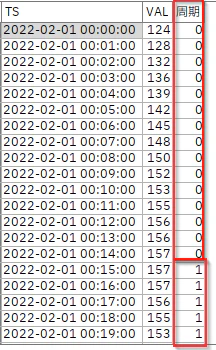
入力するデータは以下の通りです。1分おきにセンサーデータが発生しています。
image.png

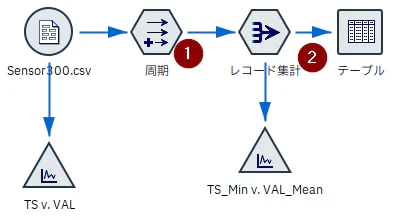
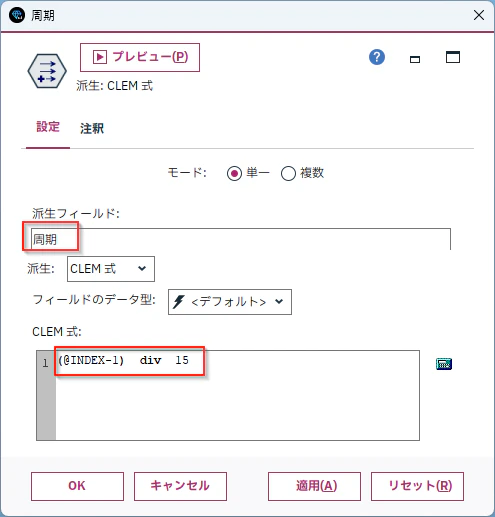
①.[フィールド作成]ノードを編集します。取り出したい周期でグループ化するインデックスを作ります。
CLEM式に「(@INDEX-1) div 15」を入力します。
ここでは15回で1サイクルの周期にしています。divで割る値で周期は調整可能です。例えば(@INDEX-1) div 10にすれば10分おきの周期にできます。

image.png

以下のように15レコード毎にインデックスが作られます。
image.png

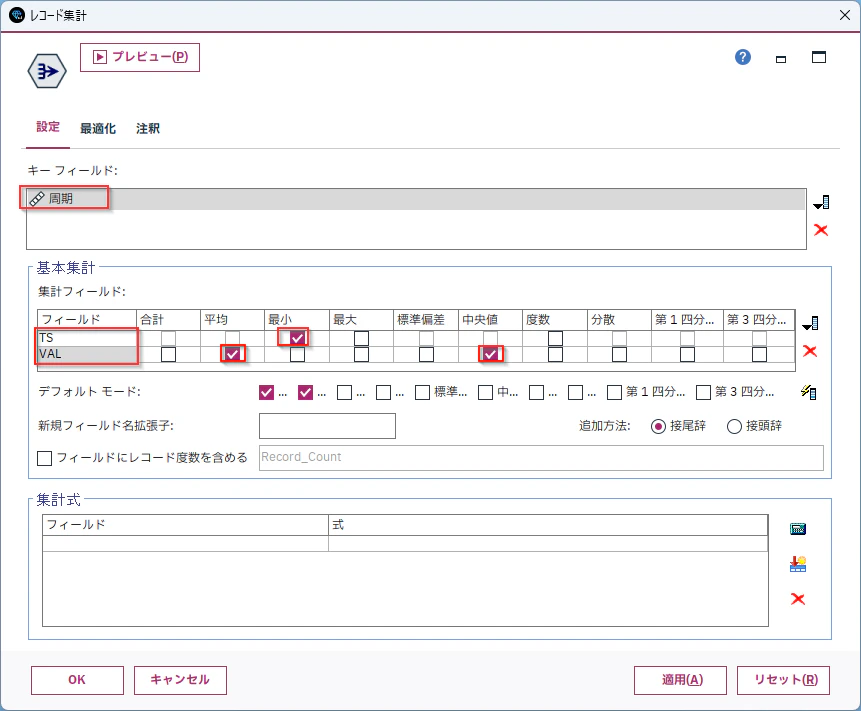
②.[レコード集計]ノードで[キーフィールド]を[周期]に設定します。そして、[TS]の[最小値]と[VAL]の[平均]を求めます。[平均]ではなく[中央値]で代表値を作ることもできます。
image.png

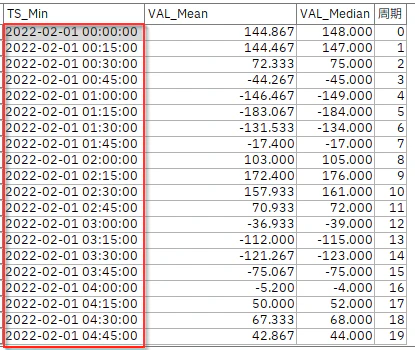
[テーブル]を実行します。15分周期でデータを平均や中央値で集約することができました。
image.png

TIPS

逆にデータの周期をより細かいデータに統一したいこともあると思います。その場合には線形補間をすることが可能です。

時系列の欠損値を線形補間する(SPSS Modeler データ加工逆引き5-9)

4.参考情報

線形補間について解説した記事

SPSS Modeler ノードリファレンス目次

SPSS Modeler 逆引きストリーム集(データ加工)

5
1
0

Register as a new user and use Qiita more conveniently

  1. You get articles that match your needs
  2. You can efficiently read back useful information
  3. You can use dark theme
What you can do with signing up
5
1

Delete article

Deleted articles cannot be recovered.

Draft of this article would be also deleted.

Are you sure you want to delete this article?