#Datadogを導入する
- とりあえず、サーバーのパフォーマンスを監視したい人は、Datadogオススメです。
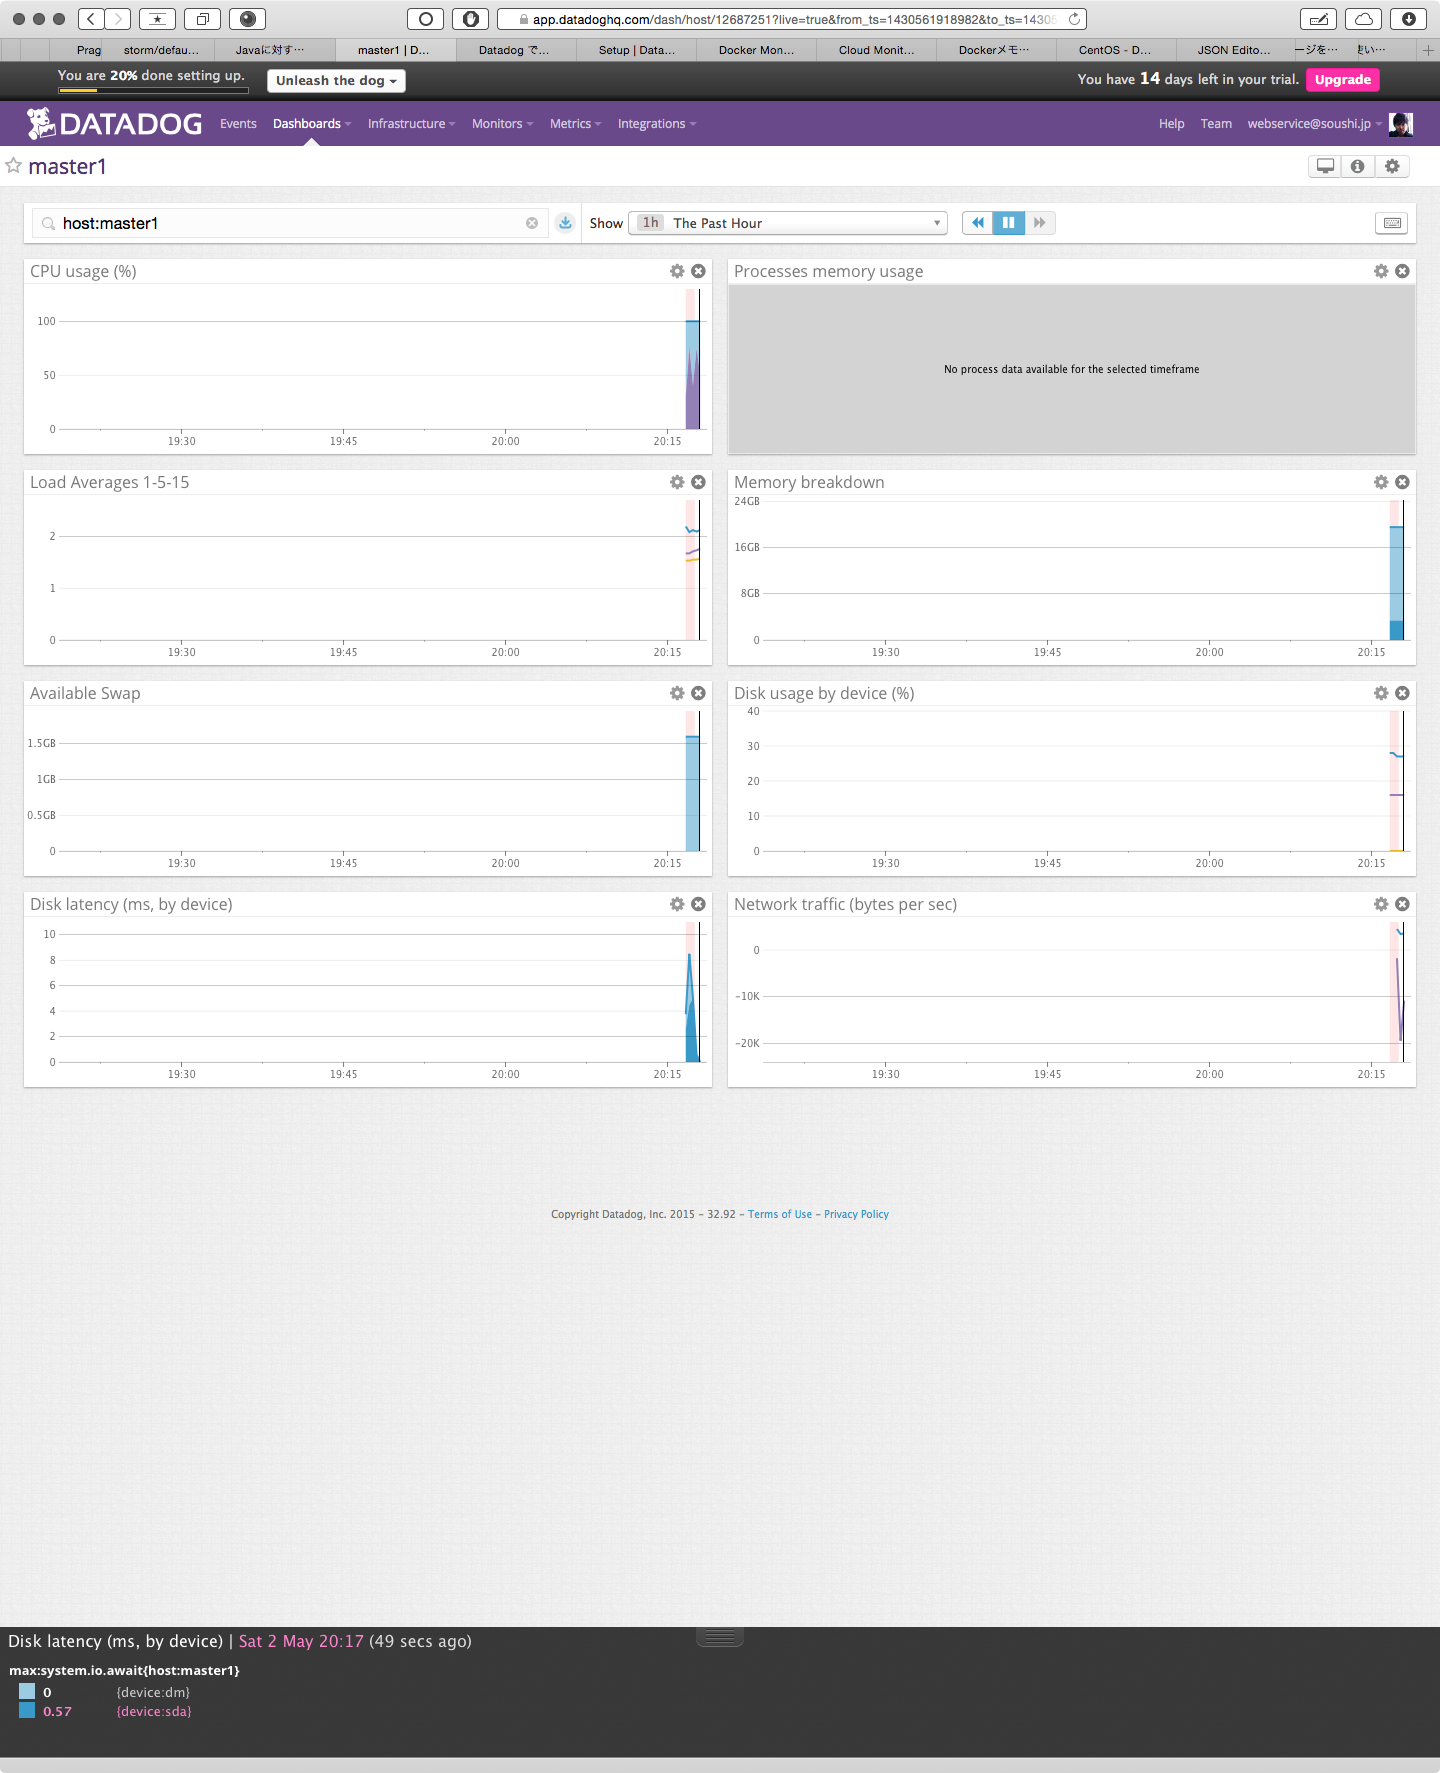
- 色々な解析等もできます。(CPU負荷率の高い順とか、いろいろ)
##1 下記コマンドを実行するだけです。
参考https://app.datadoghq.com/account/settings#agent/centos
DD_API_KEY=<あなたのAPIキー> bash -c "$(curl -L https://raw.githubusercontent.com/DataDog/dd-agent/master/packaging/datadog-agent/source/install_agent.sh)"
##2 操作
- 起動
sudo /etc/init.d/datadog-agent start
- 停止
sudo /etc/init.d/datadog-agent stop
- 再起動または設定ファイルのリロード
sudo /etc/init.d/datadog-agent restart
- エージェントの起動状態確認
sudo /etc/init.d/datadog-agent status
- エージェントの各種状態を取得
sudo /etc/init.d/datadog-agent info
- エージェントの各種状態を取得(詳細版)
sudo /etc/init.d/datadog-agent info -v
##3 フォルダ構造
###/etc/dd-agent/conf.d/ディレクトリに、設定ファイルが入っています。
cat /etc/dd-agent/conf.d/
- 沢山の設定ファイル(.yaml)サンプルが存在
activemq_58.yaml.example      directory.yaml.example        hdfs.yaml.example             marathon.yaml.example         pgbouncer.yaml.example        snmp.yaml.example             tomcat.yaml.example
activemq_xml.yaml.example     docker.yaml.example           http_check.yaml.example       mcache.yaml.example           php_fpm.yaml.example          solr.yaml.example             varnish.yaml.example
activemq.yaml.example         elastic.yaml.example          iis.yaml.example              mesos.yaml.example            postfix.yaml.example          sqlserver.yaml.example        vsphere.yaml.example
apache.yaml.example           etcd.yaml.example             jenkins.yaml.example          mongo.yaml.example            postgres.yaml.example         ssh_check.yaml.example        win32_event_log.yaml.example
btrfs.yaml.example            fluentd.yaml.example          jmx.yaml.example              mysql.yaml.example            process.yaml.example          supervisord.yaml.example      windows_service.yaml.example
cacti.yaml.example            gearmand.yaml.example         kafka_consumer.yaml.example   nagios.yaml.example           rabbitmq.yaml.example         system_core.yaml.example      wmi_check.yaml.example
cassandra.yaml.example        go_expvar.yaml.example        kafka.yaml.example            network.yaml.default          redisdb.yaml.example          tcp_check.yaml.example        zk.yaml.example
couchbase.yaml.example        gunicorn.yaml.example         kyototycoon.yaml.example      nginx.yaml.example            riakcs.yaml.example           teamcity.yaml.example
couch.yaml.example            haproxy.yaml.example          lighttpd.yaml.example         ntp.yaml.default              riak.yaml.example             tokumx.yaml.example