Stackdriverでエラーログ通知を設定してみたものの、ヒットした行がSlack通知に表示されないため使いづらかった。
Datadog Logsの通知ならエラーログがSlack通知に表示できる。そこで、Stackdriver Logging に入ってきているログを Datadog Logs に転送して、エラー通知をしてみた記録
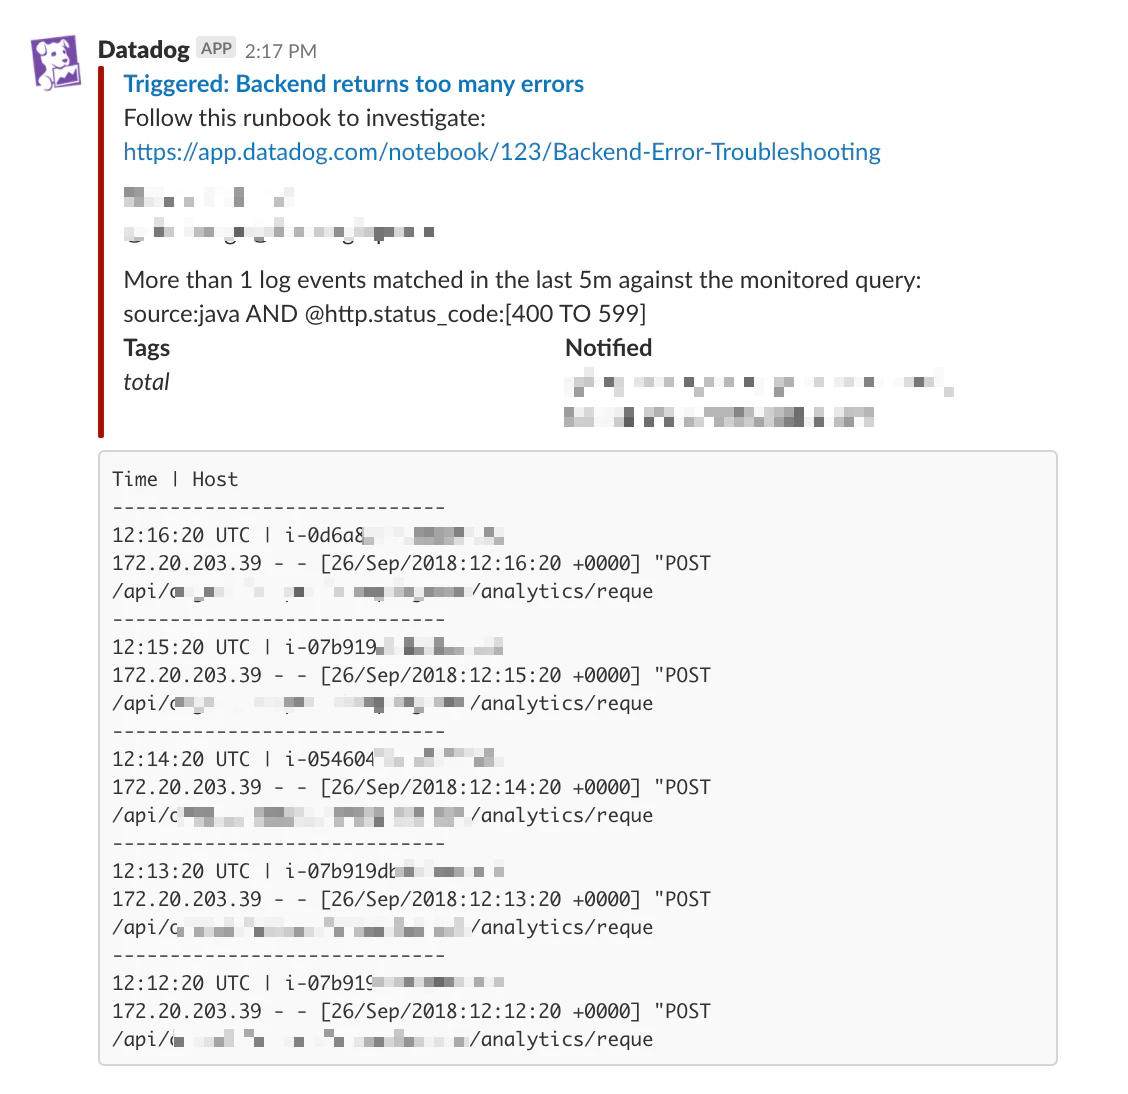
cite: https://docs.datadoghq.com/monitors/monitor_types/log/#notifications-and-log-samples
Stackdriver Logging の Datadog Logs への転送
See https://docs.datadoghq.com/integrations/google_cloud_platform/#log-collection
- Create a new Cloud Pub/Sub.
- Validate your Datadog domain so that logs can be pushed from GCP to Datadog.
- Setup the Pub/Sub to forward logs to Datadog.
- Configure exports from Stackdriver logs to the Pub/Sub.
このうち 2. のステップの Cloud Search Console と Domain Verification の設定は手動でやらざるを得なかったので、 https://docs.datadoghq.com/integrations/google_cloud_platform/#validate-the-datadog-domain のドキュメントを参考に手動で実施する。
1, 3, 4 の Pub/Sub および Cloud Logging Sink の設定は Terraform 化できたので、.tf ファイルを示しておく。例えば k8s_pod のログを Datadog Logs に転送する設定は以下のようになる。
resource "google_pubsub_topic" "export-logs-to-datadog" {
  name = "export-logs-to-datadog"
}

resource "google_pubsub_subscription" "export-logs-to-datadog" {
  name  = "export-logs-to-datadog"
  topic = "${google_pubsub_topic.export-logs-to-datadog.name}"

  push_config {
    # NOTE: Need to do domain verification. See https://docs.datadoghq.com/integrations/google_cloud_platform/#validate-the-datadog-domain
    push_endpoint = "https://gcp-intake.logs.datadoghq.com/v1/input/${var.datadog_api_key}"
  }

  depends_on = ["google_pubsub_topic.export-logs-to-datadog"]
}

# Tips: If you have a configuration error, the web console https://console.cloud.google.com/logs/exports?project=<project_id>
# will show a warning after waiting 10 sec at there.
resource "google_logging_project_sink" "export-logs-to-datadog" {
  name        = "export-logs-to-datadog"
  destination = "pubsub.googleapis.com/projects/${var.project}/topics/${google_pubsub_topic.export-logs-to-datadog.name}"

  # Add more resource.type with OR if you want to get more
  filter                 = "resource.type=\"k8s_pod\""
  unique_writer_identity = true

  depends_on = ["google_pubsub_topic.export-logs-to-datadog"]
}

resource "google_pubsub_topic_iam_member" "export-logs-to-datadog" {
  topic  = "${google_pubsub_topic.export-logs-to-datadog.name}"
  role   = "roles/pubsub.publisher"
  member = "${google_logging_project_sink.export-logs-to-datadog.writer_identity}"

  depends_on = [
    "google_pubsub_topic.export-logs-to-datadog",
    "google_logging_project_sink.export-logs-to-datadog",
  ]
}
https://console.cloud.google.com/logs/exports?project=<your_project_id> から Stackdriver Logging Sink の画面を開いて 10 sec ぐらい待って warning が出なければ成功しているはず。
Datadog > Logs > Search の画面から Source を gcp.k8s.pod にしてログが入ってきていることが確認できればOK。
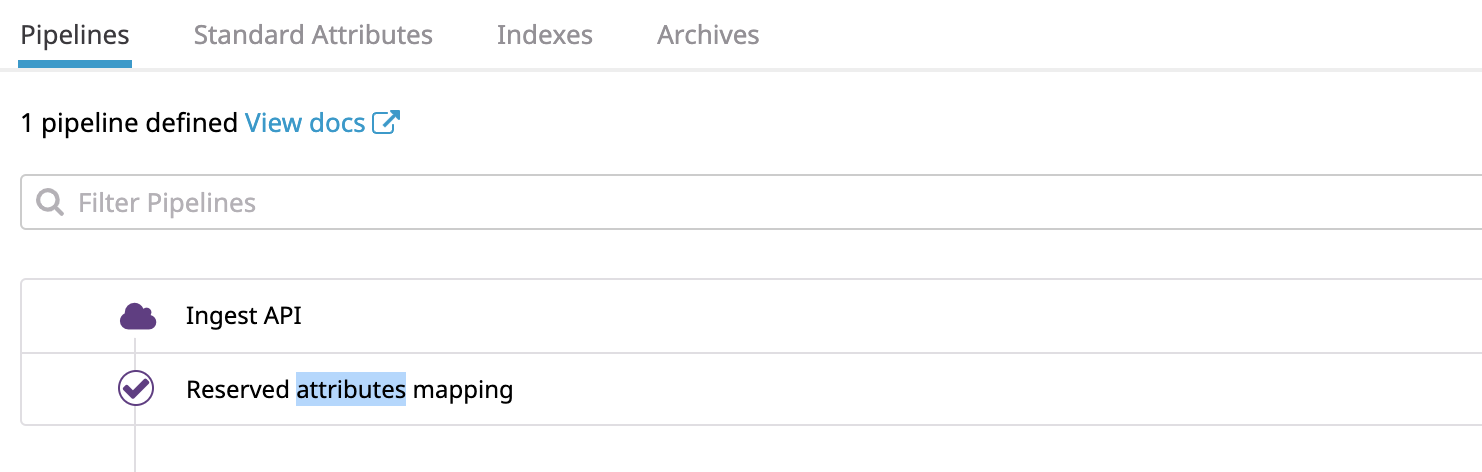
Datadog Logs の Pipeline の設定
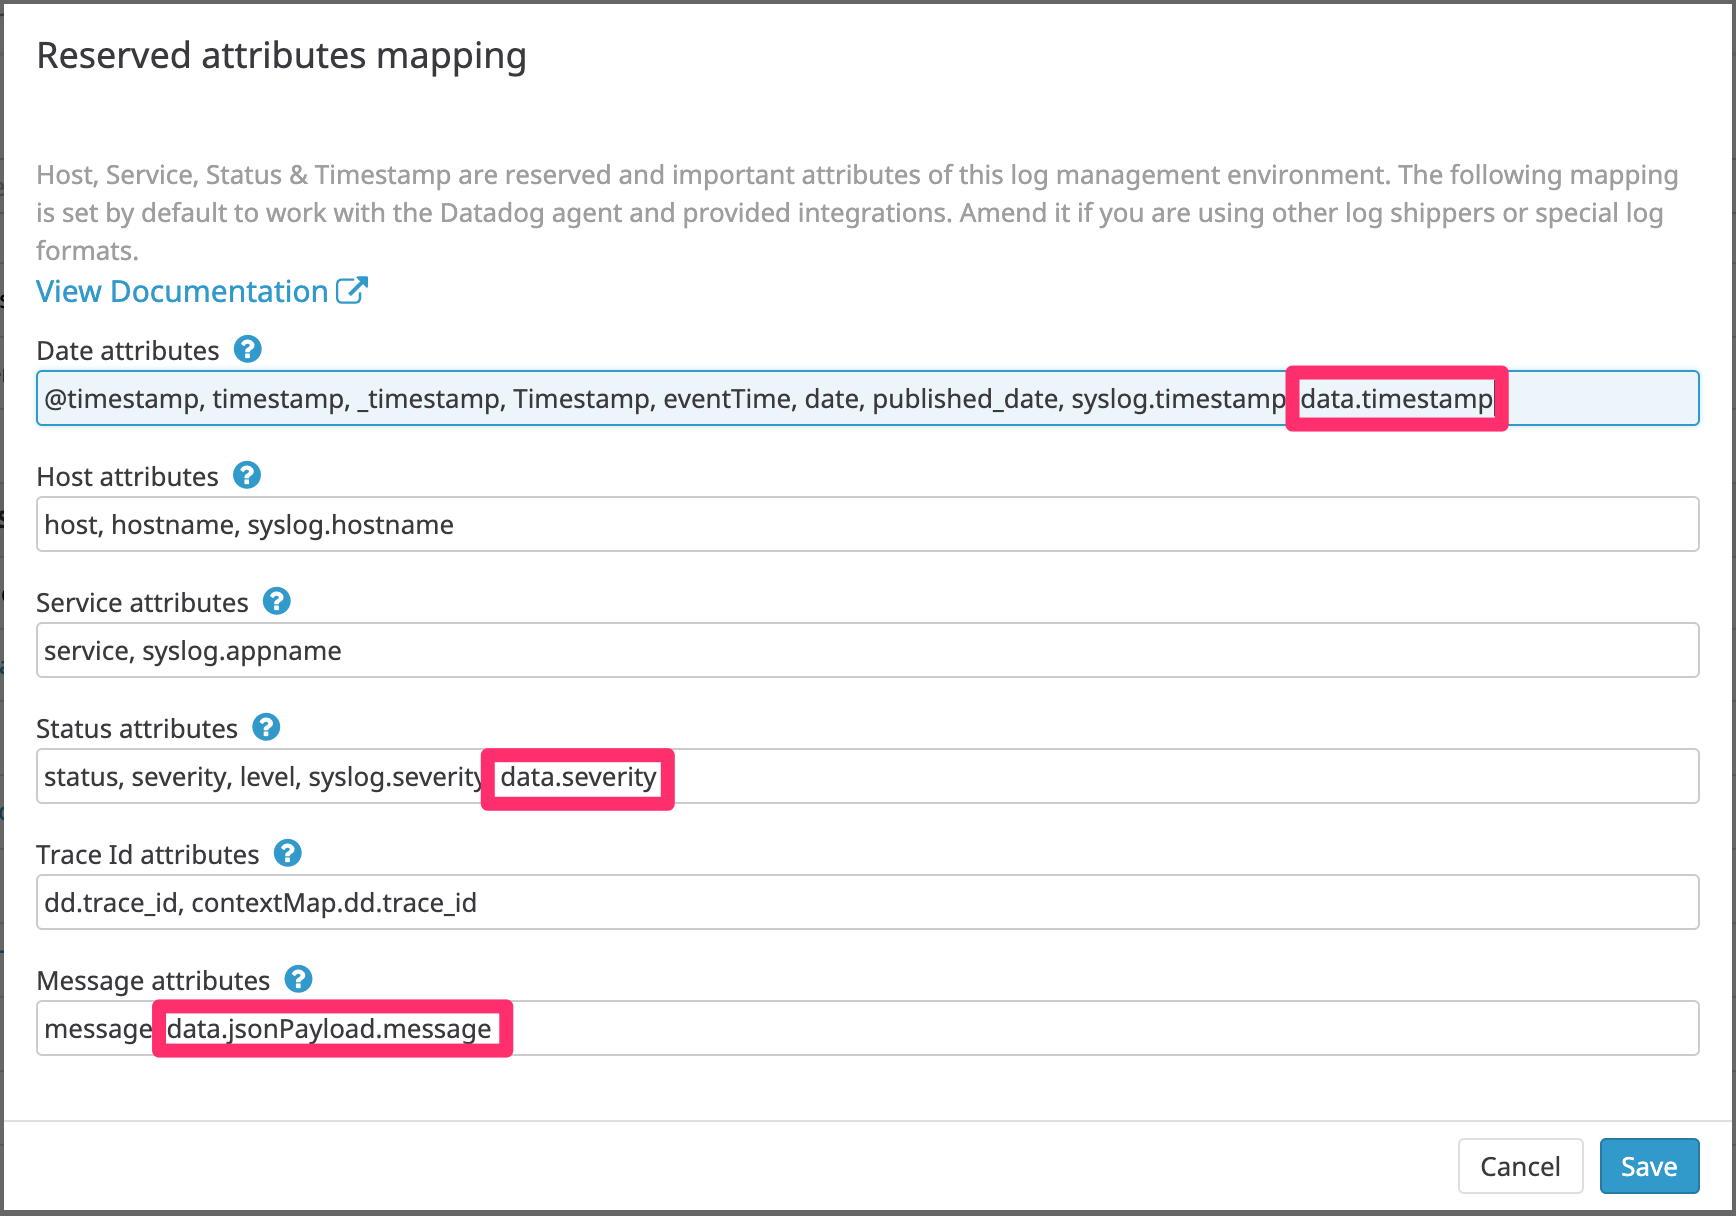
この状態で Datadog Logs の通知設定をしても Message が通知に含まれなかった。
Datadog で特別な意味合いを持つ Message フィールドを別途設定してあげる必要があるようだ。
を参考に Logs > Configuration > Pipeline から Reserved attributes mapping を設定して、JSON payload のログ通知に含めたい文字列を持つフィールド data.jsonPayload.message を Message 属性に指定。よくよく確認すると timestamp, status も同様に mapping する必要があったので設定。
これは terraform では設定不可能だったので手動で設定。
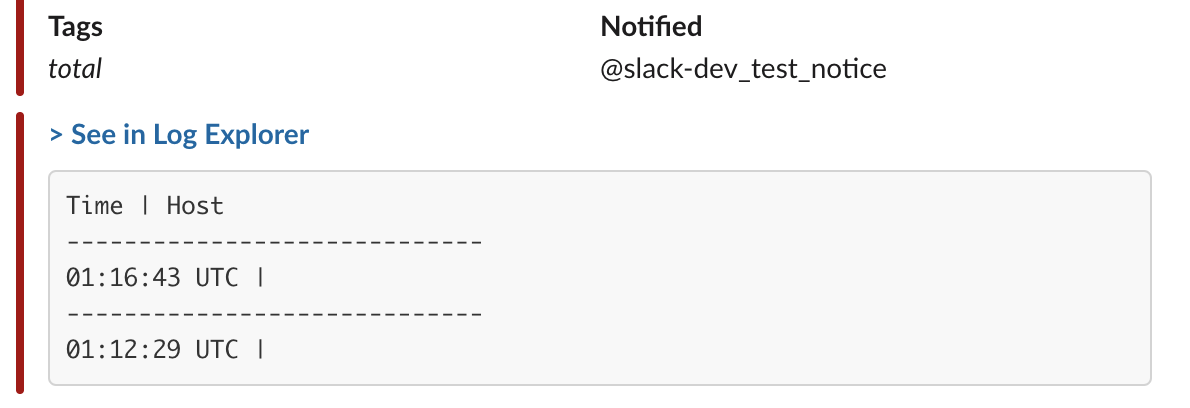
Datadog Logs の通知設定
こちらは terraform で設定できた。
# NOTE: You can check the query is configured on the view page such as https://app.datadoghq.com/monitors/<monitor_id>
# But, it is not shown on the edit page such as https://app.datadoghq.com/monitors#<monitor_id>/edit.
# It looks the field of edit page is `queryString` rather than `query`, but terraform does not support to configure it.
resource "datadog_monitor" "warning_k8s_pod_logging" {
  name    = "(${var.env}) WARNING K8s Pod Logging"
  type    = "log alert"
  message = "Too many warnings from k8s pod logs. Notify: @slack-dev_test_notice"
  query   = "logs(\"source:gcp.k8s.pod project_id:${var.gcp_project_id} status:warn\").index(\"main\").rollup(\"count\").last(\"5m\") > 10" # Minimum is 5m (min)

  thresholds {
    critical = 10.0
  }

  notify_no_data    = false
  no_data_timeframe = 2
  new_host_delay    = 300
  renotify_interval = 0
  timeout_h         = 0
  include_tags      = true
  notify_audit      = false
  tags              = ["env:${var.env}", "project_id:${var.gcp_project_id}"]

  enable_logs_sample = true # Include a sample of 10 logs in the alert notification
}
これで Datadog Logs を経由して Slack 通知でき、Slack 通知に10行までだが、ログ行を含めることができるようになった。
ただし、以下の点は問題になりそうだった。
- 集計間隔が最小でも 5 min (stackdriver は 1min が可能)
- (stackdriver でできるような)時間平均を閾値にするような機能がなく合計のみ
- (stackdriver でできるような)連続してX回閾値を超えたらアラートを飛ばすよう機能がない
-
Datadog Monitor から編集画面に飛ぶと query に何も設定されていないように見える対応された模様?
おわりに
ところどころ手作業が必要だったが、Slack通知にログ行を含めることができるようになった。
Stackdriver 通知がログ行を含めるオプションを持ってくれていれば、こんな面倒はいらないのになぁ(ぼそり