Background
I analyze Eating & Health Module Dataset of Kaggle dataset.
The dataset is here.
Although there are three dataset, I focus on only ehresp_2014.csv dataset.
This dataset contains information about general health and body mass index for each respondent.
Furthermore, this dataset records the income for each respondent.
In this article, I analyze the relationship between the income and other variables.
The code can be found here.
My approach is based on traditional k-means clustering.
The difference from the traditional k-means clustering is that I incorporate the impact of income.
In this dataset, the information of income is denoted by "erincome".
The range of this variable is between 1 and 5.
The description is as follows:
-1 Income > 185% of poverty threshold
-2 Income < = 185% of poverty threshold
-3 130% of poverty threshold < Income<185% of poverty threshold
-4 Income > 130% of poverty threshold
-5 Income <= 130% of poverty threshold.
Approach
There are 32 variables as I remove the following variables("eeincome1", "euincome2", "exincome1", "erincome").
The reason why I remove these variables is that they are all related income and I only use "erincome" to obtain the information of income.
As a preprocessing, I normalize each variable.
Let $K$ be the number of clusters and $x_{v,n,k}$ be the value of
$v$th variable of $n$th respondent within $k$th cluster.
I denote the the value of "erincome" of $l$ th respondent of $k$th cluster
as $S_{n,k}$.
The objective function to be minimized is as follows:
\min_{m_{k,v}} \sum_{k=1}^{K} \sum_{n=1}^{N_{k}}
\sum_{v=1}^{V}
(x_{v,n,k}-S_{n,k}m_{k,v})^2,
where $m_{k,v}$ is the centroid of the $v$th variable within $k$ th cluster.
Experimental setting
I set the number of clustering $K$ to be $7$.
I initialize the clustering allocation randomly.
Results
At first, I show the convergence of this method.
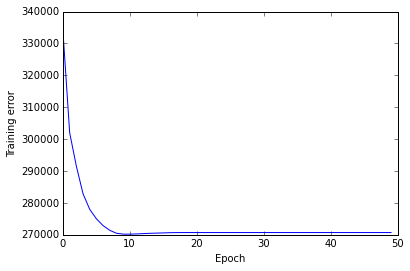
This method can achieve local minimum by updating each variables fixing other variables as well as traditional K-means clustering.
Next, I show the clustering allocation.
| erincome=1 | 2 | 3 | 4 | 5 | |
|---|---|---|---|---|---|
| Cluster 0 | 96 | 2 | 7 | 2 | 0 |
| Cluster 1 | 649 | 193 | 307 | 10 | 705 |
| Cluster 2 | 292 | 0 | 0 | 0 | 0 |
| Cluster 3 | 1926 | 9 | 0 | 0 | 0 |
| Cluster 4 | 1946 | 53 | 3 | 0 | 0 |
| Cluster 5 | 1155 | 43 | 0 | 0 | 0 |
| Cluster 6 | 926 | 233 | 659 | 24 | 1692 |
According to this table, respondents whole "erincome" is $5$ are allocated only to Cluster 1 and Cluster 6.
Next, I introduce the features of each cluster by focusing the coefficient ($m_{k,v}$).
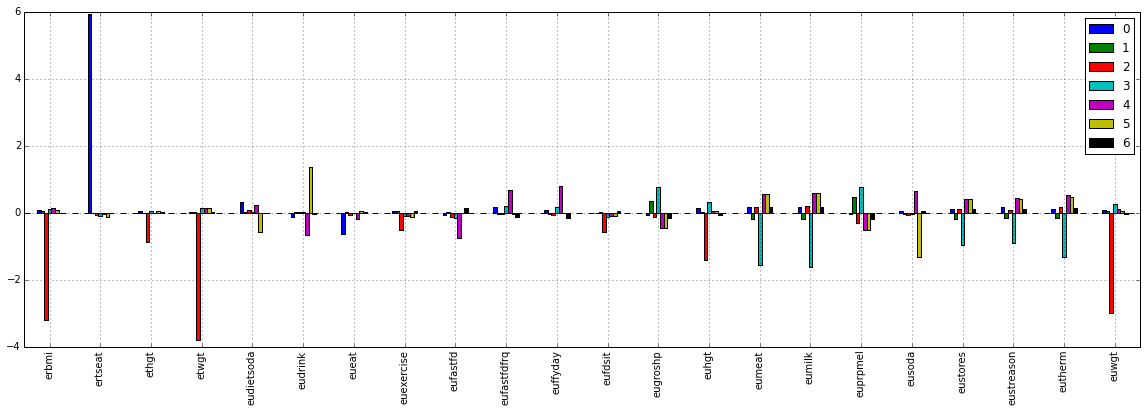
According to this figure,
- Clustering 0: "ertsart" is large.
- Clustering 2: "erbmi", "etwgt", "euhgt" and "enwgt" are small.
- Clustering 3: "eumeant" and "eumilk" are large.
- Clustering 5: "eudrink" and "eusoda" are large.
I think this might be the secret to take the large value of "erincome"
although it is difficult to distinguish Cluster 1 and 6 from cluster 4.