概要
amChartsで、Reactアプリケーション上にローソク足(candlestickチャート)を描画するまで。
なぜamCharts?
同一チャートエリア内に、candlestickチャートとscatterを描画したかったが、以下のライブラリではできないか、またはできなさそうと判断したため。
無料で使用できる有名どころのライブラリをいくつか調べたところ、amChartsであればできそうだったため、消去法で採用。
ChartJS, ApexChart, HighCharts 不採用の理由詳細
-
ChartJS
candlestickを扱っているような動画としょぼいデモページはあるが、ドキュメントに記載がない?(見つからない)
そして、この動画に掲載されているWEBサイトはどこに? -
ApexChart
実際に使ってみたが、問題があった- candlestickチャートのxaxisのtypeとして'category'を指定すると
表示はできるものの、scatterのx軸上の位置を指定することができず、scatterの表示箇所が全て左端に寄ってしまった - candelstickチャートのxaxisのtypeとして'datetime'を指定すると
scatterをx軸上の期待した位置に表示することができるが、'datetime'では、取引所が閉まっている期間(つまり、データが存在しない期間)のローソク足の位置に無駄な隙間が空いてしまうため、'datetime'は不適切
- candlestickチャートのxaxisのtypeとして'category'を指定すると
-
HighCharts
実際に使ってみたわけではないが、調べた限りでは、scatterとcandlestickを同一チャート内に描画することができなさそう
別々のオブジェクトに対して描画しているサンプルしか見つけることができなかった
※いずれも、2020/09/22時点の状況のため、状況が変わっている可能性があります
これに対してamChartsでは、candlestickとscatterを同一のXYChartというオブジェクト上に描画できそうであった
他にも多少調べてみたが、料金がかかるものだったり、ドキュメントが不親切でどこまでできるかよくわからないものしか見つけることができなかった。
(GoogleChartは評判が良くなさそうだったので調べてすらいない。)
ちなみに、料金がかかるものは非常に良いものだったので、本当はそっちを使いたかった。
準備
- amChartsインストール
Using React / AmCharts公式ドキュメントより
$ npm install @amcharts/amcharts4
実装
1. まずは Getting Started で基本的なグラフから
公式ドキュメントのCreating_a_chartに書かれている通りにコーディングすれば、すぐに以下のようなグラフを確認できる。
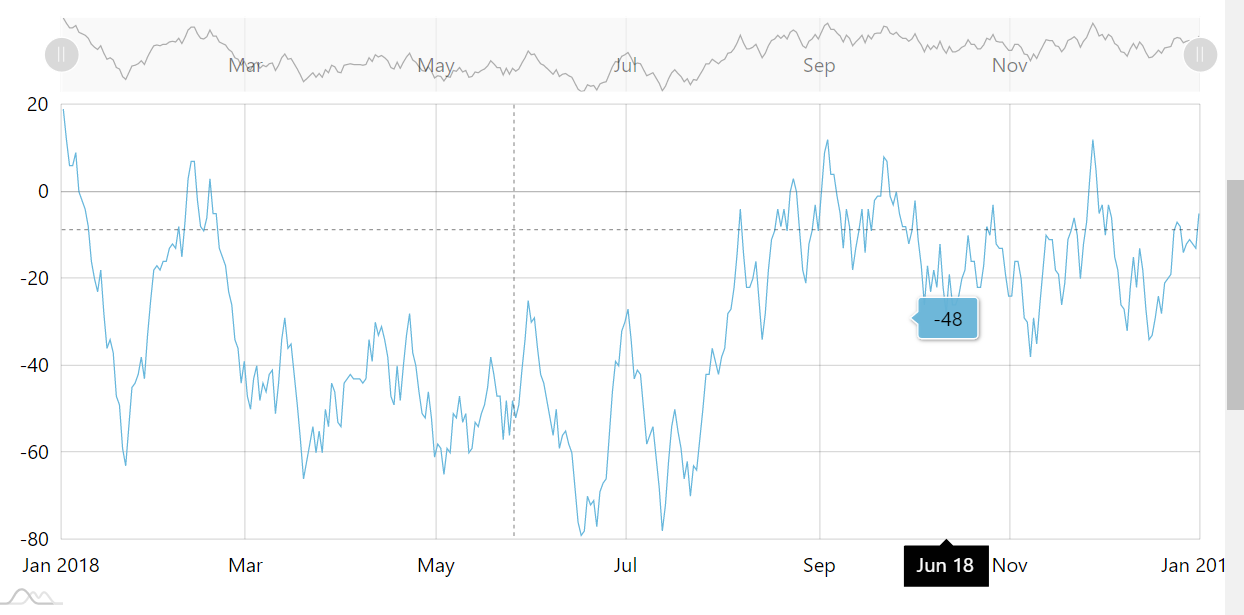
右端の日付が見切れているが、ウィンドウサイズに対してレスポンシブな上に、表示範囲の拡大縮小時の動作がすばらしく美しい。
ChartJS と ApexChart は使用経験がありますが、そのどちらよりも相当洗練されています。
これはかなり期待できる(`・ω・´)
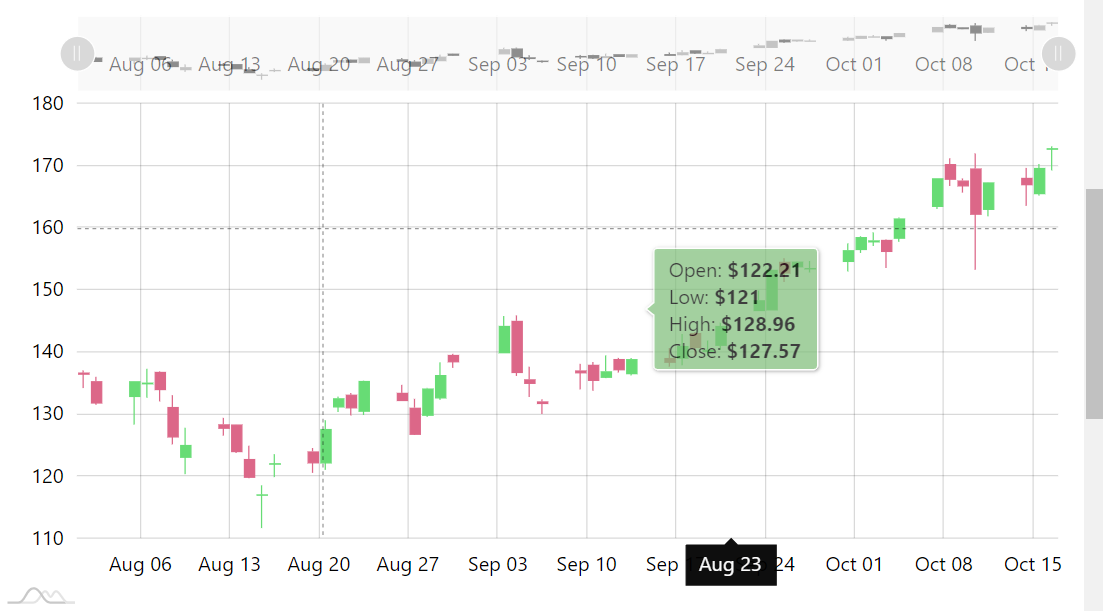
2. 次に candlestick チャートを描画
やり方はここに書いてあります。
が、掲載されているものから若干修正したので、一応修正後のソースコードも掲載。
ソースコード
ソースコードはここをクリックして確認
import React, { Component } from 'react';
import AmChartSample from './AmChartSample';

class App extends Component {
  constructor(props) {
    super(props)
  }

  render() {
    return (
      <>
        <AmChartSample />
      </>
    );
  }
}

export default App;
import React, { Component } from 'react';
import * as am4core from "@amcharts/amcharts4/core";
import * as am4charts from "@amcharts/amcharts4/charts";
import am4themes_animated from "@amcharts/amcharts4/themes/animated";

am4core.useTheme(am4themes_animated);


class AmChartSample extends Component {
  componentDidMount() {
    this.chart = prepareChart();
  }

  componentWillUnmount() {
    if (this.chart) {
      this.chart.dispose();
    }
  }

  render() {
    return (
      <div id="chartdiv" style={{ width: "100%", height: "500px" }}></div>
    );
  }
}

function prepareChart() {
  // ... chart code goes here ...
  const chart = am4core.create('chartdiv', am4charts.XYChart);
  chart.dateFormatter.inputDateFormat = 'yyyy-MM-dd';
  chart.paddingRight = 20;

  const dateAxis = chart.xAxes.push(new am4charts.DateAxis());
  dateAxis.renderer.grid.template.location = 0;
  dateAxis.renderer.minGridDistance = 60;
  // INFO: dateAxis.skipEmptyPeriods を true にしておくと、休日の位置に無駄な余白が表示されずに済む
  // dateAxis.skipEmptyPeriods = true;

  const valueAxis = chart.yAxes.push(new am4charts.ValueAxis());
  valueAxis.tooltip.disabled = true;
  valueAxis.renderer.minWidth = 35;

  var series = chart.series.push(new am4charts.CandlestickSeries());
  series.dataFields.dateX = "date";
  series.dataFields.valueY = "close";
  series.dataFields.openValueY = "open";
  series.dataFields.lowValueY = "low";
  series.dataFields.highValueY = "high";
  // ${変数} を "" や '' で囲むとwarningメッセージが表示されるので`$`を削除した
  series.tooltipText = "Open: [bold]{openValueY.value}[/]\nLow: [bold]{lowValueY.value}[/]\nHigh: [bold]{highValueY.value}[/]\nClose: [bold]{valueY.value}[/]";

  chart.cursor = new am4charts.XYCursor();

  const scrollbarX = new am4charts.XYChartScrollbar();
  scrollbarX.series.push(series);
  chart.scrollbarX = scrollbarX;

  // amChartsのCodePenはこっちのスクロールバーを使っていたけれど、上のやつの方がきれいじゃない?お好みで
  // chart.scrollbarX = new am4core.Scrollbar();

  chart.data = candleData;

  return chart;
}

const candleData = [{
  "date": "2018-08-01",
  "open": "136.65",
  "high": "136.96",
  "low": "134.15",
  "close": "136.49"
}, {
  "date": "2018-08-02",
  "open": "135.26",
  "high": "135.95",
  "low": "131.50",
  "close": "131.85"
}, {
  ...略
}, {
  "date": "2018-10-16",
  "open": "172.69",
  "high": "173.04",
  "low": "169.18",
  "close": "172.75"
}];

export default AmChartSample;
candleData を確認されたい方はここをクリック
const candleData = [{
  "date": "2018-08-01",
  "open": "136.65",
  "high": "136.96",
  "low": "134.15",
  "close": "136.49"
}, {
  "date": "2018-08-02",
  "open": "135.26",
  "high": "135.95",
  "low": "131.50",
  "close": "131.85"
}, {
  "date": "2018-08-05",
  "open": "132.90",
  "high": "135.27",
  "low": "128.30",
  "close": "135.25"
}, {
  "date": "2018-08-06",
  "open": "134.94",
  "high": "137.24",
  "low": "132.63",
  "close": "135.03"
}, {
  "date": "2018-08-07",
  "open": "136.76",
  "high": "136.86",
  "low": "132.00",
  "close": "134.01"
}, {
  "date": "2018-08-08",
  "open": "131.11",
  "high": "133.00",
  "low": "125.09",
  "close": "126.39"
}, {
  "date": "2018-08-09",
  "open": "123.12",
  "high": "127.75",
  "low": "120.30",
  "close": "125.00"
}, {
  "date": "2018-08-12",
  "open": "128.32",
  "high": "129.35",
  "low": "126.50",
  "close": "127.79"
}, {
  "date": "2018-08-13",
  "open": "128.29",
  "high": "128.30",
  "low": "123.71",
  "close": "124.03"
}, {
  "date": "2018-08-14",
  "open": "122.74",
  "high": "124.86",
  "low": "119.65",
  "close": "119.90"
}, {
  "date": "2018-08-15",
  "open": "117.01",
  "high": "118.50",
  "low": "111.62",
  "close": "117.05"
}, {
  "date": "2018-08-16",
  "open": "122.01",
  "high": "123.50",
  "low": "119.82",
  "close": "122.06"
}, {
  "date": "2018-08-19",
  "open": "123.96",
  "high": "124.50",
  "low": "120.50",
  "close": "122.22"
}, {
  "date": "2018-08-20",
  "open": "122.21",
  "high": "128.96",
  "low": "121.00",
  "close": "127.57"
}, {
  "date": "2018-08-21",
  "open": "131.22",
  "high": "132.75",
  "low": "130.33",
  "close": "132.51"
}, {
  "date": "2018-08-22",
  "open": "133.09",
  "high": "133.34",
  "low": "129.76",
  "close": "131.07"
}, {
  "date": "2018-08-23",
  "open": "130.53",
  "high": "135.37",
  "low": "129.81",
  "close": "135.30"
}, {
  "date": "2018-08-26",
  "open": "133.39",
  "high": "134.66",
  "low": "132.10",
  "close": "132.25"
}, {
  "date": "2018-08-27",
  "open": "130.99",
  "high": "132.41",
  "low": "126.63",
  "close": "126.82"
}, {
  "date": "2018-08-28",
  "open": "129.88",
  "high": "134.18",
  "low": "129.54",
  "close": "134.08"
}, {
  "date": "2018-08-29",
  "open": "132.67",
  "high": "138.25",
  "low": "132.30",
  "close": "136.25"
}, {
  "date": "2018-08-30",
  "open": "139.49",
  "high": "139.65",
  "low": "137.41",
  "close": "138.48"
}, {
  "date": "2018-09-03",
  "open": "139.94",
  "high": "145.73",
  "low": "139.84",
  "close": "144.16"
}, {
  "date": "2018-09-04",
  "open": "144.97",
  "high": "145.84",
  "low": "136.10",
  "close": "136.76"
}, {
  "date": "2018-09-05",
  "open": "135.56",
  "high": "137.57",
  "low": "132.71",
  "close": "135.01"
}, {
  "date": "2018-09-06",
  "open": "132.01",
  "high": "132.30",
  "low": "130.00",
  "close": "131.77"
}, {
  "date": "2018-09-09",
  "open": "136.99",
  "high": "138.04",
  "low": "133.95",
  "close": "136.71"
}, {
  "date": "2018-09-10",
  "open": "137.90",
  "high": "138.30",
  "low": "133.75",
  "close": "135.49"
}, {
  "date": "2018-09-11",
  "open": "135.99",
  "high": "139.40",
  "low": "135.75",
  "close": "136.85"
}, {
  "date": "2018-09-12",
  "open": "138.83",
  "high": "139.00",
  "low": "136.65",
  "close": "137.20"
}, {
  "date": "2018-09-13",
  "open": "136.57",
  "high": "138.98",
  "low": "136.20",
  "close": "138.81"
}, {
  "date": "2018-09-16",
  "open": "138.99",
  "high": "140.59",
  "low": "137.60",
  "close": "138.41"
}, {
  "date": "2018-09-17",
  "open": "139.06",
  "high": "142.85",
  "low": "137.83",
  "close": "140.92"
}, {
  "date": "2018-09-18",
  "open": "143.02",
  "high": "143.16",
  "low": "139.40",
  "close": "140.77"
}, {
  "date": "2018-09-19",
  "open": "140.15",
  "high": "141.79",
  "low": "139.32",
  "close": "140.31"
}, {
  "date": "2018-09-20",
  "open": "141.14",
  "high": "144.65",
  "low": "140.31",
  "close": "144.15"
}, {
  "date": "2018-09-23",
  "open": "146.73",
  "high": "149.85",
  "low": "146.65",
  "close": "148.28"
}, {
  "date": "2018-09-24",
  "open": "146.84",
  "high": "153.22",
  "low": "146.82",
  "close": "153.18"
}, {
  "date": "2018-09-25",
  "open": "154.47",
  "high": "155.00",
  "low": "151.25",
  "close": "152.77"
}, {
  "date": "2018-09-26",
  "open": "153.77",
  "high": "154.52",
  "low": "152.32",
  "close": "154.50"
}, {
  "date": "2018-09-27",
  "open": "153.44",
  "high": "154.60",
  "low": "152.75",
  "close": "153.47"
}, {
  "date": "2018-09-30",
  "open": "154.63",
  "high": "157.41",
  "low": "152.93",
  "close": "156.34"
}, {
  "date": "2018-10-01",
  "open": "156.55",
  "high": "158.59",
  "low": "155.89",
  "close": "158.45"
}, {
  "date": "2018-10-02",
  "open": "157.78",
  "high": "159.18",
  "low": "157.01",
  "close": "157.92"
}, {
  "date": "2018-10-03",
  "open": "158.00",
  "high": "158.08",
  "low": "153.50",
  "close": "156.24"
}, {
  "date": "2018-10-04",
  "open": "158.37",
  "high": "161.58",
  "low": "157.70",
  "close": "161.45"
}, {
  "date": "2018-10-07",
  "open": "163.49",
  "high": "167.91",
  "low": "162.97",
  "close": "167.91"
}, {
  "date": "2018-10-08",
  "open": "170.20",
  "high": "171.11",
  "low": "166.68",
  "close": "167.86"
}, {
  "date": "2018-10-09",
  "open": "167.55",
  "high": "167.88",
  "low": "165.60",
  "close": "166.79"
}, {
  "date": "2018-10-10",
  "open": "169.49",
  "high": "171.88",
  "low": "153.21",
  "close": "162.23"
}, {
  "date": "2018-10-11",
  "open": "163.01",
  "high": "167.28",
  "low": "161.80",
  "close": "167.25"
}, {
  "date": "2018-10-14",
  "open": "167.98",
  "high": "169.57",
  "low": "163.50",
  "close": "166.98"
}, {
  "date": "2018-10-15",
  "open": "165.54",
  "high": "170.18",
  "low": "165.15",
  "close": "169.58"
}, {
  "date": "2018-10-16",
  "open": "172.69",
  "high": "173.04",
  "low": "169.18",
  "close": "172.75"
}];

export default AmChartSample;
- 上記ソースコードの通りだと以下のように
休日などのデータがない部分に余計な隙間がある。
-
dateAxis.skipEmptyPeriods = true;にすると以下のように
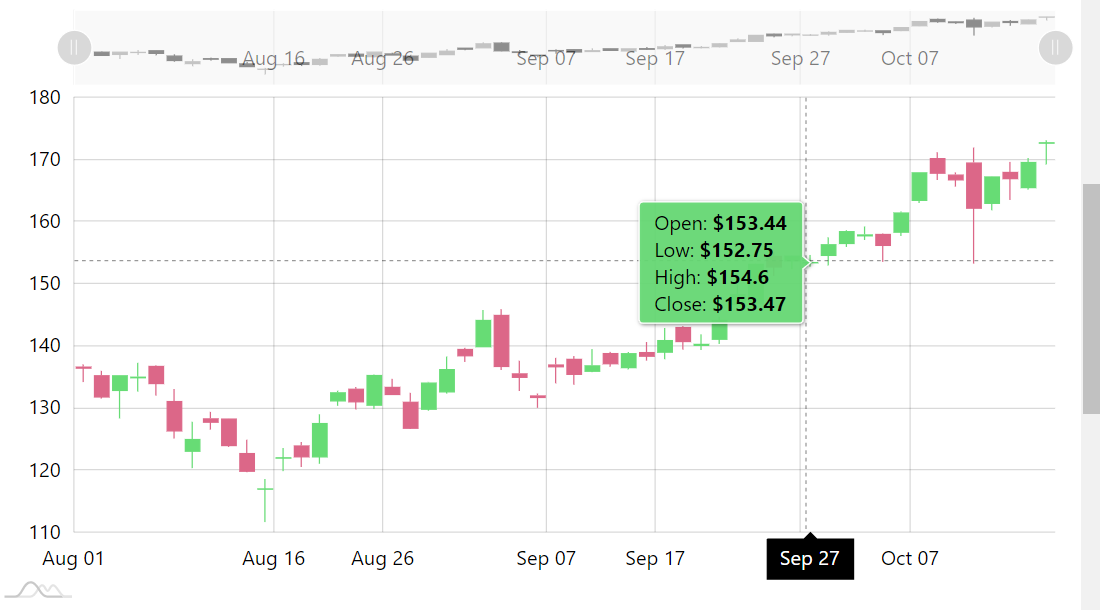
投資関係やってる人からしたらこの表示方法がデフォルトのはず。
ちなみに、このオプションは以下の記事で見つけました。
Amchart (three) candle chart
参考情報
- amCharts / XYChart のドキュメント
Anatomy of an XY Chart - amCharts / 基本的な candlestick チャートの実装方法
Taming Candlestick Series - amChartのcandlestick利用について、発展的な内容が含まれていそうな記事
New advanced JavaScript Stock Chart features
番外編
3. candlestickと一緒にscatterなどを表示させる
当初筆者がやりたかったことはこれです( ・´ー・`)ドヤッ
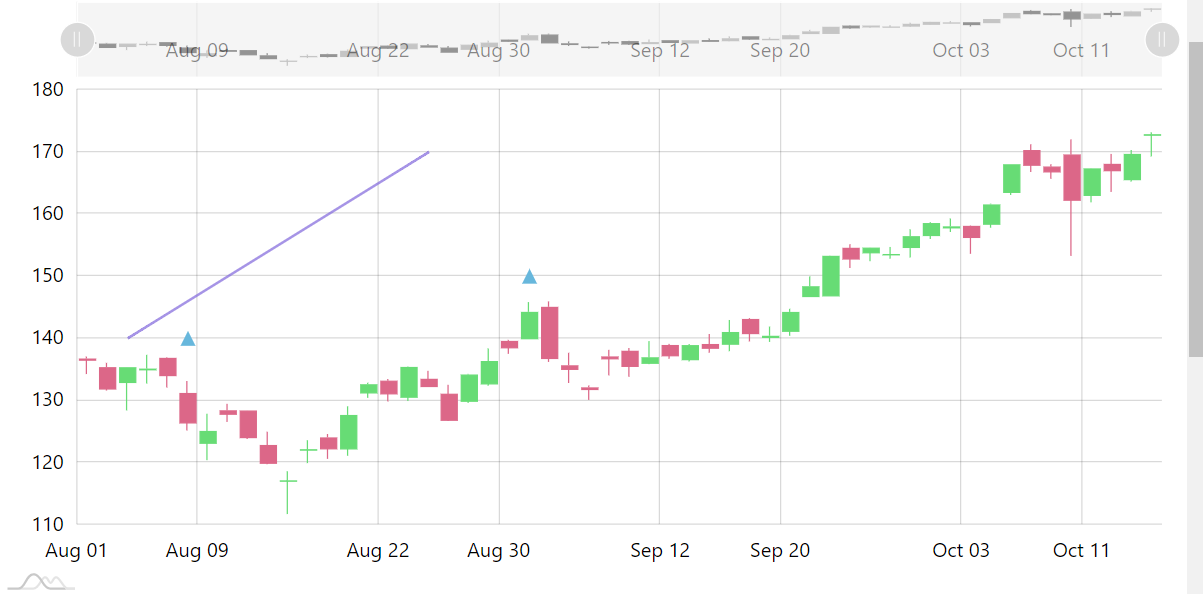
candlestickだけでなく、LineやScatterが描画されています!
ソースコード
好き勝手いじっているのでわかりにくくなっているかもしれませんが、ご容赦ください(o*。_。)oペコッ
ソースコードはここをクリックして確認
import React, { Component } from 'react';
import * as am4core from '@amcharts/amcharts4/core';
import * as am4charts from '@amcharts/amcharts4/charts';
import am4themes_animated from '@amcharts/amcharts4/themes/animated';

am4core.useTheme(am4themes_animated);


class AmChartSample extends Component {
  componentDidMount() {
    this.chart = prepareChart();
  }

  componentWillUnmount() {
    if (this.chart) {
      this.chart.dispose();
    }
  }

  render() {
    return (
      <div id='chartdiv' style={{ width: '100%', height: '500px' }}></div>
    );
  }
}

function prepareChart() {
  // ... chart code goes here ...
  const chart = am4core.create('chartdiv', am4charts.XYChart);
  chart.cursor = new am4charts.XYCursor();
  chart.dateFormatter.inputDateFormat = 'yyyy-MM-dd';
  chart.paddingRight = 20;

  const dateAxis = chart.xAxes.push(new am4charts.DateAxis());
  dateAxis.renderer.grid.template.location = 0;
  dateAxis.renderer.minGridDistance = 60;
  dateAxis.skipEmptyPeriods = true;

  const valueAxis = chart.yAxes.push(new am4charts.ValueAxis());
  valueAxis.tooltip.disabled = true;
  valueAxis.renderer.minWidth = 35;

  const candlestick = addCandlestick(chart)
  addLineSample(chart);
  addScatterSample(chart)

  const scrollbarX = new am4charts.XYChartScrollbar();
  scrollbarX.series.push(candlestick);
  chart.scrollbarX = scrollbarX;
  // chart.scrollbarX = new am4core.Scrollbar();

  return chart;
}

function addCandlestick(chart) {
  const candlestick = chart.series.push(new am4charts.CandlestickSeries());
  candlestick.dataFields.dateX = 'date';
  candlestick.dataFields.valueY = 'close';
  candlestick.dataFields.openValueY = 'open';
  candlestick.dataFields.lowValueY = 'low';
  candlestick.dataFields.highValueY = 'high';
  candlestick.tooltipText = 'Open: [bold]{openValueY.value}[/]\nLow: [bold]{lowValueY.value}[/]\nHigh: [bold]{highValueY.value}[/]\nClose: [bold]{valueY.value}[/]';

  chart.data = candleData;

  return candlestick;
}

function addLineSample(chart) {
  const lineSample = chart.series.push(new am4charts.LineSeries());
  lineSample.dataFields.dateX = 'value';
  lineSample.dataFields.valueY = 'value2';
  lineSample.strokeWidth = 2
  lineSample.stroke = chart.colors.getIndex(3);
  lineSample.strokeOpacity = 0.7;
  lineSample.data = [
    { 'value': '2018-08-05', 'value2': 140 },
    { 'value': '2018-08-26', 'value2': 170 }
  ];
}

function addScatterSample(chart) {
  const lineSample = chart.series.push(new am4charts.LineSeries());
  lineSample.dataFields.dateX = 'value';
  lineSample.dataFields.valueY = 'value2';
  lineSample.strokeWidth = 2
  lineSample.stroke = chart.colors.getIndex(3);
  lineSample.strokeOpacity = 0.0;
  lineSample.data = [
    { 'value': '2018-08-08', 'value2': 140 },
    { 'value': '2018-09-03', 'value2': 150 }
  ];

  // Add a bullet
  let bullet = lineSample.bullets.push(new am4charts.Bullet());
  // Add a triangle to act as am arrow
  let arrow = bullet.createChild(am4core.Triangle);
  arrow.horizontalCenter = "middle";
  arrow.verticalCenter = "middle";
  arrow.strokeWidth = 0;
  arrow.fill = chart.colors.getIndex(0);
  arrow.direction = "top";
  arrow.width = 12;
  arrow.height = 12;
}

const candleData = [{
  "date": "2018-08-01",
  "open": "136.65",
  "high": "136.96",
  "low": "134.15",
  "close": "136.49"
}, {
  "date": "2018-08-02",
  "open": "135.26",
  "high": "135.95",
  "low": "131.50",
  "close": "131.85"
}, {
  ...略
}, {
  "date": "2018-10-16",
  "open": "172.69",
  "high": "173.04",
  "low": "169.18",
  "close": "172.75"
}];

export default AmChartSample;