前回のタイタニックチュートリアルの記事が中途半端ですが、仕事で時系列データによる将来の予測のタスクが来たので、勉強がてら他の時系列のKaggleコンテストを触ってみます。
対象のコンテスト
Store Item Demand Forecasting Challenge | Predict 3 months of item sales at different stores
コンテスト内容
- 与えられるのは5年分の各ショップの売り上げデータ。
- ショップ数10、商品数50。
- 3か月先の各ショップ別・商品別の売り上げを予測するのが目的。
- 賞金などはなく、スキルアップなどが目的のコンペ。
データを確認してみる
KaggleのAPIを使ってみる
APIがあるようなので、データを落としたりが楽にできないか少し触ってみます。(クラウド上のカーネルでの対応が楽になるのを期待しつつ)
とりあえず、Azure Notebooks環境で進めてみます。
ライブラリをインストール。
!pip install kaggle
Successfully installed kaggle-1.4.2
認証用のファイルをダウンロードします。
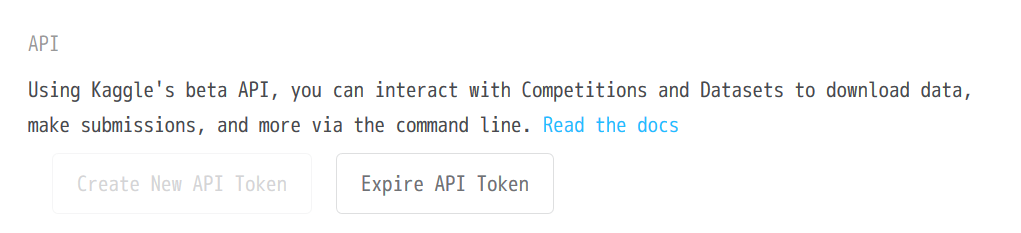
Kaggleのアカウントのページ(https://www.kaggle.com/<ユーザー名>/account)にアクセスします。
APIのところの「Create New API Token」をクリック。トークンのJSONファイルがダウンロードされます。
Kaggleのライブラリモジュールをimportすると、「ここに認証用のファイルを設置してね」とか「JSONの権限を600に変えてね」といったエラー内容や警告がでるので、そちらの指示に従って対応します。
Azure Notebooksの場合、「/home/nbuser/.kaggle/」以下に設置するように指示が出ました。
import kaggle
import os
os.makedirs('/home/nbuser/.kaggle/')
!cp ../auth/kaggle.json /home/nbuser/.kaggle/kaggle.json
!chmod 600 /home/nbuser/.kaggle/kaggle.json
(クラウド環境だと、消えてしまったりしそうなので、あとでスクリプト書いておこうと考えつつ・・)
データダウンロード関係のドキュメントを見てみます。
どうやらコマンドライン経由で扱う模様・・
-c 引数に対象コンペのURLに含まれるID的な文字列(今回は https://www.kaggle.com/c/demand-forecasting-kernels-only の demand-forecasting-kernels-only )、-p引数にダウンロード先のディレクトリを指定します。
!kaggle competitions download -c demand-forecasting-kernels-only -p ./
Downloading sample_submission.csv.zip to .
  0%|                                                | 0.00/101k [00:00<?, ?B/s]
100%|█████████████████████████████████████████| 101k/101k [00:00<00:00, 486kB/s]
Downloading test.csv.zip to .
  0%|                                                | 0.00/135k [00:00<?, ?B/s]
100%|█████████████████████████████████████████| 135k/135k [00:00<00:00, 398kB/s]
Downloading train.csv.zip to .
 97%|████████████████████████████████████▉ | 3.00M/3.08M [00:00<00:00, 3.64MB/s]
100%|███████████████████████████████████████| 3.08M/3.08M [00:04<00:00, 804kB/s]
zipで落ちてくる模様。
解凍しておきます。
import zipfile
file_list = [
    'sample_submission.csv.zip',
    'train.csv.zip',
    'test.csv.zip']
for file_name in file_list:
    with zipfile.ZipFile(file=file_name) as target_zip:
        target_zip.extractall()
train.csv
import pandas as pd
train_df = pd.read_csv('./train.csv')
train_df.head()
| date | store | item | sales | |
|---|---|---|---|---|
| 0 | 2013-01-01 | 1 | 1 | 13 |
| 1 | 2013-01-02 | 1 | 1 | 11 |
| 2 | 2013-01-03 | 1 | 1 | 14 |
| 3 | 2013-01-04 | 1 | 1 | 13 |
| 4 | 2013-01-05 | 1 | 1 | 10 |
print(train_df.tail().to_html())
| date | store | item | sales | |
|---|---|---|---|---|
| 912995 | 2017-12-27 | 10 | 50 | 63 |
| 912996 | 2017-12-28 | 10 | 50 | 59 |
| 912997 | 2017-12-29 | 10 | 50 | 74 |
| 912998 | 2017-12-30 | 10 | 50 | 62 |
| 912999 | 2017-12-31 | 10 | 50 | 82 |
約91万行のデータ。
train_df.describe().loc[:, ['sales']]
| sales | |
|---|---|
| count | 913000.000000 |
| mean | 52.250287 |
| std | 28.801144 |
| min | 0.000000 |
| 25% | 30.000000 |
| 50% | 47.000000 |
| 75% | 70.000000 |
| max | 231.000000 |
train_df.info()
<class 'pandas.core.frame.DataFrame'>
RangeIndex: 913000 entries, 0 to 912999
Data columns (total 4 columns):
date     913000 non-null object
store    913000 non-null int64
item     913000 non-null int64
sales    913000 non-null int64
dtypes: int64(3), object(1)
memory usage: 27.9+ MB
欠損値などはない模様。
test.csv
test_df = pd.read_csv('test.csv')
test_df.head()
| id | date | store | item | |
|---|---|---|---|---|
| 0 | 0 | 2018-01-01 | 1 | 1 |
| 1 | 1 | 2018-01-02 | 1 | 1 |
| 2 | 2 | 2018-01-03 | 1 | 1 |
| 3 | 3 | 2018-01-04 | 1 | 1 |
| 4 | 4 | 2018-01-05 | 1 | 1 |
test_df.tail()
| id | date | store | item | |
|---|---|---|---|---|
| 44995 | 44995 | 2018-03-27 | 10 | 50 |
| 44996 | 44996 | 2018-03-28 | 10 | 50 |
| 44997 | 44997 | 2018-03-29 | 10 | 50 |
| 44998 | 44998 | 2018-03-30 | 10 | 50 |
| 44999 | 44999 | 2018-03-31 | 10 | 50 |
test_df.info()
<class 'pandas.core.frame.DataFrame'>
RangeIndex: 45000 entries, 0 to 44999
Data columns (total 4 columns):
id       45000 non-null int64
date     45000 non-null object
store    45000 non-null int64
item     45000 non-null int64
dtypes: int64(3), object(1)
memory usage: 1.4+ MB
sample_submission.csv
sample_submission_df = pd.read_csv('./sample_submission.csv')
sample_submission_df.head()
| id | sales | |
|---|---|---|
| 0 | 0 | 52 |
| 1 | 1 | 52 |
| 2 | 2 | 52 |
| 3 | 3 | 52 |
| 4 | 4 | 52 |
sample_submission_df.info()
<class 'pandas.core.frame.DataFrame'>
RangeIndex: 45000 entries, 0 to 44999
Data columns (total 2 columns):
id       45000 non-null int64
sales    45000 non-null int64
dtypes: int64(2)
memory usage: 703.2 KB
Prophetを使ってみる
知り合いからFacebookのライブラリのProphet良さそうと伺ったのと、シンプルで馴染むAPIだったので、一旦Prophetを使ってみます。
インストール周り
!pip install fbprophet
pystanに依存するため、一度エラーが出ますがそのままpystanのインストールも含め、インストールが進んでいきました。
ModuleNotFoundError: No module named 'pystan'
...
Installing collected packages: pystan, fbprophet
※2017/9/26現在ではAnacondaのfbprohetがver0.1.1なのでpip install推奨 一回エラー出るかもしれないけど、pystanが入ればインストール成功します。
Prophet利用方法
インストールに少し時間がかかります。
Successfully installed fbprophet-0.3.post2 pystan-2.17.1.0
一部のストア・商品で動かしてみる
ストアID = 1, 商品ID = 1 のデータフレームで、Prophetを動かしてみます。
store_1_df = train_df[
    (train_df.store == 1) & (train_df.item == 1)]
store_1_df.head(n=3)
| date | store | item | sales | |
|---|---|---|---|---|
| 0 | 2013-01-01 | 1 | 1 | 13 |
| 1 | 2013-01-02 | 1 | 1 | 11 |
| 2 | 2013-01-03 | 1 | 1 | 14 |
store_1_df.info()
<class 'pandas.core.frame.DataFrame'>
Int64Index: 1826 entries, 0 to 1825
Data columns (total 4 columns):
date     1826 non-null object
store    1826 non-null int64
item     1826 non-null int64
sales    1826 non-null int64
dtypes: int64(3), object(1)
memory usage: 151.3+ KB
renamed_store_1_df.head(n=2)
| ds | y | |
|---|---|---|
| 0 | 2013-01-01 | 13 |
| 1 | 2013-01-02 | 11 |
一旦、引数でのパラメーター調整などせずに対応します。
from fbprophet import Prophet
m = Prophet()
m.fit(df=renamed_store_1_df)
3か月分、90行分必要なので、periods=90と指定します。
future_df = m.make_future_dataframe(periods=90)
forecast_df = m.predict(df=future_df)
yhatというカラム名で、推論結果が設定されます。
forecast_df.loc[:, ['ds', 'yhat', 'yhat_lower', 'yhat_upper']].tail()
| ds | yhat | yhat_lower | yhat_upper | |
|---|---|---|---|---|
| 1911 | 2018-03-27 | 20.606651 | 14.875017 | 26.001466 |
| 1912 | 2018-03-28 | 21.284127 | 15.653048 | 26.926783 |
| 1913 | 2018-03-29 | 21.995847 | 16.337424 | 27.573980 |
| 1914 | 2018-03-30 | 23.612987 | 18.062670 | 28.965417 |
| 1915 | 2018-03-31 | 25.626790 | 20.105935 | 31.187498 |
ドキュメントに、
as well as columns for components and uncertainty intervals.
Quick Start
とあり、yhat_lowerとyhat_upperの範囲は信頼区間的なもののようです。
matplotlibのfigureを返す関数が用意されているので、そちらでプロットしてみます。
m.plot(fcst=forecast_df)
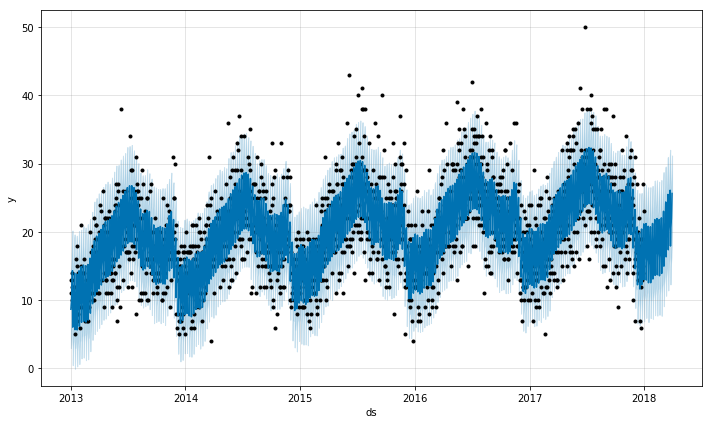
使い方がシンプルでいいですね。
同様に、全ストア・全商品で試してみる
store_id_arr = train_df.store.unique()
store_id_arr
array([ 1, 2, 3, 4, 5, 6, 7, 8, 9, 10])
item_id_arr = train_df.item.unique()
item_id_arr
array([ 1,  2,  3,  4,  5,  6,  7,  8,  9, 10, 11, 12, 13, 14, 15, 16, 17,
       18, 19, 20, 21, 22, 23, 24, 25, 26, 27, 28, 29, 30, 31, 32, 33, 34,
       35, 36, 37, 38, 39, 40, 41, 42, 43, 44, 45, 46, 47, 48, 49, 50])
推論結果などの保存先のディレクトリを用意しておきます。
import os

CSV_DIR = './csv/'
PLOT_DIR = './plot/'

if not os.path.exists(CSV_DIR):
    os.makedirs(CSV_DIR)
if not os.path.exists(PLOT_DIR):
    os.makedirs(PLOT_DIR)
対象のストア・商品の推論結果とプロットを保存する関数を用意しておきます。
from datetime import datetime

def predict_and_save_result(store_id, item_id):
    """
    対象のストア、商品に対して推論を行い、結果のデータ
    のCSVとプロットの保存を行う。

    CSV保存先 : ./csv/<ストアのID>_<商品のID>.csv
    プロット保存先 : ./plot/<ストアのID>_<商品のID>.png

    Parameters
    ----------
    store_id : int
        推論対象のストアのID。
    item_id : int
        推論対象の商品のID。
    """
    print(
        datetime.now(), 'store_id :', store_id,
        'item_id :', item_id, 'prediction started.')

    csv_path = CSV_DIR + '%s_%s.csv' % (store_id, item_id)
    plot_path = PLOT_DIR + '%s_%s.png' % (store_id, item_id)

    # すでに結果が存在すれば処理は行わない。
    if (os.path.exists(csv_path) and
            os.path.exists(plot_path)):
        return

    target_df = train_df[
        (train_df.store == store_id) & (train_df.item == item_id)]
    renamed_df = target_df.rename(
        columns={'date': 'ds', 'sales': 'y'})
    renamed_df = renamed_df.loc[:, ['ds', 'y']]
    m = Prophet()
    m.fit(df=renamed_df)
    future_df = m.make_future_dataframe(periods=90)
    forecast_df = m.predict(df=future_df)
    figure = m.plot(fcst=forecast_df)

    forecast_df.to_csv(
        csv_path, index=False, encoding='utf-8')
    figure.savefig(fname=plot_path)
試しにstore_id=1, item_id=1で動かしてみて、結果を表示してみます。
!pip install pillow
Requirement already satisfied: pillow in /home/nbuser/anaconda3_501/lib/python3.6/site-packages (4.3.0)
predict_and_save_result(store_id=1, item_id=1)
img = Image.open(fp=PLOT_DIR + '1_1.png')
img

img.close()

saved_df = pd.read_csv(CSV_DIR + '1_1.csv')
saved_df.tail().loc[:, ['ds', 'yhat']]
| ds | yhat | |
|---|---|---|
| 1911 | 2018-03-27 | 20.606651 |
| 1912 | 2018-03-28 | 21.284127 |
| 1913 | 2018-03-29 | 21.995847 |
| 1914 | 2018-03-30 | 23.612987 |
| 1915 | 2018-03-31 | 25.626790 |
大丈夫そうです。
大雑把に計った感じでは、一通り処理が終わるまでは何時間も必要になりそうな印象です。
仕事だと並列化などを検討するところですが、今回は手間なので処理が終わるまで待つようにします。
for store_id in store_id_arr:
    for item_id in item_id_arr:
        predict_and_save_result(
            store_id=store_id, item_id=item_id)
各商品まとめた画像を作ってみる
変な推論になっているデータがないか大雑把に確認するため、各ストアごとに各プロットを小さく縦10 x 横5でまとめた画像を生成してみてみます。
プロット画像のサイズ確認 :
from PIL import Image
img = Image.open(PLOT_DIR + '1_1.png')
img.width
720
img.height
432
img.close()
縦横の比率を保ったまま、1画像あたり幅180px高さ108pxとし、合計で幅900px、高さ1080pxの画像をストアごとに作ります。
def make_store_all_plot_img(store_id):
    """
    対象のストアの各商品ごとのプロットをまとめた1つの
    画像を生成する。

    Parameters
    ----------
    store_id : int
        対象のストアのID(1~10)。

    Returns
    -------
    img : Image
        対象のストアの50商品分のプロットをまとめた画像。
        縦10 x 横5画像で、W900px, H1080pxの画像となる。
    """
    unit_width = 180
    unit_height = 108
    img = Image.new(
        mode='RGB',
        size=(unit_width * 5, unit_height * 10),
        color='#FFFFFF')
    for i, item_id in enumerate(item_id_arr):
        unit_plot_file_path = PLOT_DIR + '%s_%s.png' % \
            (store_id, item_id)
        unit_img = Image.open(fp=unit_plot_file_path)
        unit_img = unit_img.resize(
            size=(unit_width, unit_height),
            resample=Image.BILINEAR)
        x_index = i % 5
        y_index = int(i / 5)
        img.paste(
            im=unit_img,
            box=(x_index * unit_width, y_index * unit_height))
        unit_img.close()
    return img
make_store_all_plot_img(store_id=1)

ここでは省略しますが、一応他のショップのものも確認しておきます。
大雑把にですが、大丈夫そうなので、次のステップに進みます。
提出用のデータを用意する。
提出用のデータは、idとsalesカラムのみ必要となります。
test.csvには、id, date, store, itemカラムがあり、推論結果はstoreとitemごとに、各日と推論結果を含んだCSVとなっています。
そのため、提出用のCSVを用意するために、date, store, itemの値からidを取得できるように、多次元の連想配列を用意しておきましょう。
dict[date][store][item] = id といった具合に、各次元のキーにそれぞれ日付、ストアID、商品ID、値にidカラムの値を設定します。
通常の辞書の場合、存在しないキーの部分に毎回新しい辞書を追加したりと手間なので、defaultdictを使います。
from collections import defaultdict
test_data_defaultdict = defaultdict(
    lambda: defaultdict(lambda: defaultdict(int)))
また、データフレームのままループを回すと遅いので、一旦ndarrayに変換してからループを回します。(そうすることで、一瞬で辞書への値の設定が終わります)
test_arr = test_df.as_matrix()
test_arr
array([[0, '2018-01-01', 1, 1],
       [1, '2018-01-02', 1, 1],
       [2, '2018-01-03', 1, 1],
       ...,
       [44997, '2018-03-29', 10, 50],
       [44998, '2018-03-30', 10, 50],
       [44999, '2018-03-31', 10, 50]], dtype=object)
for target_row_arr in test_arr:
    id_ = int(target_row_arr[0])
    date = str(target_row_arr[1])
    store =  int(target_row_arr[2])
    item = int(target_row_arr[3])

    test_data_defaultdict[date][store][item] = id_
用意した辞書を参照する形で、各推論結果のデータフレームにidカラムを追加し、ストア・商品別に分かれている分を一つのデータフレームにまとめます。
def get_target_data_id(date, store_id, item_id):
    """
    対象の日付、ストアのID、商品のIDから、該当するidを
    取得する。

    Parameters
    ----------
    date : str or Timestamp
        対象の日付。
    store_id : int
        対象のストアのID。
    item_id : int
        対象の商品のID。

    Returns
    -------
    id_ : int
        該当する(提出用のデータに紐づく)id。
        該当する値が存在しない場合は-1が返却される。
    """
    date = str(date)
    store_id = int(store_id)
    item_id = int(item_id)
    if not test_data_defaultdict[date][store_id].has_key(item_id):
        return -1
    return test_data_defaultdict[date][store_id][item_id]

predicted_df_list = []
for store_id in store_id_arr:
    print(datetime.now(), 'store_id :', store_id, 'started.')
    for item_id in item_id_arr:

        target_store_csv_path = CSV_DIR + '%s_%s.csv' % \
            (store_id, item_id)
        target_store_predicted_df = pd.read_csv(
            target_store_csv_path)
        target_store_predicted_df['id'] = target_store_predicted_df['ds'].apply(
            get_target_data_id,
            store_id=store_id, item_id=item_id)
        predicted_df_list.append(target_store_predicted_df)
2018-07-28 07:02:40.583967 store_id : 1 started.
2018-07-28 07:02:47.156170 store_id : 2 started.
2018-07-28 07:02:54.077372 store_id : 3 started.
2018-07-28 07:03:00.129491 store_id : 4 started.
2018-07-28 07:03:05.877288 store_id : 5 started.
2018-07-28 07:03:13.579948 store_id : 6 started.
2018-07-28 07:03:21.454486 store_id : 7 started.
2018-07-28 07:03:28.574409 store_id : 8 started.
2018-07-28 07:03:35.764472 store_id : 9 started.
2018-07-28 07:03:44.597948 store_id : 10 started.
overall_df = pd.concat(
    predicted_df_list, ignore_index=True)
推論対象の日付範囲のデータのみにスライスします。
overall_df = overall_df[overall_df.ds >= '2018-01-01']
len(overall_df)
45000
必要なカラムのみにスライスします。
overall_df = overall_df.loc[:, ['yhat', 'id']]
test.csvのデータとidカラムを使って結合します。
submission_df = pd.merge(
    left=test_df, right=overall_df, how='inner', on='id')
yhatとなっているカラム名を、提出用にsalesとリネームします。
submission_df.rename(columns={'yhat': 'sales'}, inplace=True)
提出用のCSVがidとsalesカラムのみ必要なので、そのようにスライスします。
submission_df = submission_df.loc[:, ['id', 'sales']]
salesカラムが推論結果のままで、浮動小数点数を含んでいるので整数にキャストしておきます。
import numpy as np

submission_df.sales = submission_df.sales.astype(
    np.int, copy=False)
結果を確認してみます。
submission_df.head()
| id | sales | |
|---|---|---|
| 0 | 0 | 12 |
| 1 | 1 | 15 |
| 2 | 2 | 16 |
| 3 | 3 | 16 |
| 4 | 4 | 18 |
submission_df.describe()
| id | sales | |
|---|---|---|
| count | 45000.000000 | 45000.000000 |
| mean | 22499.500000 | 50.478556 |
| std | 12990.525394 | 25.119587 |
| min | 0.000000 | 8.000000 |
| 25% | 11249.750000 | 30.000000 |
| 50% | 22499.500000 | 47.000000 |
| 75% | 33749.250000 | 67.000000 |
| max | 44999.000000 | 149.000000 |
train.csvのほうのデータ全体だと、平均52、25%パーセンタイルが30、中央値47、75%パーセンタイルが70となっており、推論結果と比較してみてもとりあえずは大丈夫そうです。(少なくとも間違ったカラムを連結して桁が違うといったことは無さそうです)
提出!
submission_df.to_csv('submission.csv', index=False, encoding='utf-8')
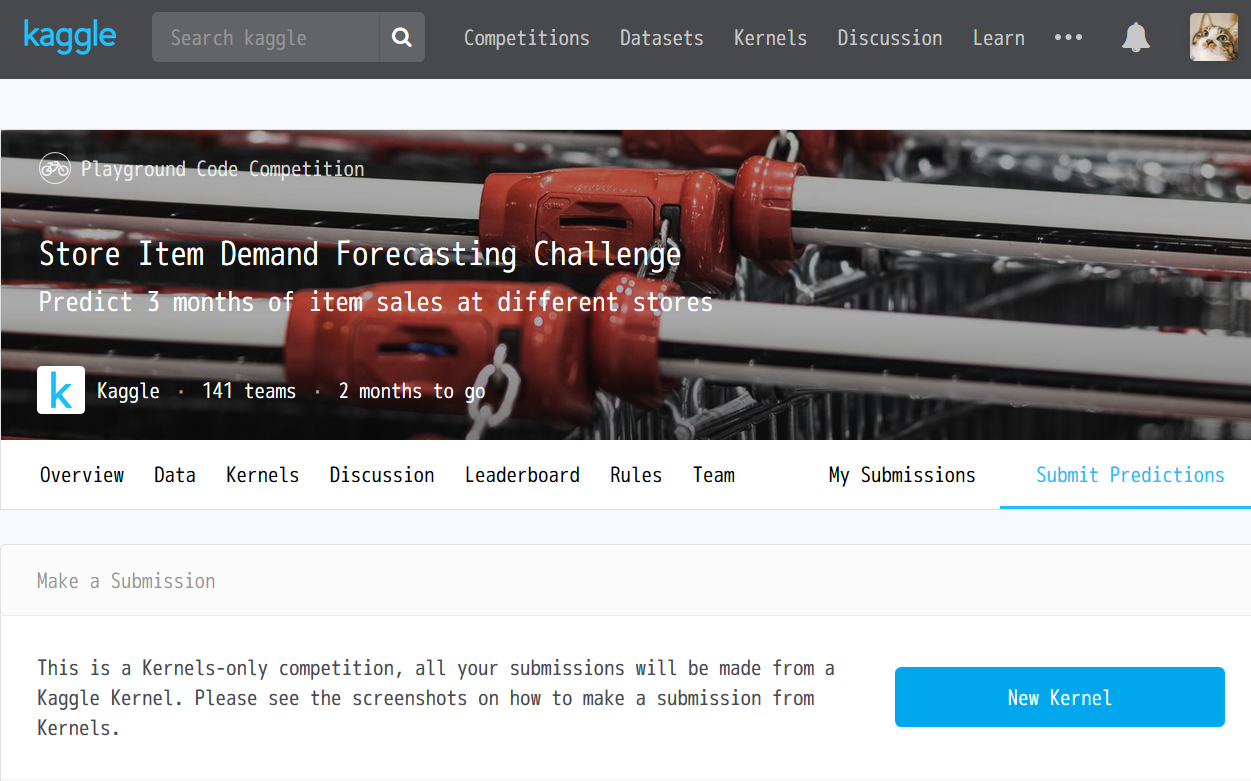
今回のコンテストではCSVのほかにカーネルの提出も必要なので、用意したノートを調整し、そちらも提出します。(やり方を調べつつ・・)
New Kernelのボタンを押すとKaggleのKernelのノートが起動するようです。
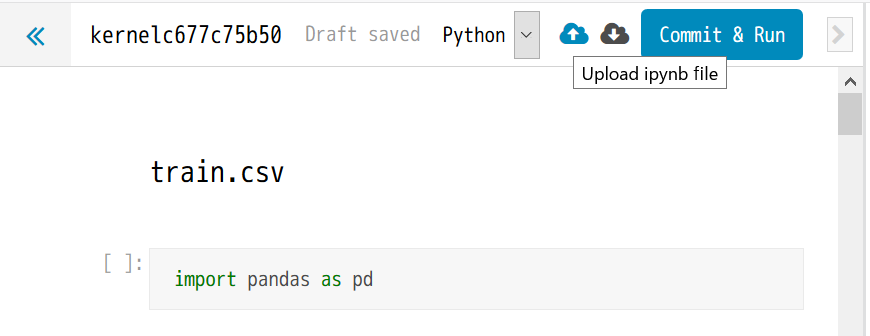
右上の方にある雲のアイコンで、ノートファイルをアップできるので、そちらでここまでに書いたノートをアップします。
データのダウンロードをAPIを利用していたので、そこをKaggle上のカーネルで参照できるように設定します。
右のほうにある Add Dataset ボタンを押すと、コンテストごとのアップしたいデータセットを検索できるようです。(便利!)
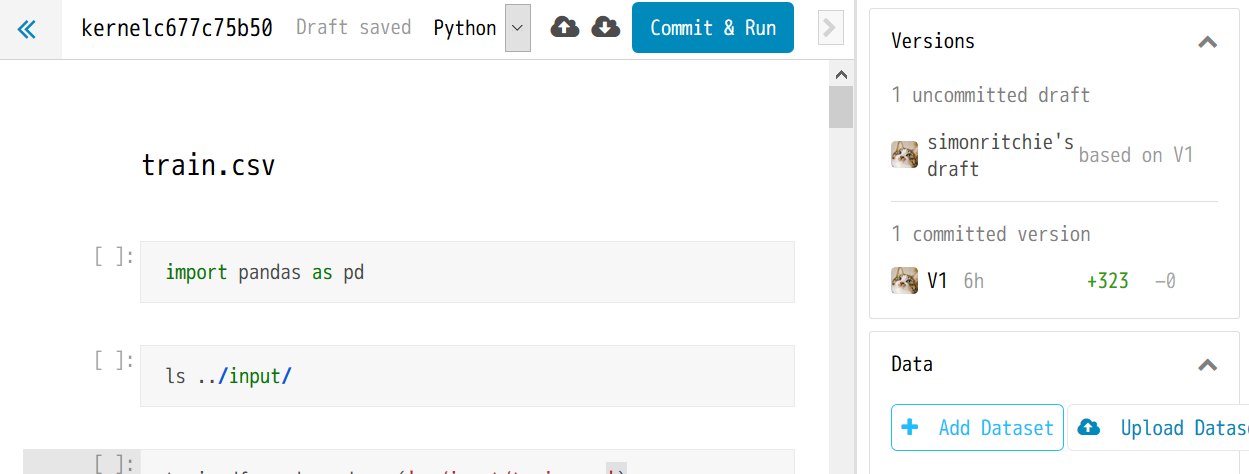
データセットを設定した後は、../input/というフォルダで対象のコンテストのデータセットが格納されるようなので、ノートのCSV読み込みの個所をそちらに調整します。
train_df = pd.read_csv('../input/train.csv')
...
test_df = pd.read_csv('../input/test.csv')
...
sample_submission_df = pd.read_csv('../input/sample_submission.csv')
なお、ProphetやPILなどはすでにKaggleカーネルにインストール済みなようです。楽でいいですね。
また、メモリも17GB、ディスクもそのカーネルで1GBまで、GPUも使えるようで、Colaboratoryレベル・・と驚きましたが、よく調べたらKaggleはGoogleが買収済みなようで・・納得です![]()
このスペックだったら最初からKaggle Kernel上で作業すればよかった。
提出の際にカーネルが実行される必要があり、二度手間なので、次回からは積極的にこちらのカーネルも使っていこうと思います・・
ほかになにか調整が必要であれば調整を行い、そののちにCommit & Runボタンを押します。
なお、提出方法の資料のところに、「Publish」ボタンを押してね、といった記載がありましたが、どうやら古い記述のようで、現在はCommit & Runボタンになっているようです。(しばらくPublishボタンを探してしまった・・)
あとは、保存済みのsubmission.csvを、APIを使って投稿します。(認証周りは前述したデータダウンロード部分のものを参考にしてください。)
!kaggle competitions submit -c demand-forecasting-kernels-only -f submission.csv -m "The Prophet libs predictions"
※補足 : 上記コマンド実行後、「Successfully submitted to Store Item Demand Forecasting Challenge」と出るものの、My Submissionsページのリストに反映されない・・
提出方法のページのスクショが古く該当するUIが見つからないのと、提出関係のページには「Use the kaggle API to make a submission」と説明が・・
現在調査中。
(まあでも、勉強用ですし、ここまででも一旦はいいような気もします・・)