はじめに
UiPathでエージェントを作る際に、重要な機能のひとつがコンテキストグラウンディングです。コンテキストグラウンディングは、いわゆる「RAG(Retrieval-Augmented Generation)」に相当するもので、エージェントが参照できる外部情報を指します。
コンテキストグラウンディングには PDF や Excel、テキストファイルなどを利用できますが、実は画像も扱うことができます。
今回は、画像ファイルをコンテキストグラウンディングとして利用した場合の挙動とその性能について検証してみます。
つかうもの
Automation Cloud(Orchestrator, Studio) Enterprise版
※2025年12月時点
準備
まず、コンテキストグラウンディングを用意します。
コンテキストグラウンディングは、Orchestrator の「ストレージ バケット」にファイルを格納し、その内容を対象として「インデックス」を作成することで簡単に構成できます。
今回のように画像を含む場合は、インデックス作成時に「高度なオプション」を選択します。
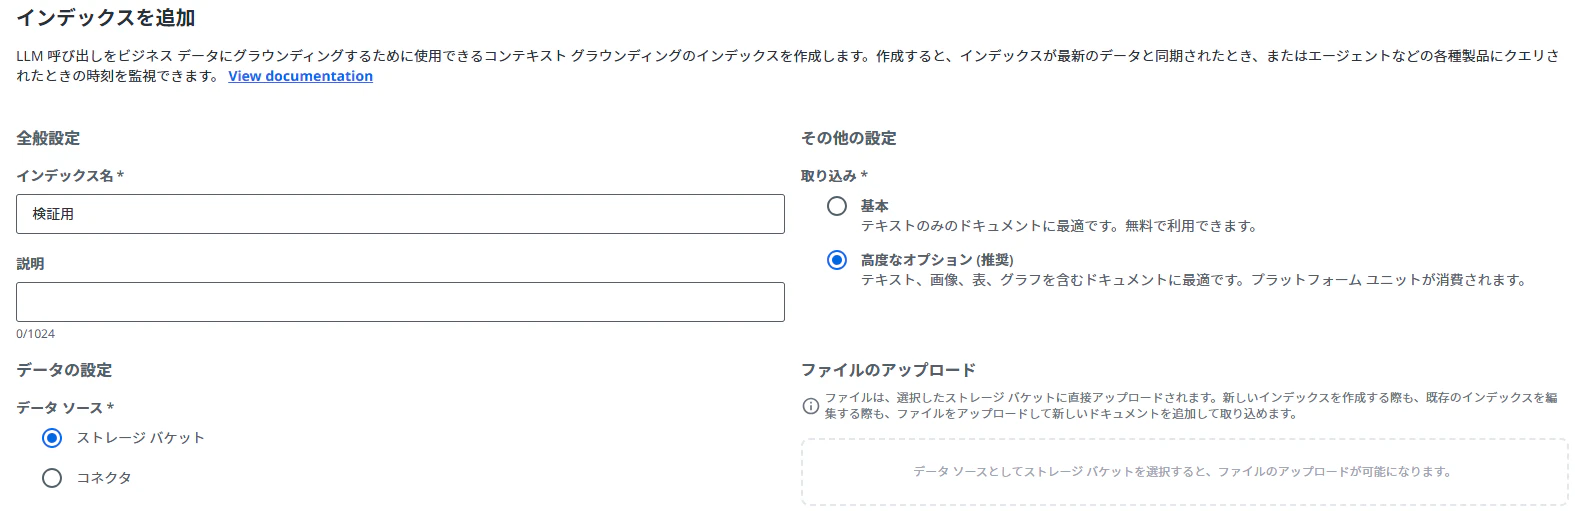
画像情報をコンテキストグラウンディングに取り込む場合は、プラットフォームユニット(またはAIユニット)ライセンスが必要となります。
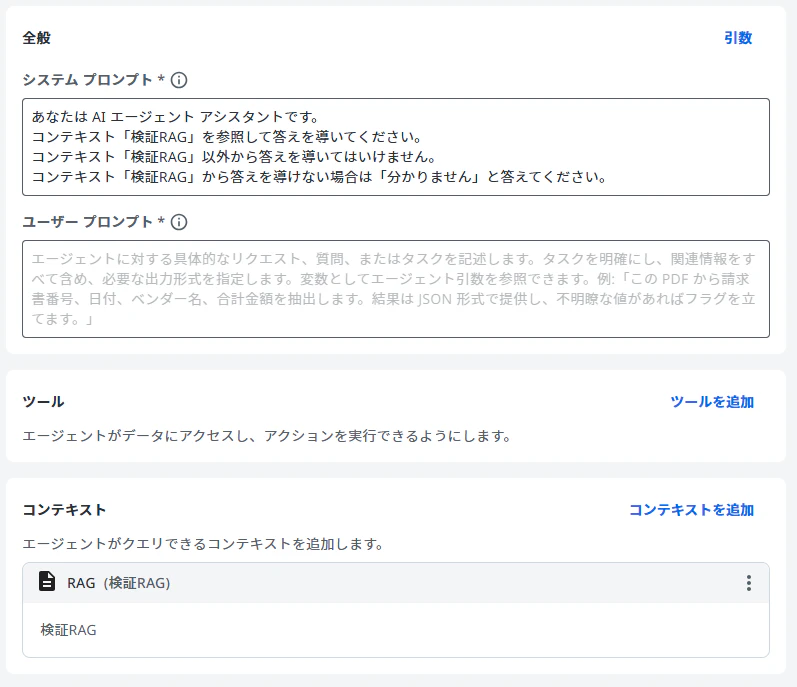
次にエージェントを作成します。
ここではシステムプロンプトとコンテキストのみ設定しておき、ユーザープロンプトは検証時に都度入力する想定とします。
検証
今回は、以下の4パターンで挙動を確認します。
- フロー図
- 写真
- 表
- グラフ
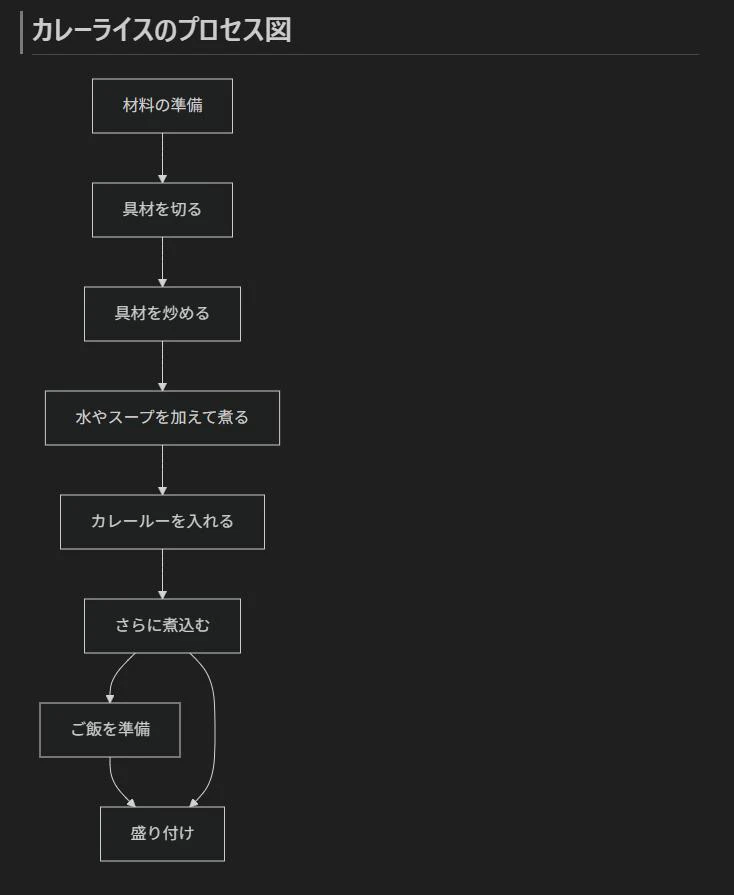
1. フロー図
以下の画像を用意し、コンテキストグラウンディングに登録します。
※画像自体は生成AIで作成し、Mermaid記法ベースのフロー図にしています。
エージェントのユーザプロンプトを以下のように設定して実行します。
カレーライスの作り方で、「盛り付け」の次の工程は?
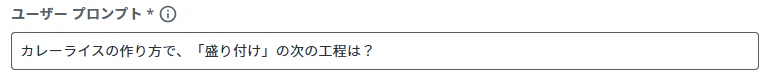
結果は以下のとおりです。
検証RAG(検証1.jpg)の工程図では「盛り付け」が最終工程として記載されており、その次の工程は示されていません。
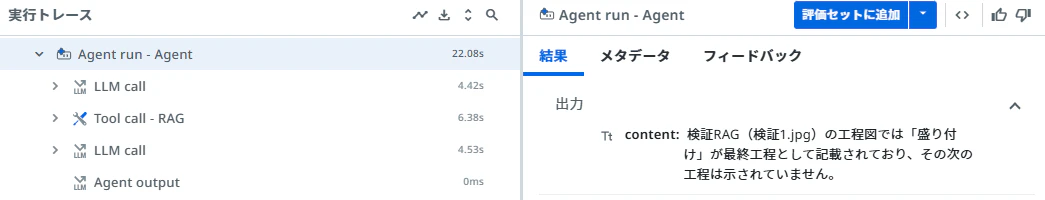
狙いどおりの応答が得られました。
また、エージェント実行ログには、画像をどのように解釈したかがテキストとして出力されていました。
A flowchart detailing the process of making curry rice. It outlines the sequential steps from preparing ingredients to plating, including a concurrent step for cooking rice.
Keywords: Curry rice, Japanese curry, カレーライス, Cooking process, Recipe, 調理工程, Ingredients, 具材, 材料, Curry roux, カレールー, Simmering, 煮込む, 煮る, Plating, 盛り付け, Serving, Rice preparation, ご飯を準備, Rice cookingカレーライスのプロセス図
- 材料の準備 (Preparation of ingredients)
- 具材を切る (Cut ingredients)
- 具材を炒める (Sauté ingredients)
- 水やスープを加えて煮る (Add water or soup and simmer)
- カレールーを入れる (Add curry roux)
- さらに煮込む (Simmer further)
- (Concurrent/Preceding step before plating): ご飯を準備 (Prepare rice)
- 盛り付け (Serving/Plating)
このように、この画像が「カレーライスを作るプロセスを表現したフロー図」であることを正しく認識し、各ステップも妥当に抽出できていることが分かります。
2. 写真
次に、以下の写真画像をコンテキストグラウンディングに登録します。
※こちらも生成AIで作成した画像です。

エージェントのユーザプロンプトを以下のように設定して実行します。
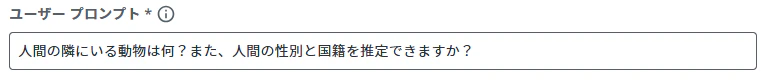
人間の隣にいる動物は何?また、人間の性別と国籍を推定できますか?
結果は以下のとおりです。一部情報は推定できませんでしたが、回答としては妥当な範囲だと思います。
動物: 犬(ゴールデンレトリバー)。性別: 男性。国籍: 分かりません(画像情報から特定不可)。
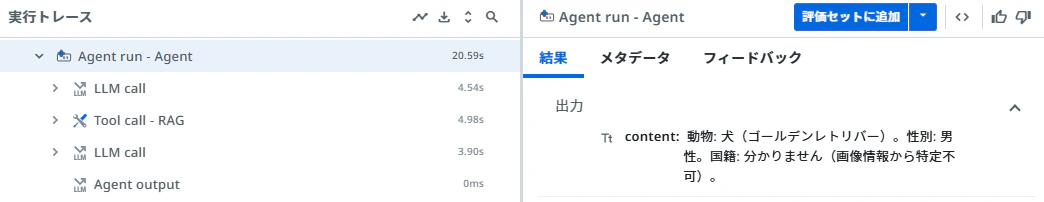
実行ログも確認してみます。人物について国籍や人種などを推定するような記述は含まれていないことが分かります。
Image depicting a man working on a laptop at home with his golden retriever dog resting beside him, surrounded by a cozy living room environment.
Keywords: man, male, person, laptop, computer, notebook, golden retriever, dog, pet, home, living room, indoors, working, remote work, studying, relaxing, cozy, comfortable, hoodie, sweatshirt, casual wear, bookshelf, books, plants, rug, carpet, natural light, windowA man wearing a grey hooded sweatshirt and dark blue jeans is sitting cross-legged on a light-colored rug, working on a silver laptop. He has short dark hair and glasses, and is looking down at the laptop screen. Beside him, a golden retriever dog is lying on the rug, resting its head on its paws and looking forward. In the background, there is a light grey sofa and a wooden bookshelf filled with books and potted plants. Natural light streams in from a window on the left side of the frame.
人物の外見や服装、周辺の家具など、説明可能な範囲にとどまっており、センシティブな推定を行っていない点も確認できます。
3. 表
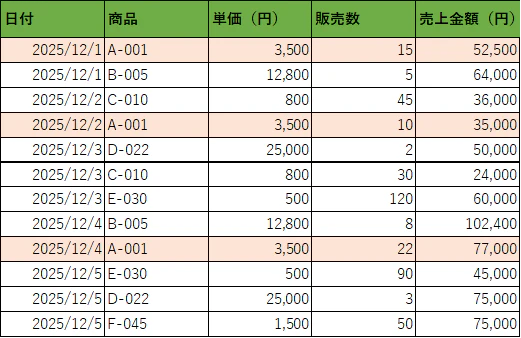
続いて、表形式のデータを画像化したものを使ってみます。
※元データは Excel の表で、それをスクリーンショットにした画像です。
エージェントのユーザープロンプトは次のとおりです。
商品A-001の売上金額合計は?集計期間は12/1~12/3とします。

結果です。こちらは完璧な回答でした!
商品A-001の12/1〜12/3の売上金額は、12/1: 52,500円、12/2: 35,000円(12/3は該当なし)なので、合計 87,500円です。
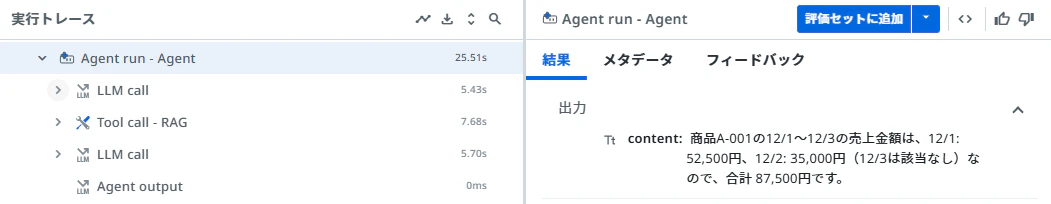
実行ログでは、表の内容がテキストとして正しく抽出されていることが分かります。
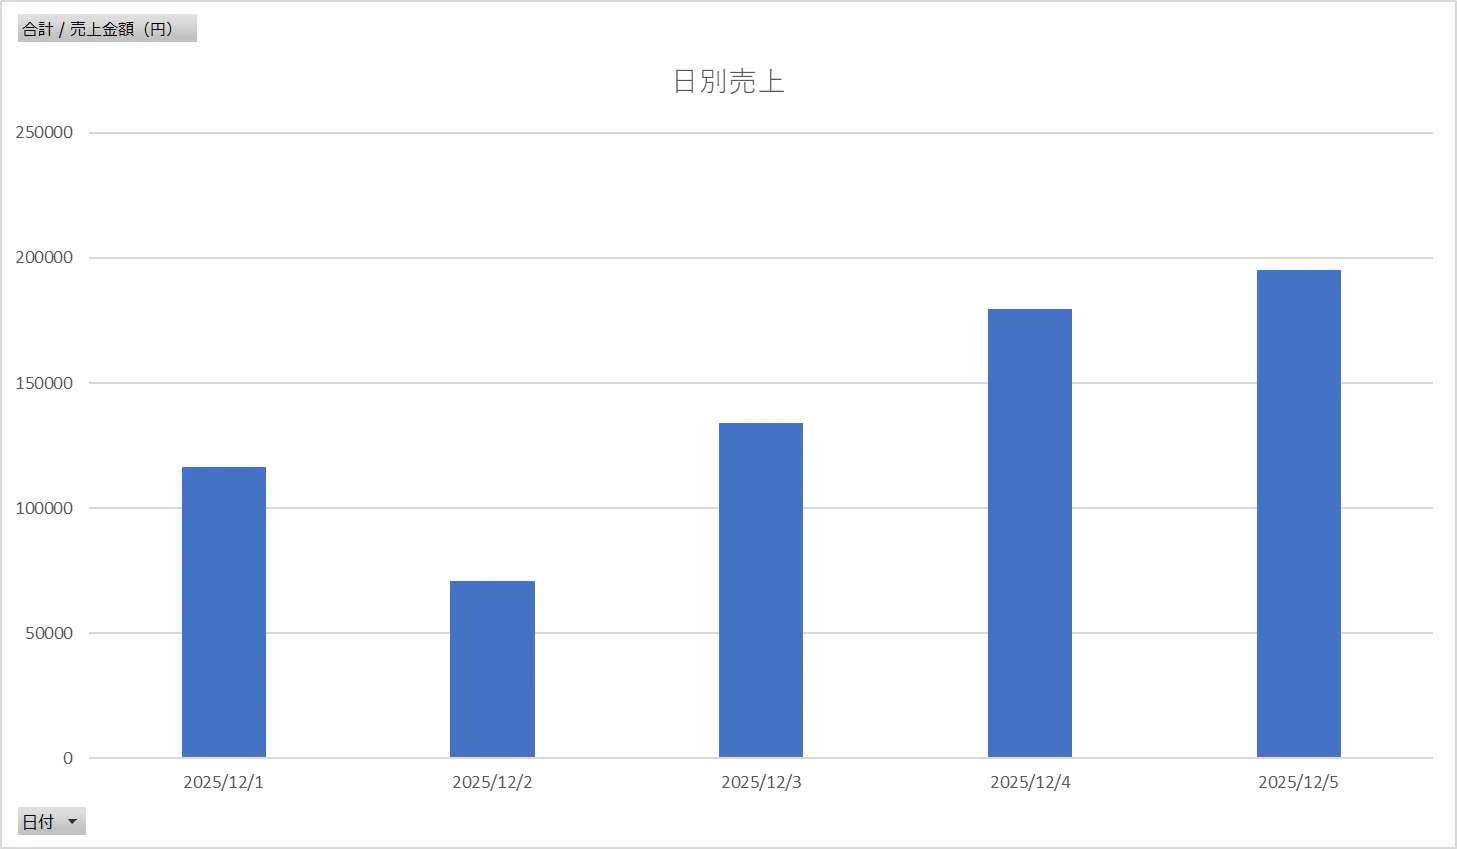
Table of daily product sales records, detailing transaction dates, product identifiers, unit prices, quantities sold, and total sales amounts for each entry.
Keywords: Sales records, Transaction data, Product sales, Sales report, Daily sales, Sales figures, Product codes, Unit price, Quantity sold, Revenue, Sales amountOn 2025/12/1, product A-001 was sold. The unit price was 3,500 yen, and 15 units were sold, resulting in a sales amount of 52,500 yen.
On 2025/12/1, product B-005 was sold. The unit price was 12,800 yen, and 5 units were sold, resulting in a sales amount of 64,000 yen.
On 2025/12/2, product C-010 was sold. The unit price was 800 yen, and 45 units were sold, resulting in a sales amount of 36,000 yen.
On 2025/12/2, product A-001 was sold. The unit price was 3,500 yen, and 10 units were sold, resulting in a sales amount of 35,000 yen.
On 2025/12/3, product D-022 was sold. The unit price was 25,000 yen, and 2 units were sold, resulting in a sales amount of 50,000 yen.
On 2025/12/3, product C-010 was sold. The unit price was 800 yen, and 30 units were sold, resulting in a sales amount of 24,000 yen.
On 2025/12/3, product E-030 was sold. The unit price was 500 yen, and 120 units were sold, resulting in a sales amount of 60,000 yen.
On 2025/12/4, product B-005 was sold. The unit price was 12,800 yen, and 8 units were sold, resulting in a sales amount of 102,400 yen.
On 2025/12/4, product A-001 was sold. The unit price was 3,500 yen, and 22 units were sold, resulting in a sales amount of 77,000 yen.
On 2025/12/5, product E-030 was sold. The unit price was 500 yen, and 90 units were sold, resulting in a sales amount of 45,000 yen.
On 2025/12/5, product D-022 was sold. The unit price was 25,000 yen, and 3 units were sold, resulting in a sales amount of 75,000 yen.
On 2025/12/5, product F-045 was sold. The unit price was 1,500 yen, and 50 units were sold, resulting in a sales amount of 75,000 yen.
単純な OCR というより、「どの列が何を表しているか」まで把握したうえで構造化して説明している点が印象的です。
4. グラフ
最後に、グラフ画像を使ったパターンです。
※こちらも Excel のグラフをスクリーンショットにしたものです。
エージェントのユーザープロンプトは次のとおりです。
日別売上で最も売り上げが少ない日は?また、売上推移の傾向は?

結果です。グラフの意味をきちんと読み取ったうえで説明してくれていることが分かります。
日別売上が最も少ない日は、2025/12/2(約70,000円)です。売上推移の傾向は、12/1(約118,000円)→12/2で一度大きく落ち込んだ後、12/3(約140,000円)→12/4(約180,000円)→12/5(約195,000円)と右肩上がりで増加しています。
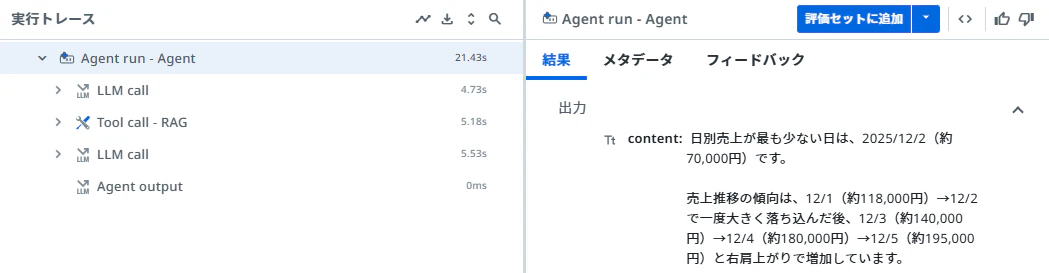
実行ログは次のとおりです。
Bar chart displaying daily sales amounts in Japanese Yen for the first five days of December 2025. Keywords: Daily sales, sales figures, sales performance, Revenue, income, earnings, Bar chart, graph, data visualization, December 2025, date, timeline, Yen, currency, Japanese currency Chart Title: 日別売上 (Daily Sales) Y-axis: 合計 / 売上金額 (円) (Total / Sales Amount (Yen)) X-axis: 日付 (Date) Daily Sales Data: - On 2025/12/1, the sales amount was approximately 118,000 yen. - On 2025/12/2, the sales amount was approximately 70,000 yen. - On 2025/12/3, the sales amount was approximately 140,000 yen. - On 2025/12/4, the sales amount was approximately 180,000 yen. - On 2025/12/5, the sales amount was approximately 195,000 yen.
バーの高さを推定してくれているのが分かります。
おわりに
今回は、UiPath のコンテキストグラウンディングで画像を扱った場合の挙動を、フロー図・写真・表・グラフの4パターンで確認しました。
社内文書などでは、テキストと画像が混在したドキュメントが多く存在します。こうしたドキュメントをストレージバケットに格納し、コンテキストグラウンディングとして活用することで、RAG ベースのエージェント回答の精度向上が期待できそうです。
今後は、テキストと画像が混ざった実際の社内資料を対象にした場合の精度検証や、プロンプト設計の工夫なども試していきたいところです。