はじめに
scikit learnにはdigitsと呼ばれる0~9までの数字の手書きの画像データが含まれています。
これを多変量分析の一種である主成分分析(PCA)を利用して可視化するという事例は多数紹介されています。たとえばScikit-learnでPCAなど。
ただし、可視化は大抵第2主成分までの2次元データである例がほとんどでした。ここでは第3主成分までなんとか可視化させてみたいと思います(ネタ)。
なお主成分分析に関しては意味がわかる主成分分析がわかりやすかったと思います。
digitsのデータの可視化
ライブラリのimportから画像データの可視化までを行います。
# -*- coding: utf-8 -*-
import numpy as np
from sklearn import datasets
from sklearn.decomposition import PCA
import matplotlib.pyplot as plt
from mpl_toolkits.mplot3d import Axes3D

# digitsのデータをダウンロード
data = digits["data"]
target = digits["target"]
target_name = digits["target_names"]
images = digits["images"]

# matplotlibでdigitsのデータの可視化
for i in range(9):
    plt.subplot(3,3,1+i)
    plt.imshow(images[i,:,:])
    plt.gray()
plt.show()
digitsは8×8の64画素のデータが1797画像納められています。
全部可視化すると大変なので最初の9個ほどを描画しています。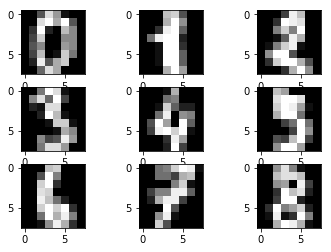
ちなみにdigits["data"]では配列が(1797,64)となっており、機械学習にそのまま適用しやすいデータとなっており、digits["images"]では(1797,8,8)の配列でmatplotlibで描画しやすい形式になっています。
寄与率の計算と2次元プロット
主成分分析を行って、成分毎の寄与率を計算します。今回の例に限らず主成分分析を使う際には、必ず寄与率は見ておきたいものです。
data /=16.
# principal component analysis
pca = PCA()
pca.fit(data)
data = pca.transform(data)

# pcaの寄与率計算
contribution = pca.explained_variance_ratio_
# 寄与率を累積和に変更
contribution = np.cumsum(contribution)
# 最初に0を追加
contribution = np.append(0,contribution)

# 寄与率の描画
plt.plot(contribution,marker="o")
plt.xlim(0,65)
plt.ylim(0,1.1)
plt.show()

# 第2成分までscatter
for i in target_name:
    index =np.where(target==i)
    plt.scatter(data[index,0],data[index,1],label=str(i),alpha=0.5,s=20)
plt.legend(loc=3)
plt.xlabel("First Component")
plt.ylabel("Second Component")
plt.xlim(-3,3)
plt.ylim(-2,2)
plt.show()
寄与率は以下のグラフのようになります。
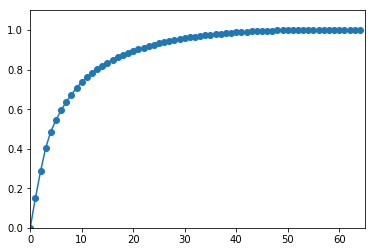
縦軸が寄与率の累積和になります。
第1主成分では15%,第2主成分までで28%,第3主成分まででは40%ほどの寄与率になります。
第2主成分までをプロットすると
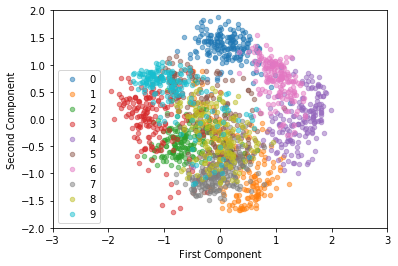
実際に2次元プロットしてみるとほとんどの数字の境界が視認できますが、8の数字と9の数字は領域が不明瞭な感じはします。やはり2次元のプロットでは物足りないですね。
30次元ぐらいを直感的に可視化する手段があればよいのですが、流石に無理なので3次元で我慢します。
3次元のプロット
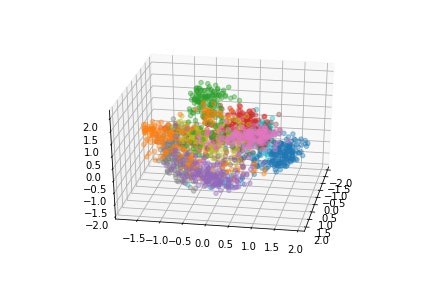
matplotlibで3次元のグラフを作ってみます。
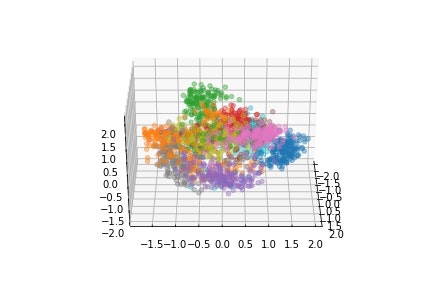
単に作るだけでは面白くないので3Dを描画する角度をangleの変数で1°ずつ変更したグラフを作ります。次にグラフを保存しておいて、最後にパラパラ漫画の要領で少しずつ角度が変化する動画を編集します。matplotlibでも動画を作成出来るらしいですが、今回はOpenCVを使って動画を作成します(単純にOpenCVの使い方に慣れているだけ)。
まずは3次元画像の生成、保存まで。
for angle in range(0, 180):
    fig = plt.figure()
    ax = fig.add_subplot(111, projection="3d")
    ax.view_init(30, angle)
    for i in target_name:
        index =np.where(target==i)
        ax.scatter(data[index,0], data[index,1], data[index,2],alpha=0.4)
    #保存する名前を指定
    name = str(angle)+".jpeg"
  #画像の保存
    plt.savefig(name)
    plt.show()
まあまあ3次元のように見えます。
次にOpenCVを使用して保存した0~180°までの画像順番に呼び出しして、動画を作成します。
# -*- coding: utf-8 -*-
import cv2
import numpy as np
# 動画のフレームレートの解像度を指定
fps = 10
size = (432,288)

fourcc = cv2.VideoWriter_fourcc(*'XVID')
out = cv2.VideoWriter("sample.avi",fourcc, fps, size)

for i in range(180):
    name = str(i)+".jpeg"
    #画像の読込
    frame = cv2.imread(name)
    out.write(frame)
out.release()
作成した動画
まあまあ、3次元に見える動画になりました。実用性は皆無ですが。
一次元の場合
オマケ,第1主成分だけHistを使って描画した場合
for n in target_name:
    #target_nameと同じ名前を持つtargetデータのインデックスを作成
    index =np.where(target==n)
    plt.hist(data[index,0].T,
             range=(-2,2),
             bins=40,
             histtype="stepfilled",
             label=str(n),
             alpha=0.3)
plt.xlim(-3,2.5)
plt.legend(loc=3)
plt.show()
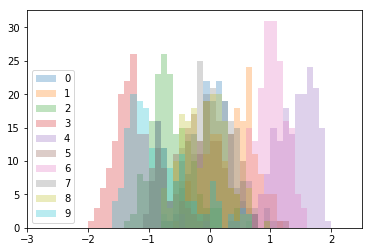
1次元でここまでわかるのかという感じではあるが、実用的には流石に次元圧縮しすぎできつい。
画像の判別の前処理に主成分分析を使われることもありますし、画像を扱う人も主成分分析の挙動は押さえておきたいものです。
