Metalのデバッグに関連する機能やツールの使い方を本記事にまとめていこうと思います。
GPUフレームキャプチャ
XcodeにビルトインされているMetalのデバッグ機能。
Metal利用アプリを実行中、カメラ型のアイコン("Capture GPU Frame")を押すと、その瞬間のGPUフレームがキャプチャされ、次のような画面になる。

非常に高機能なので、詳細はそれぞれの項にて。
ラベル
Metalのクラスやプロトコルは文字列型のlabelというプロパティを備えているものが多くある。
例:
MTLCommandQueue-
MTLResource-
MTLBuffer,MTLTexture
-
MTLFunctionMTLRenderPipelineDescriptorMTLCommandBufferMTLCommandEncoder
たとえば次のようにラベルをつけておいて、
commandQueue.label = "HogeCommandQueue"
texture.label = "HogeTexture"
vertexBuffer.label = "HogeVertexBuffer"
texCoordBuffer.label = "HogeTexCoordBuffer"
vertexFunction.label = "HogeVertexFunction"
fragmentFunction.label = "HogeFragmentFunction"
descriptor.label = "HogeRenderPipeline"
commandBuffer.label = "HogeCommandBuffer"
renderEncoder.label = "HogeRenderCommandEncoder"
XcodeでGPUフレームをキャプチャすると、ナビゲータ内でのコマンドエンコーダやリソース名に、自分がつけたラベルが表示されるので、識別しやすくなる。

ラベルは Instruments で見た場合にもこんな感じで適用されている。

というわけでパスが複雑な処理を行う場合はラベルをつけておくとデバッグやパフォーマンスにおけるボトルネックの特定が捗る。
デバッググループ
MTLCommandEncoderはiOS 8から、MTLCommandBufferはiOS 11から以下のようなメソッドが使える。
public func pushDebugGroup(_ string: String)
public func popDebugGroup()
push〜popの間にそのコマンドエンコーダやコマンドバッファに対して行った処理が、XcodeでのGPUフレームキャプチャ画面におけるナビゲータ上にフォルダアイコンでまとめられて表示される。
commandBuffer.pushDebugGroup("HogeCommandBufferDebugGroup")

guard let renderEncoder = commandBuffer.makeRenderCommandEncoder(descriptor: renderPassDescriptor) else {return}
renderEncoder.label = "HogeRenderCommandEncoder"
renderEncoder.pushDebugGroup("HogeCommandEncoderDebugGroup")
renderEncoder.insertDebugSignpost("HogeDebugSignpost")

guard let renderPipeline = renderPipeline else {fatalError()}
renderEncoder.setRenderPipelineState(renderPipeline)
renderEncoder.setVertexBuffer(vertexBuffer, offset: 0, index: 0)
renderEncoder.setVertexBuffer(texCoordBuffer, offset: 0, index: 1)
renderEncoder.setFragmentTexture(texture, index: 0)
renderEncoder.drawPrimitives(type: .triangleStrip, vertexStart: 0, vertexCount: 4)
renderEncoder.endEncoding()

commandBuffer.present(drawable)
commandBuffer.commit()
commandBuffer.waitUntilCompleted()

commandBuffer.popDebugGroup()
renderEncoder.popDebugGroup()

insertDebugSignpost
MTLCommandEncoderのメソッド。
public func insertDebugSignpost(_ string: String)
公式リファレンスによると、
Inserts a string into the command buffer.
When debugging with Xcode, this string may appear.
ちょっと用途がよくわからない。。コマンドバッファへのエンコードがうまくいってるかを確認するため?
シェーダの処理毎のパフォーマンス確認
ナビゲータの右上の方にあるアイコンをクリックして「View Frame By Performance」を選択。(デフォルトは「View Frame By Call」)
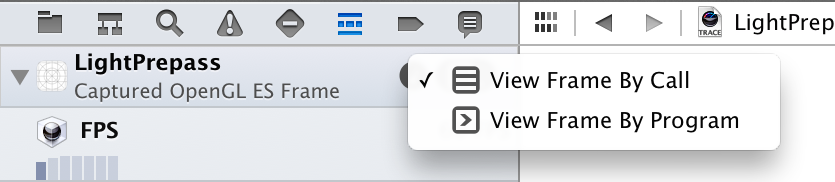
リストからパフォーマンスを見たいシェーダを選択すると、ソース上に処理時間のパーセンテージが表示される。

(表示されないケースもあった。理由は分かり次第追記します)
Remarks
ナビゲータから"Pipeline Statistics"を選択すると、"Remarks"という欄に、warning的な事項が表示される。

Instruments

参考資料
書籍
-
Metal入門 - shu223 - BOOTH
- 日本語では初のMetal解説書
公式ドキュメント
-
Instruments User Guide: Profiling Templates
- Metal System Trace Profiling Template
- Instruments User Guide: Metal Application Instrument
- Instruments User Guide: GPU Hardware Instrument
- Instruments User Guide: Graphics Driver Activity Instrument
- Instruments User Guide: Displayed Surfaces Instrument
- Metal Tools
-
Specialized Debugging Workflows
- Debugging Metal and OpenGL ES
WWDCセッション
一次情報としてリファレンスだけでは不十分で、WWDCのセッションでしか話されてない情報も多々ある。
そして最新年度のだけ観れば十分かというと全然そんなこともなく、たとえばInstrumentsのMetal System Traceについてのまともな解説は2015年まで遡らないとなかったりするので、「どのセッションでどの(デバッグ関連の)話をしているか」をここに整理しておく。
- Metal 2 Optimization and Debugging (WWDC17)
-
Adopting Metal, Part 1 (WWDC16)
- デバッググループの話がちらっと出てくる
-
Metal Performance Optimization Techniques (WWDC15)
- InstrumentsのMetal System Traceの解説(この年が初登場なのでがっつりデモつきの解説)
-
Working with Metal: Advanced (WWDC14)
- XcodeのGPUフレームキャプチャからパフォーマンスのボトルネックを発見するデモ
-
Working with Metal: Overview (WWDC14)
- XcodeのMetalツール(フレームキャプチャ)の概要だけ。目新しい情報ではない
- (Metal全体の設計思想が語られているのでその点では今観ても有用ではある)