

Hello
I am back, with some reserch projects.
Intro
The PROMPT-X office located somewhere in Tokyo have one issue that is the source of conflict within the office. You might be wondering "What is that problem?" The problem is...
IT'S WAY TOO HOT DURING THE SUMMER!
The room 503 is located on the north western corner of the office building.
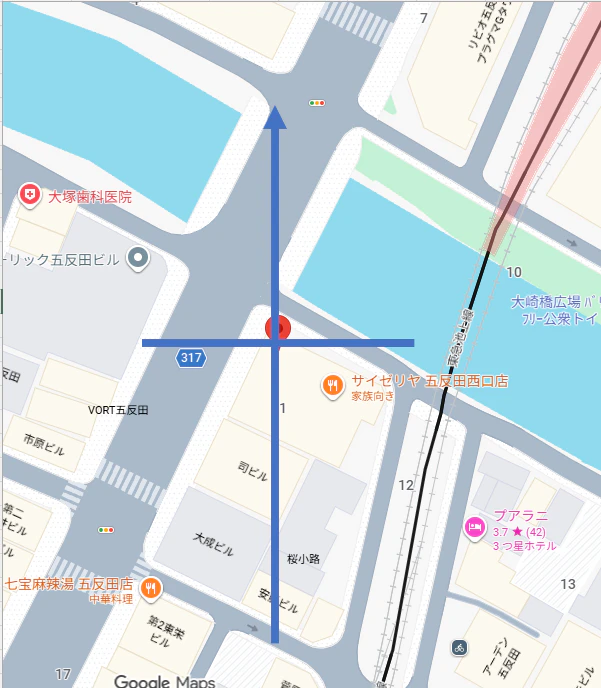
(Source: Google maps)
During the spiring, the office offers beautiful sight from the large window placed in the room, this however changes during the summer where the toom temperature turns unbearable, as if the office became a convection oven. The seat placement, where obviously everyone want the seat under the air conditioner became source of unending conflict between the employees. In this article, I will attempt to gather insights on the heat differences in the office.
But how?
This experiment utilizes three sensors located in the different seat of the office and one temperature sensor between the window and heat reflecting mat as a control representing temperature of office without the air conditioning. Senosr placement plan are shown below.
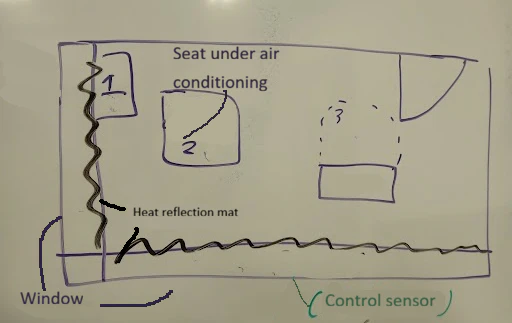
The reader that read my last article may have noticed, that control sensor are actually the sensor I have used for previous experiment.
Methods
- Gather sensors in one single place, under same condition
- Calculate difference between sensors
- Calilbrate the sensors based on the differences
- Places senosors across the office
- Gather the data
- Analyse the data
- Success!!
Hypothesis
Hypothesis of the experiment is:
If the sensor is placed closer to the window, the temperature readings will be higher.
Callibration
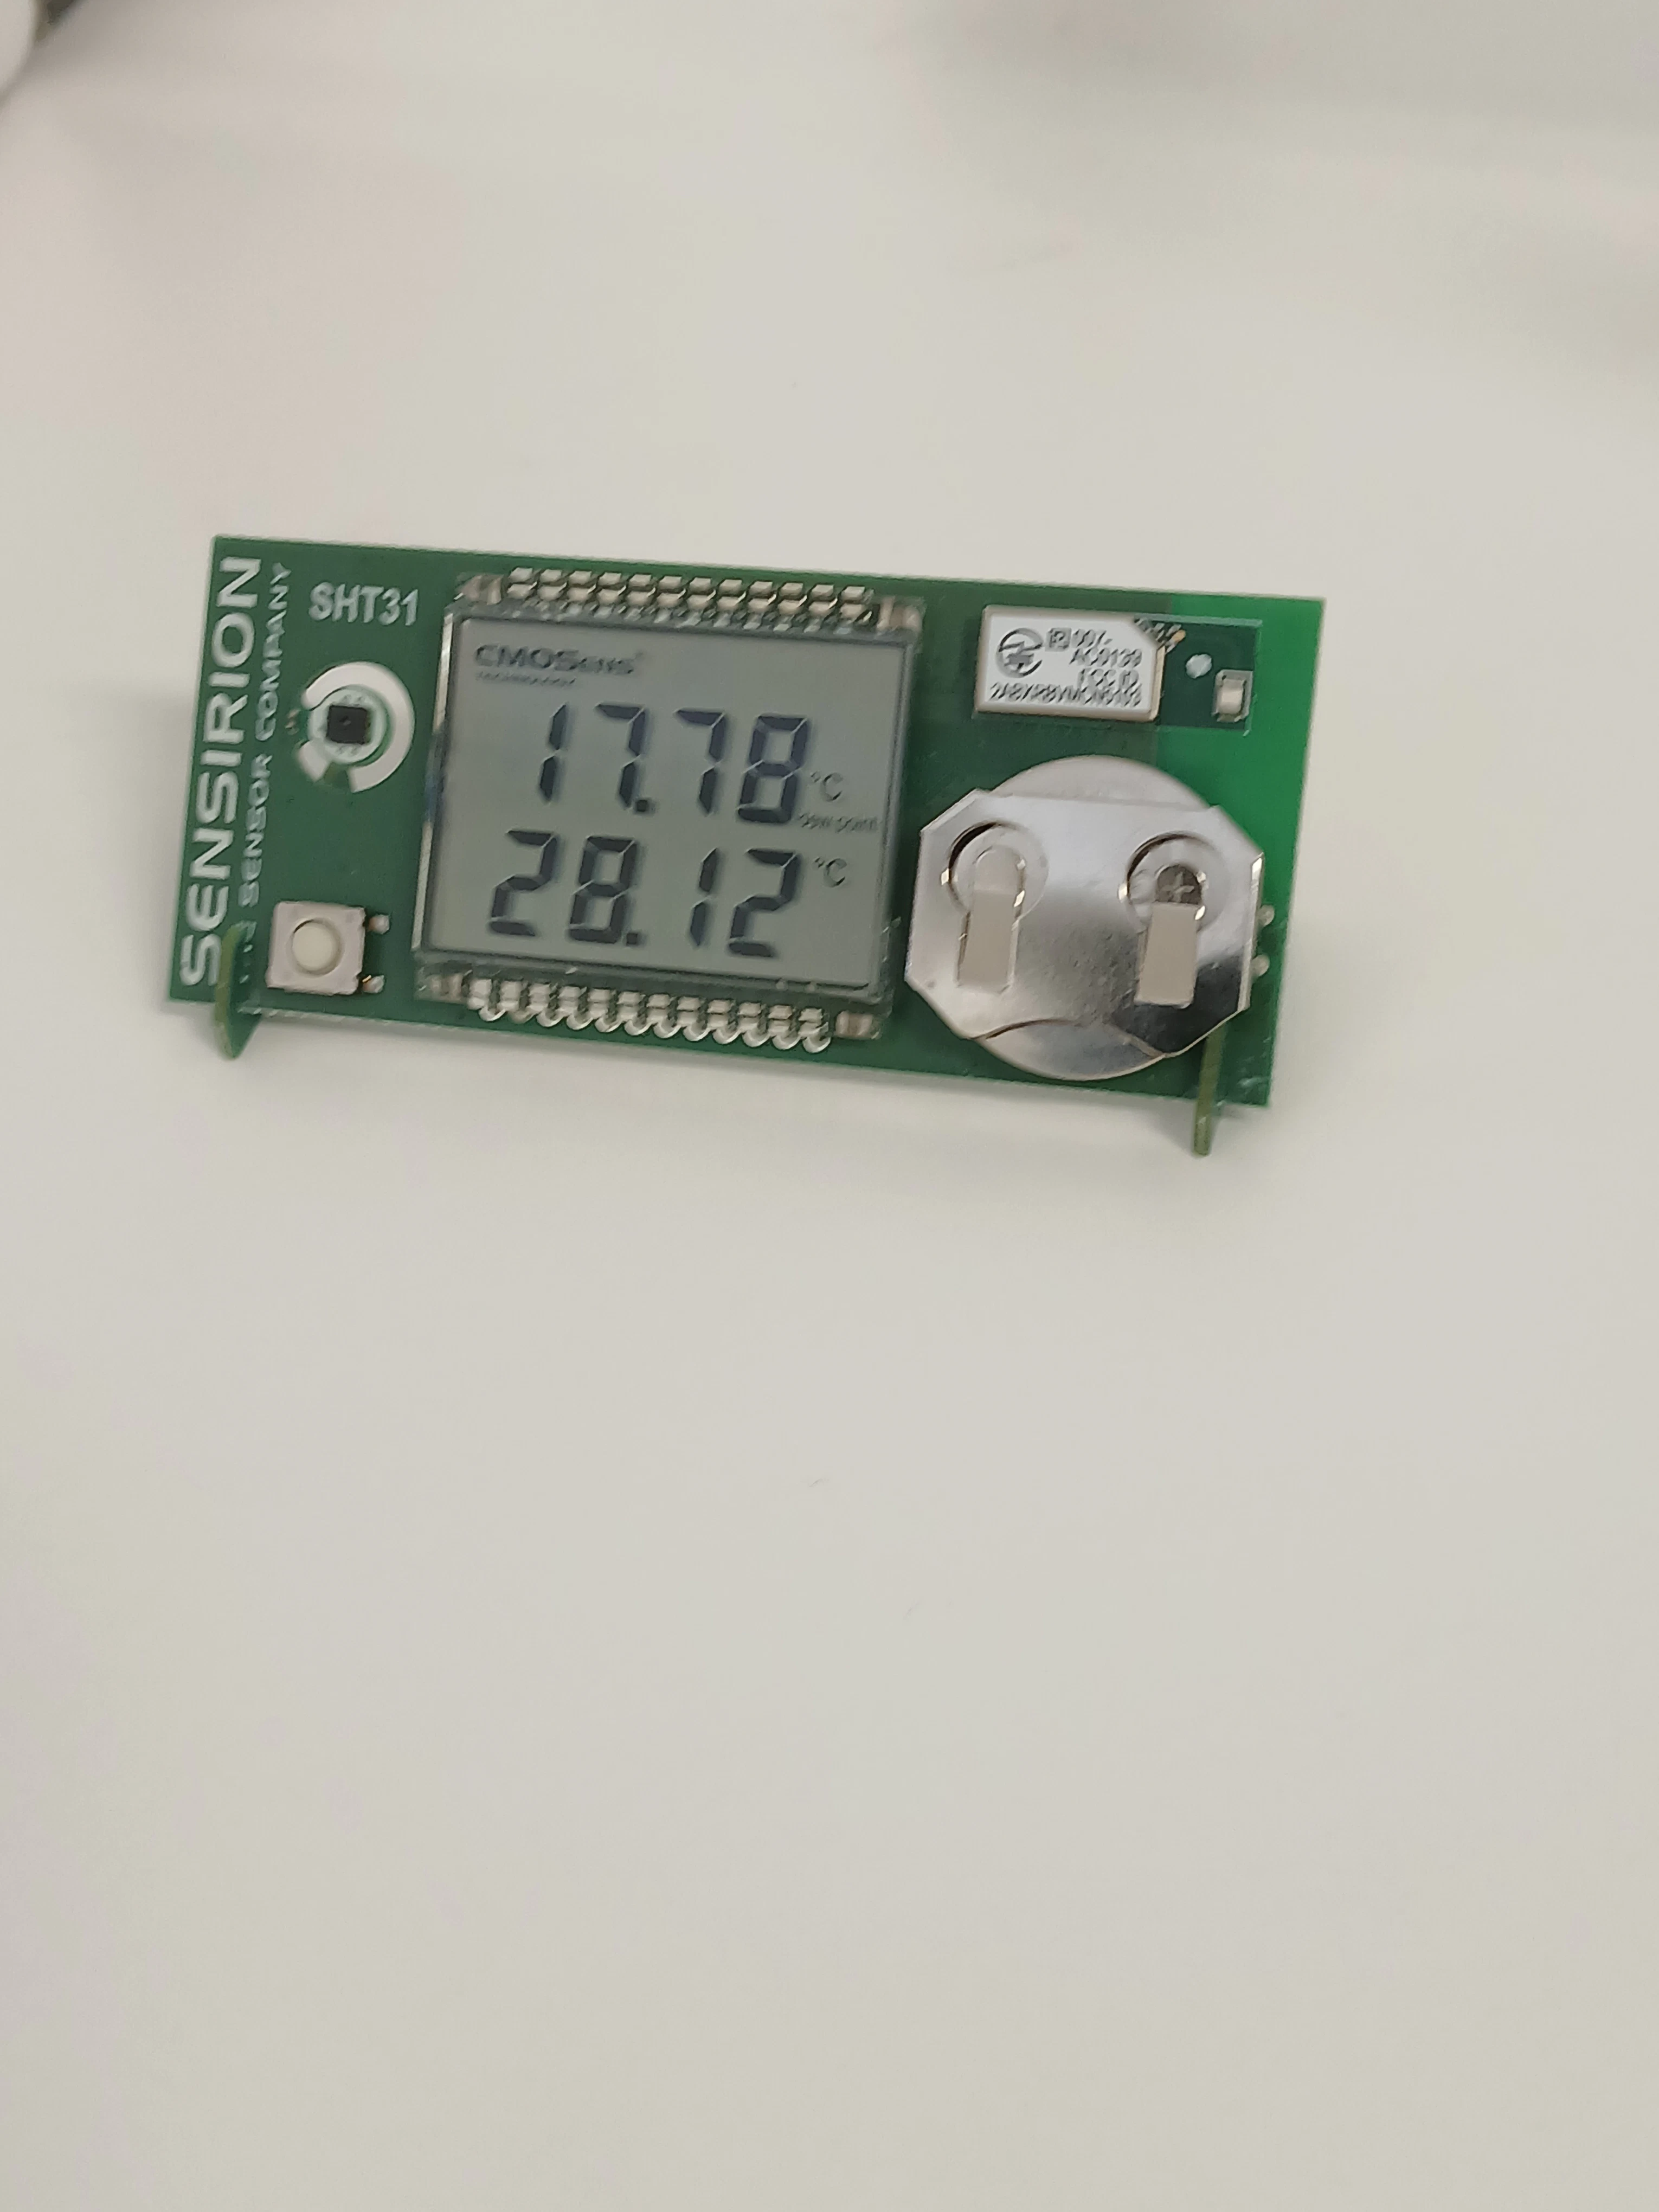
I gather the sensors
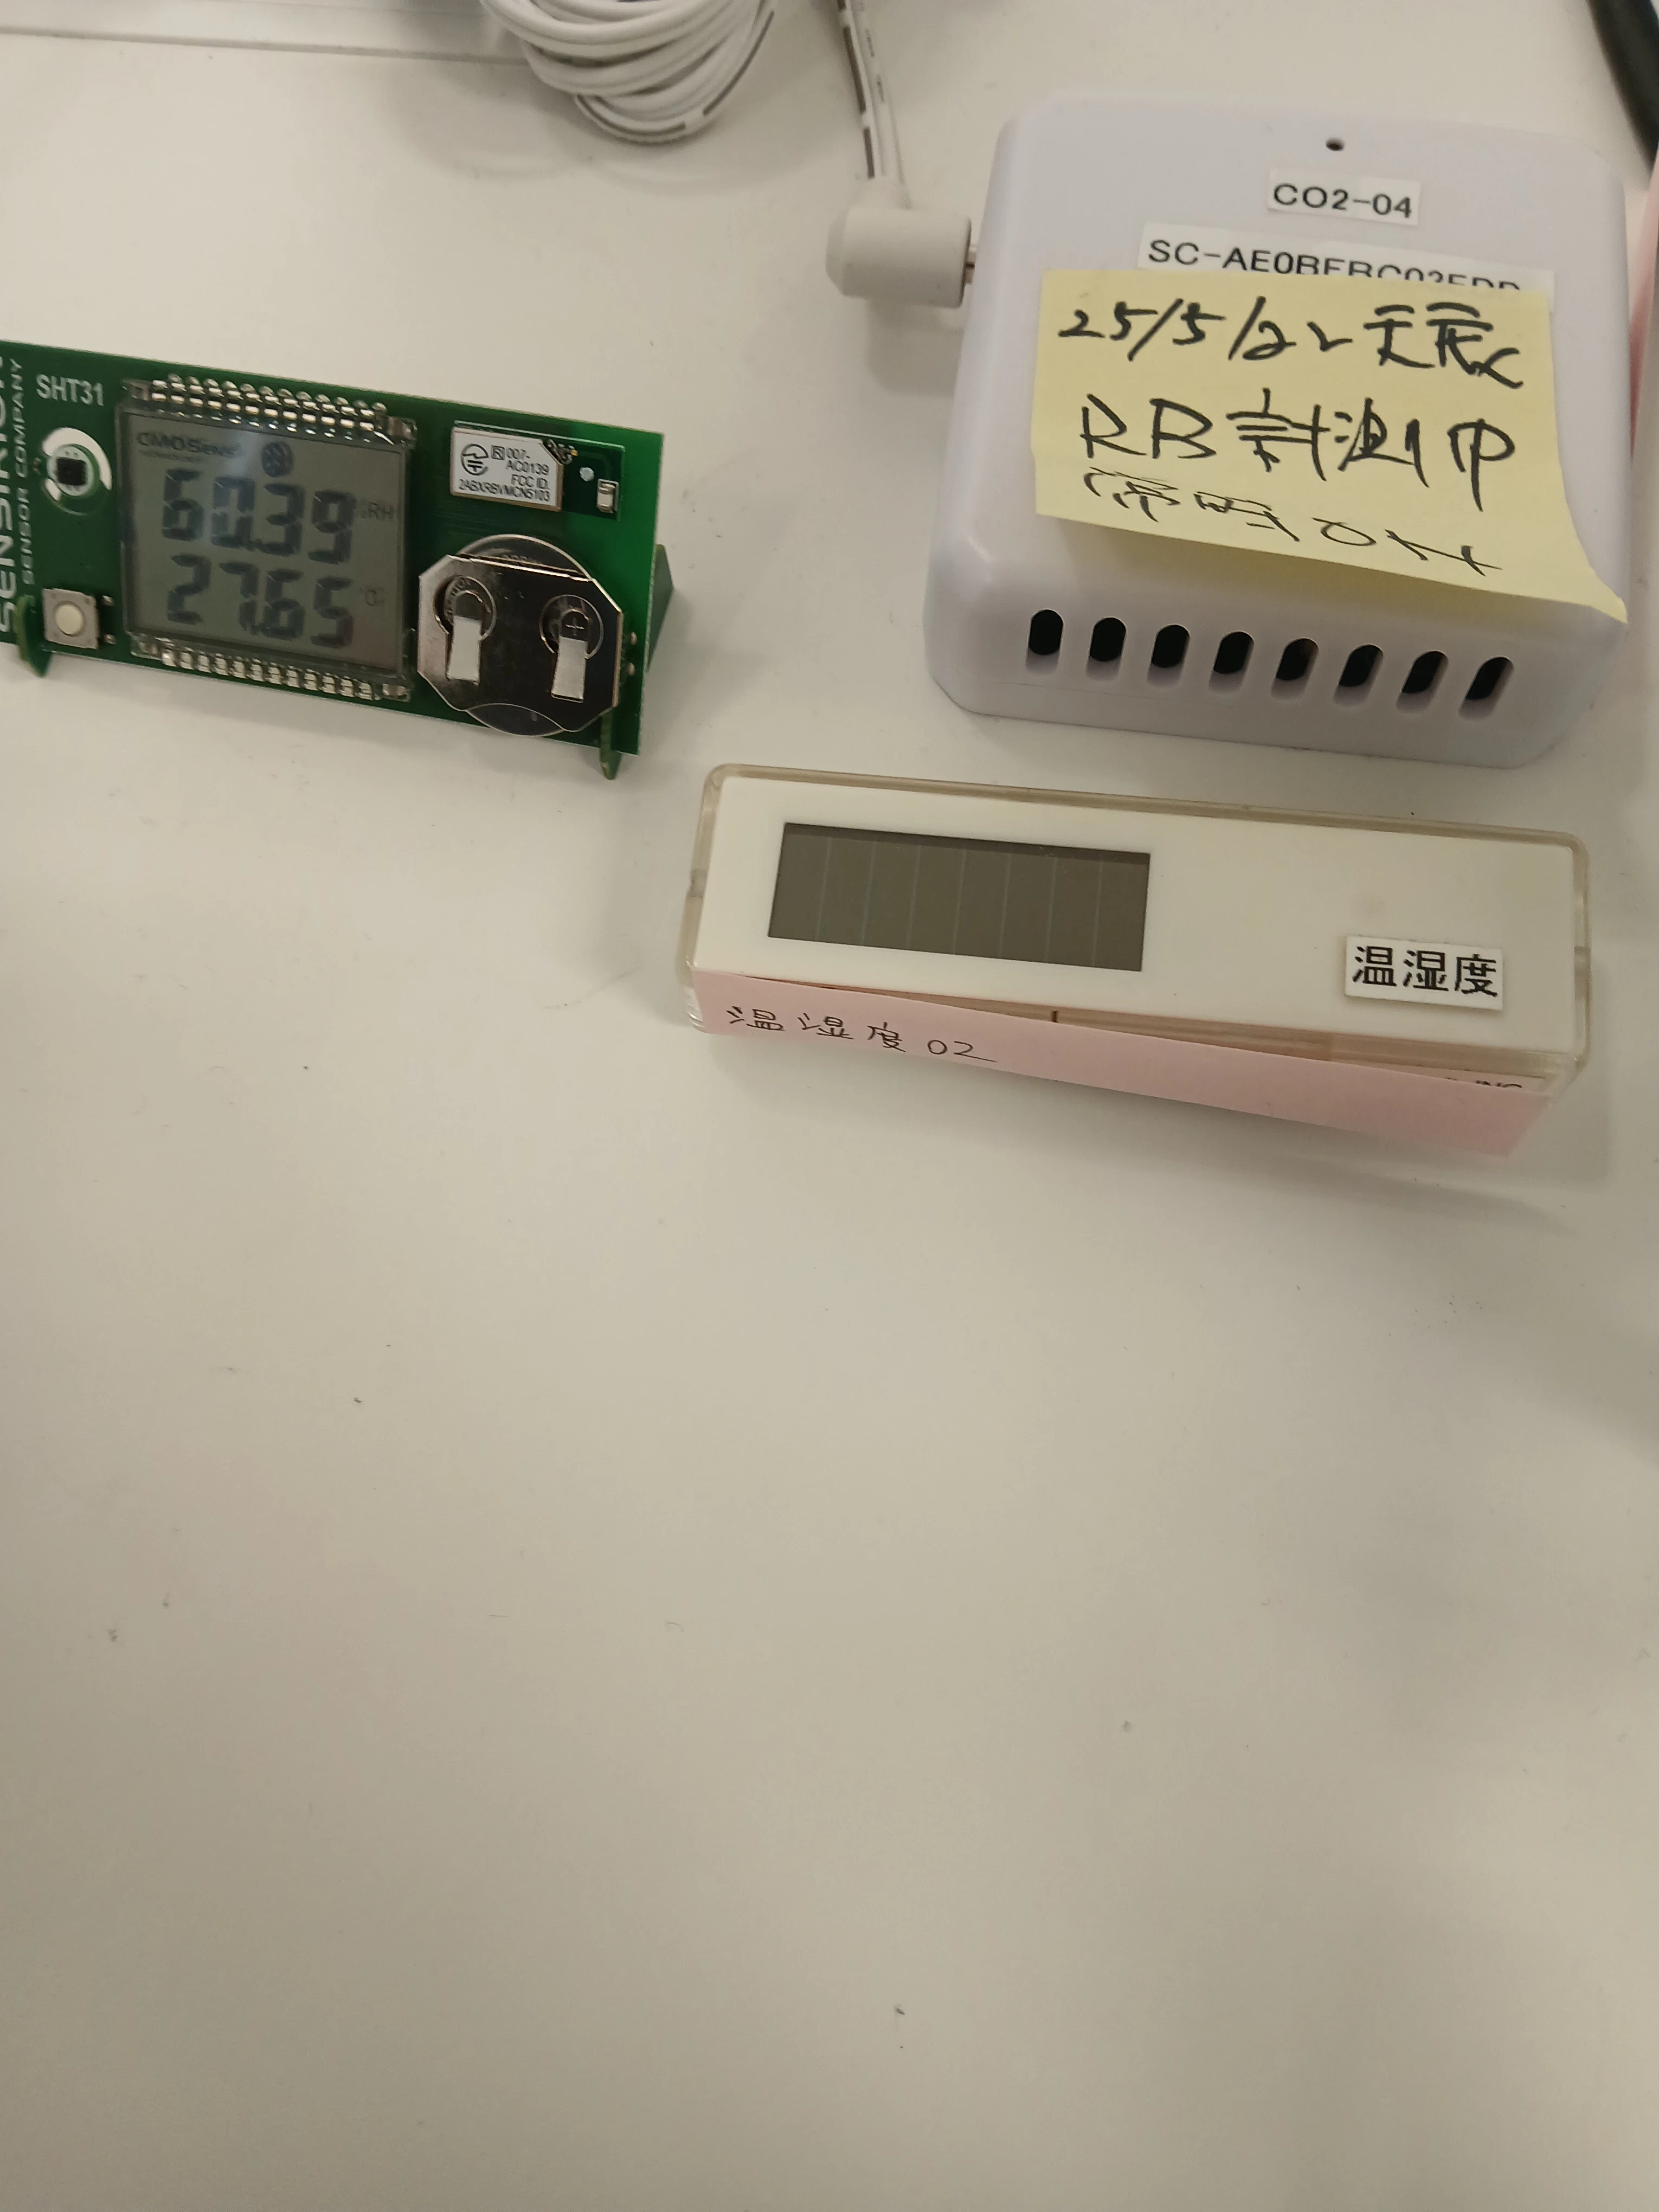
(I will call sensor with pink note attatched sensor 1, one with yellow note sensor 2, and the one with just bare circuit board sensor 3)
Now here is the data from same place. Which I am going to use to callibrate the sensors.
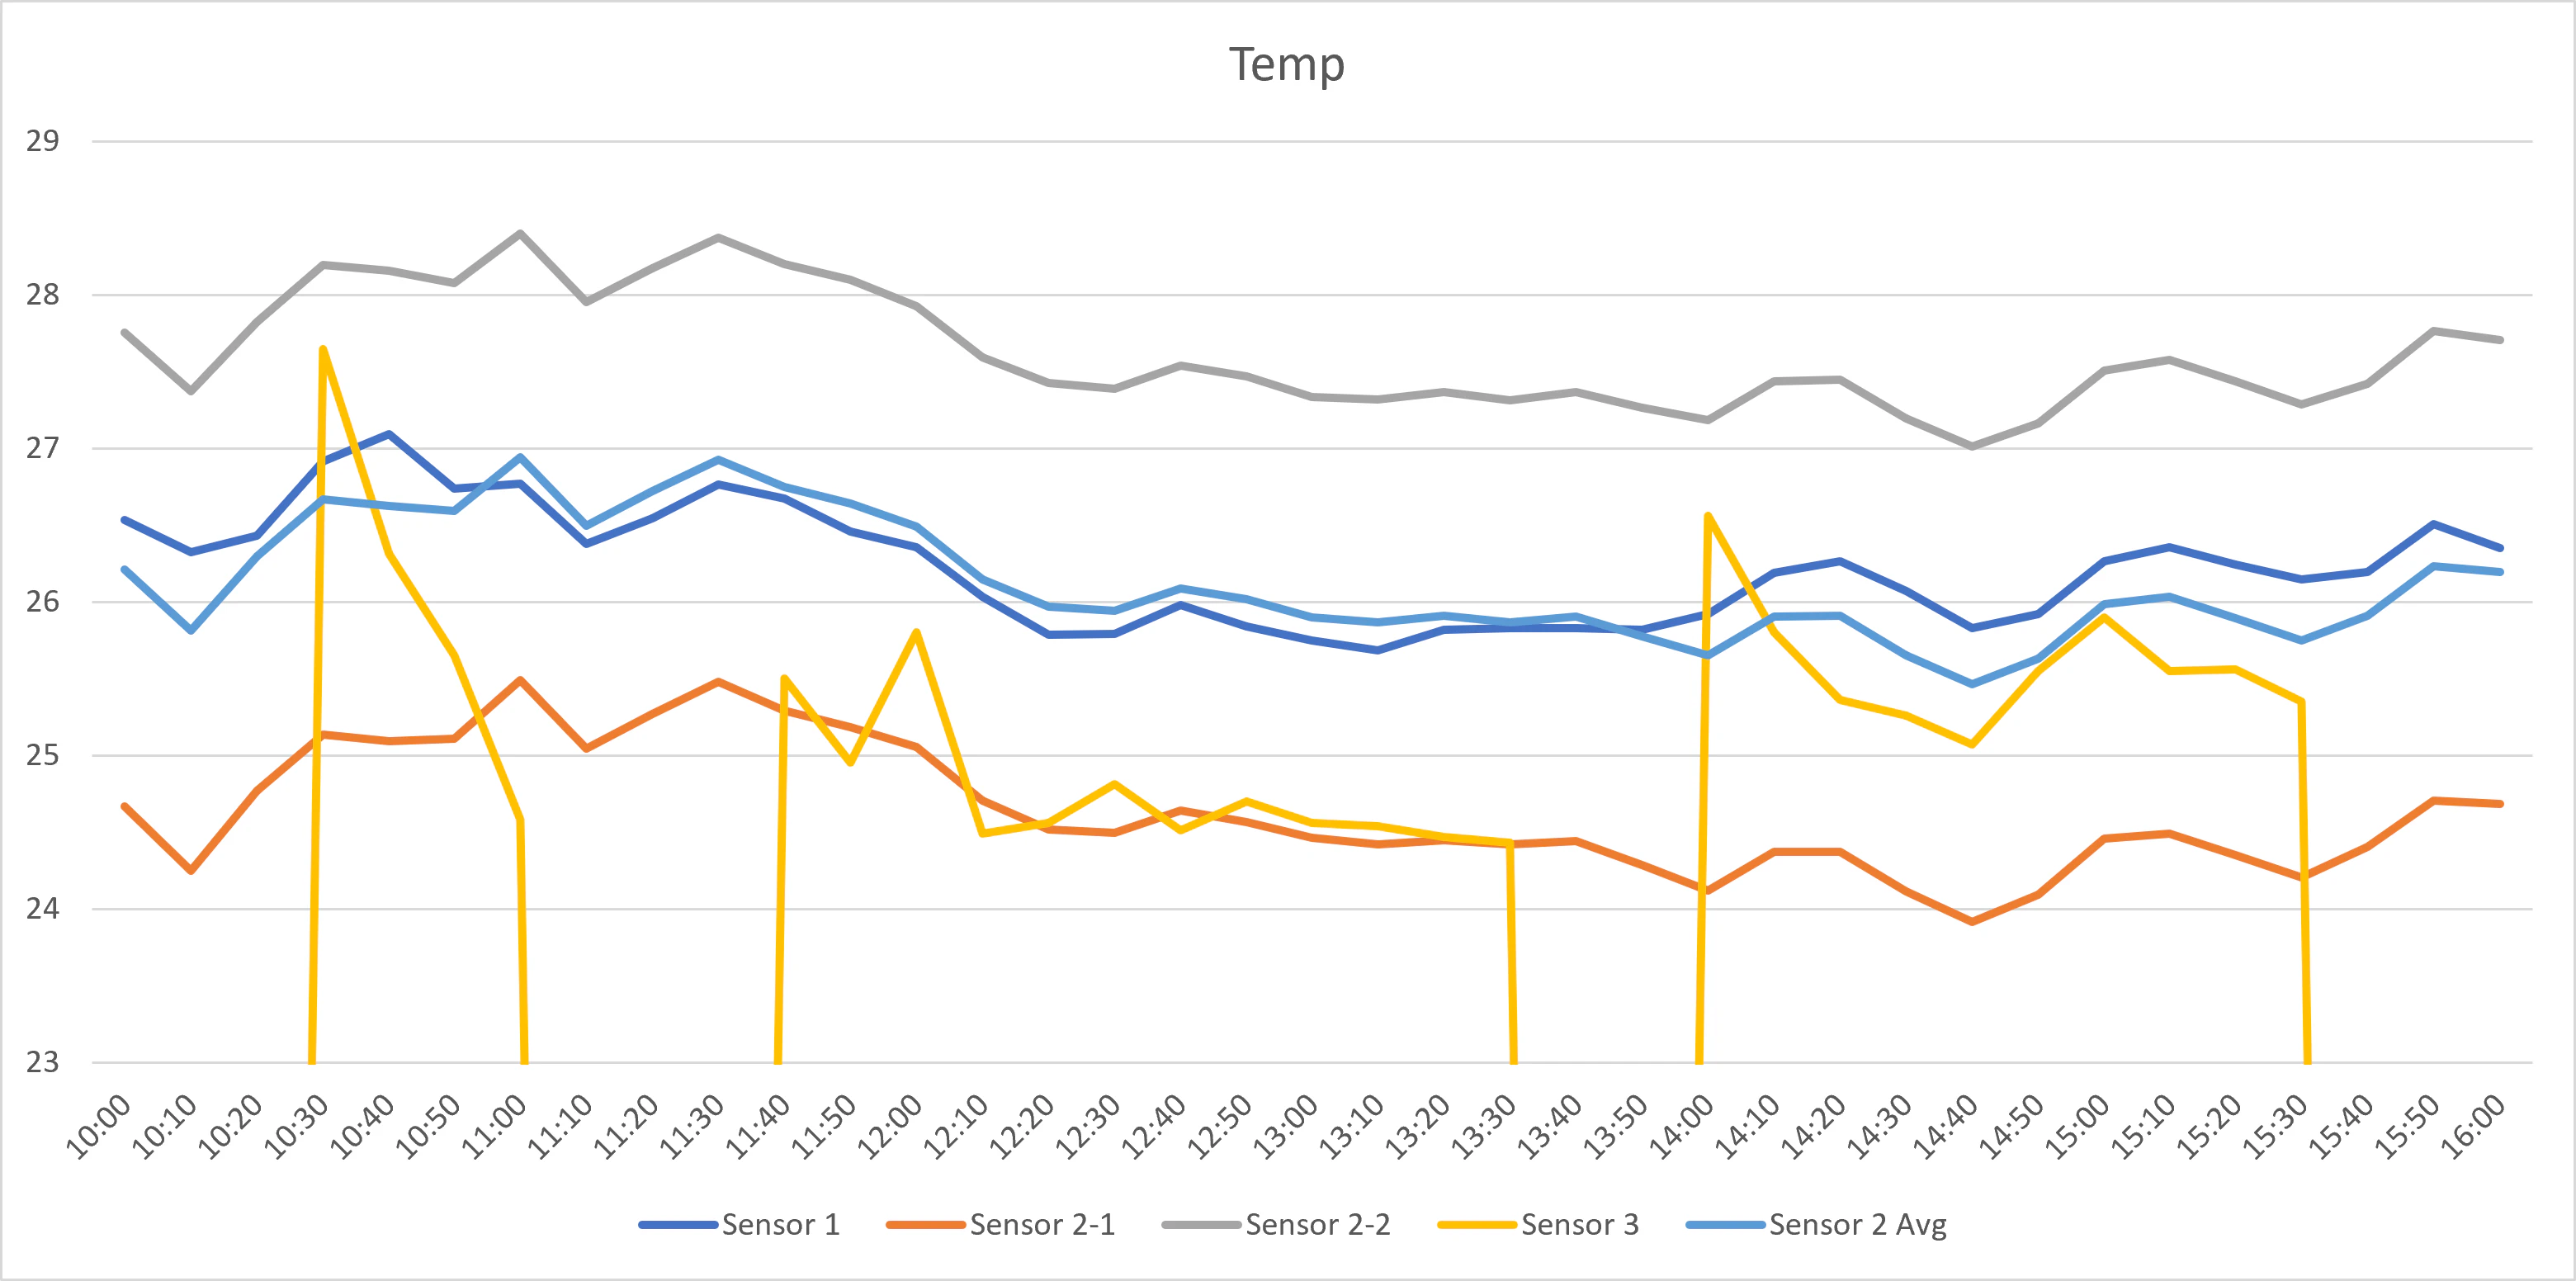
Sensor 1 seems stable overall, while two sensors in sensor 2 show values higher and lower than sensor 1. Lastly sensor 3 is pretty unstable (sudden falls represent the section without the data)
Average between two sensors in sensor 2 shows value fairly close to sensor 1.
I raised the data from sensor 3 by 1 degrees Celsius considering its entire circuit is exposed.
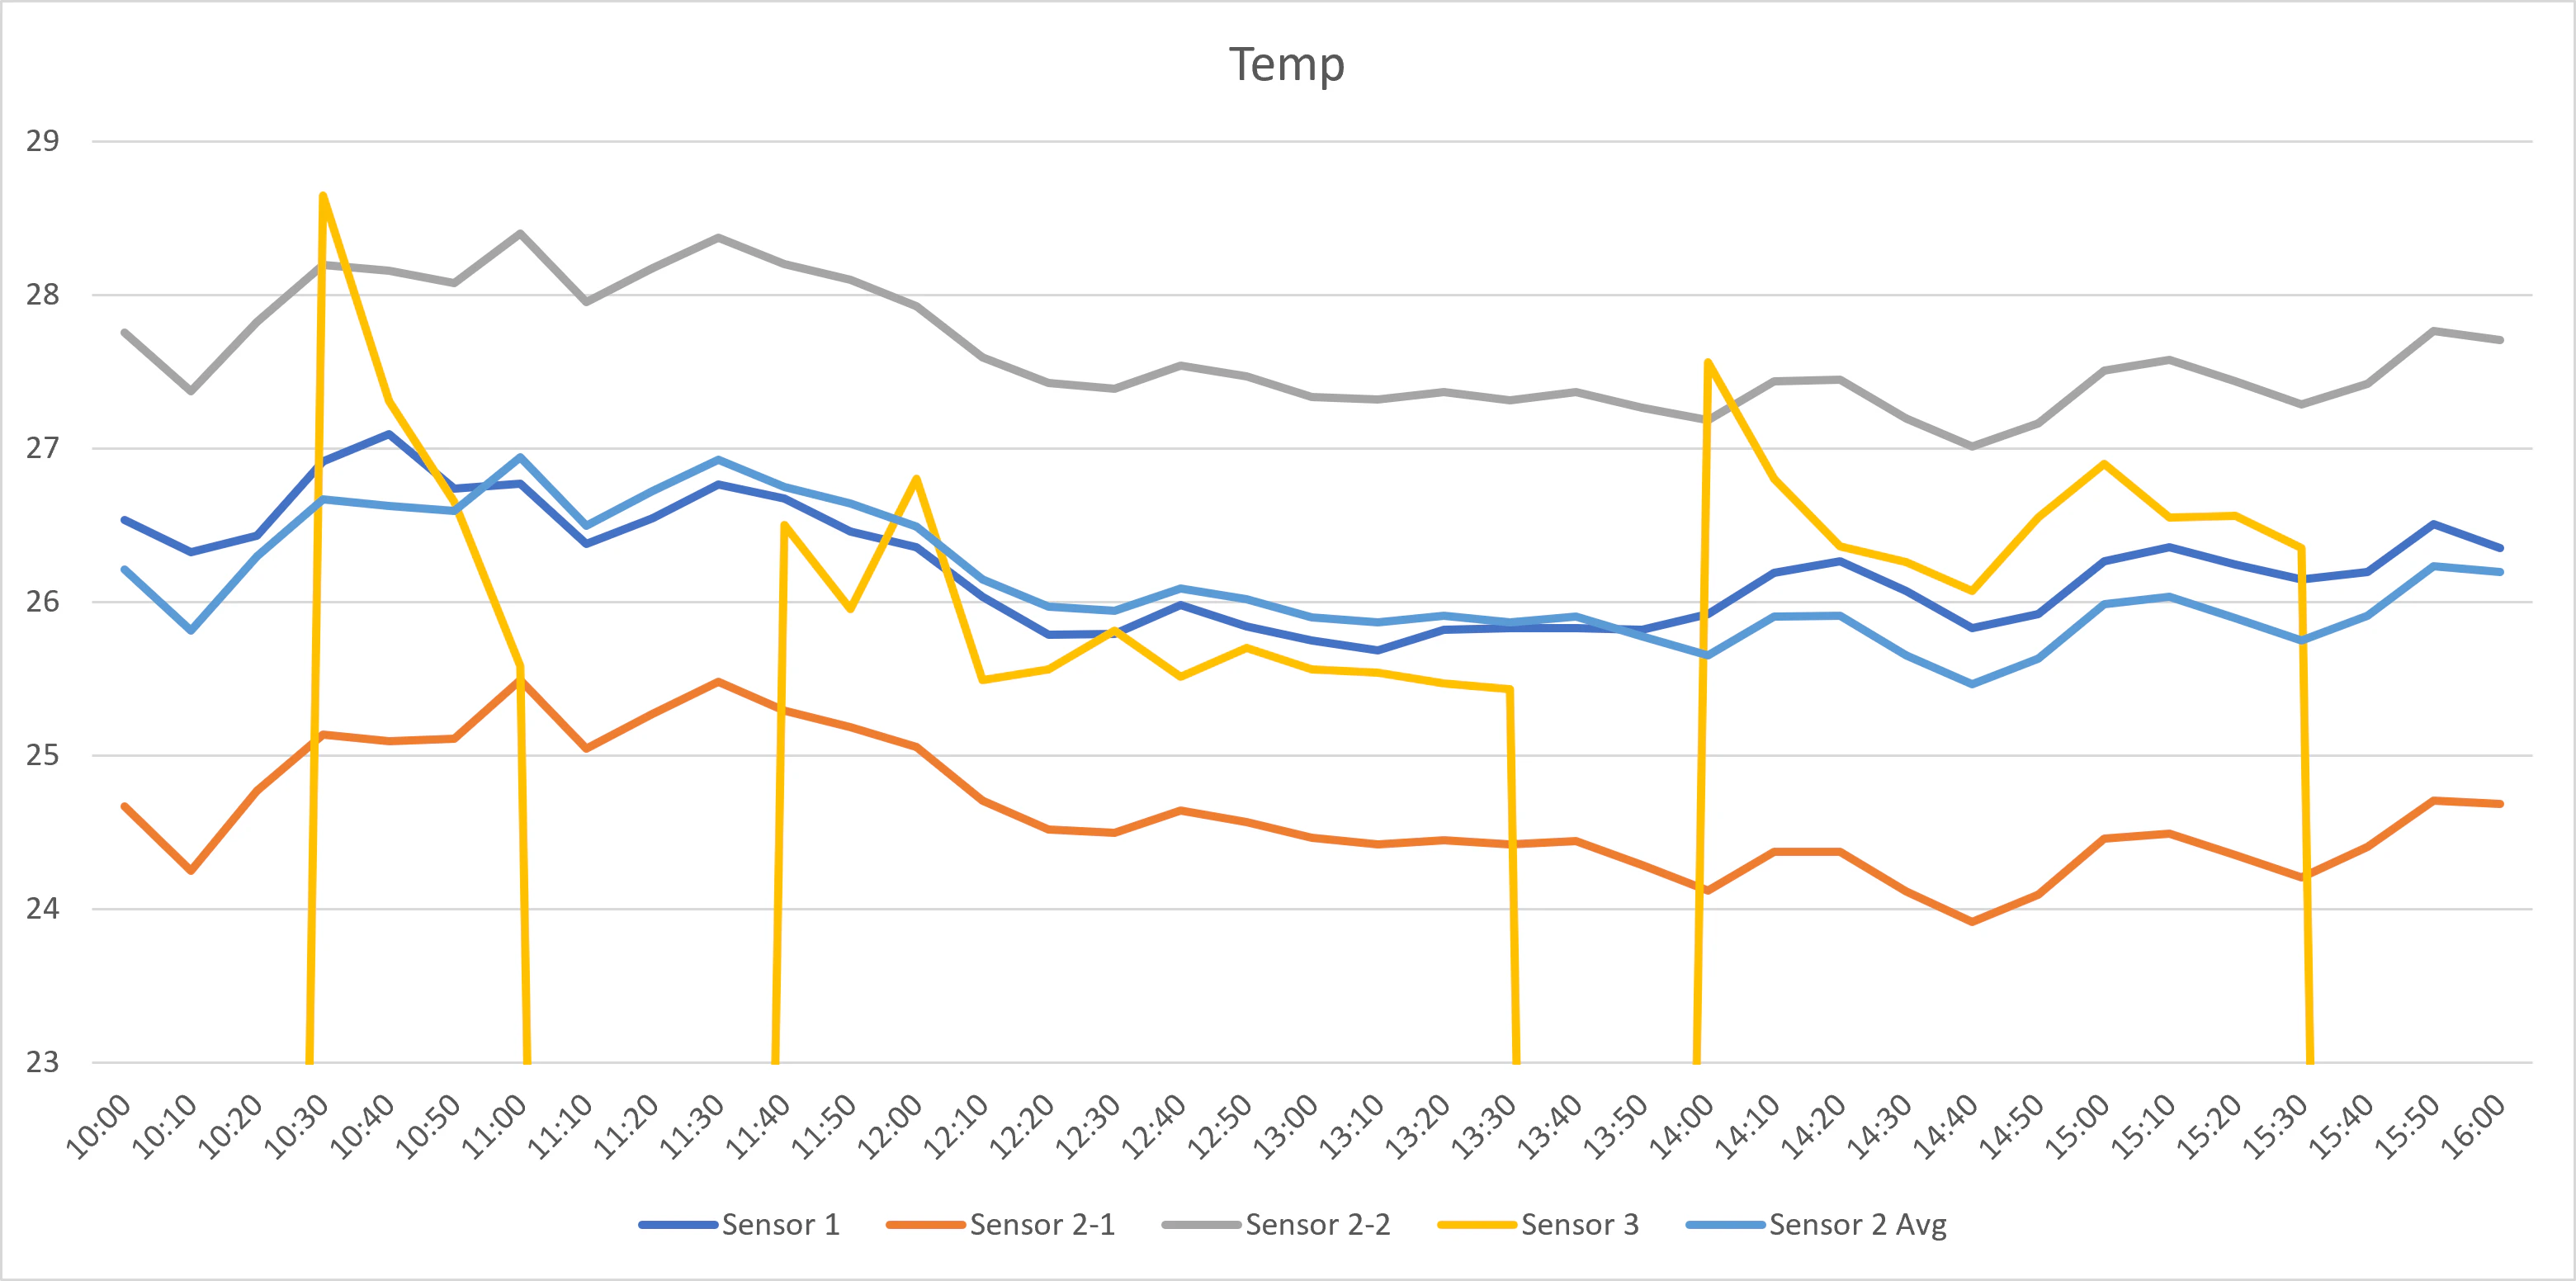
That seems pretty good.
Result of callibration
| Sensor | Change |
|---|---|
| センサー1 | No change |
| センサー2 | Take avg. of two sensors |
| センサー3 | Added 1C° to the recorded data |
Data recording
I placed the sensors across the office
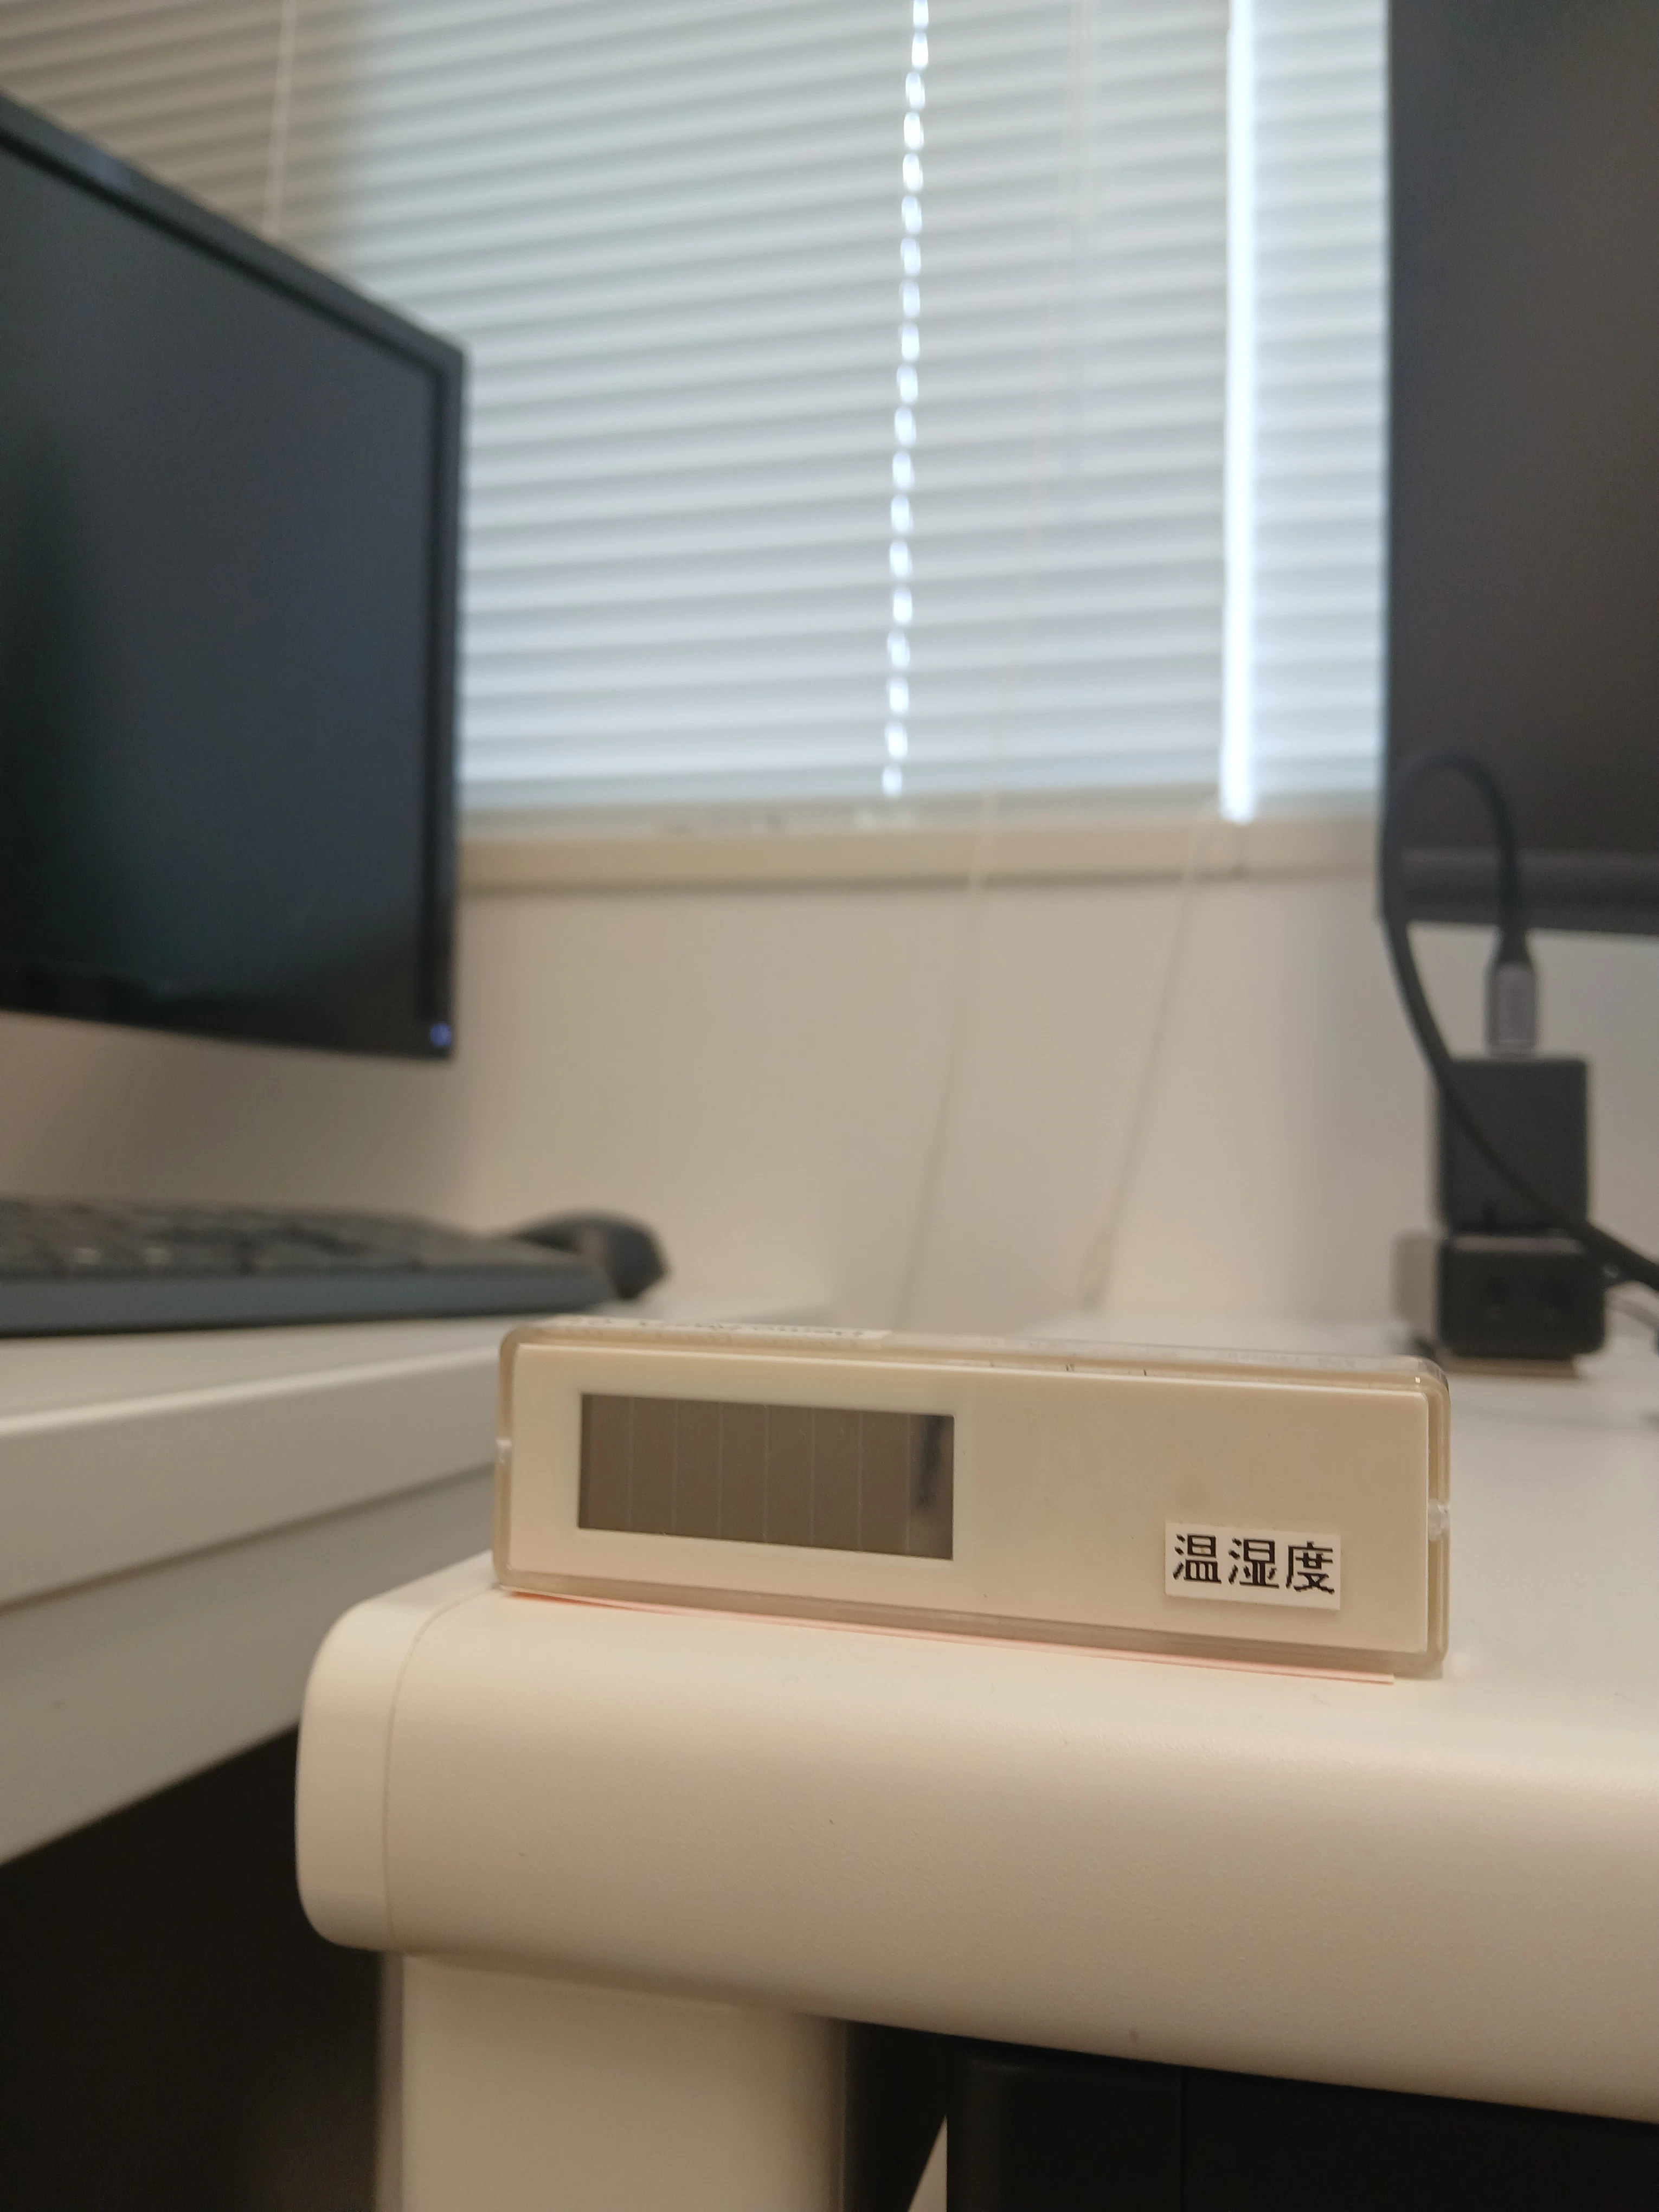
One on the desk near the window.
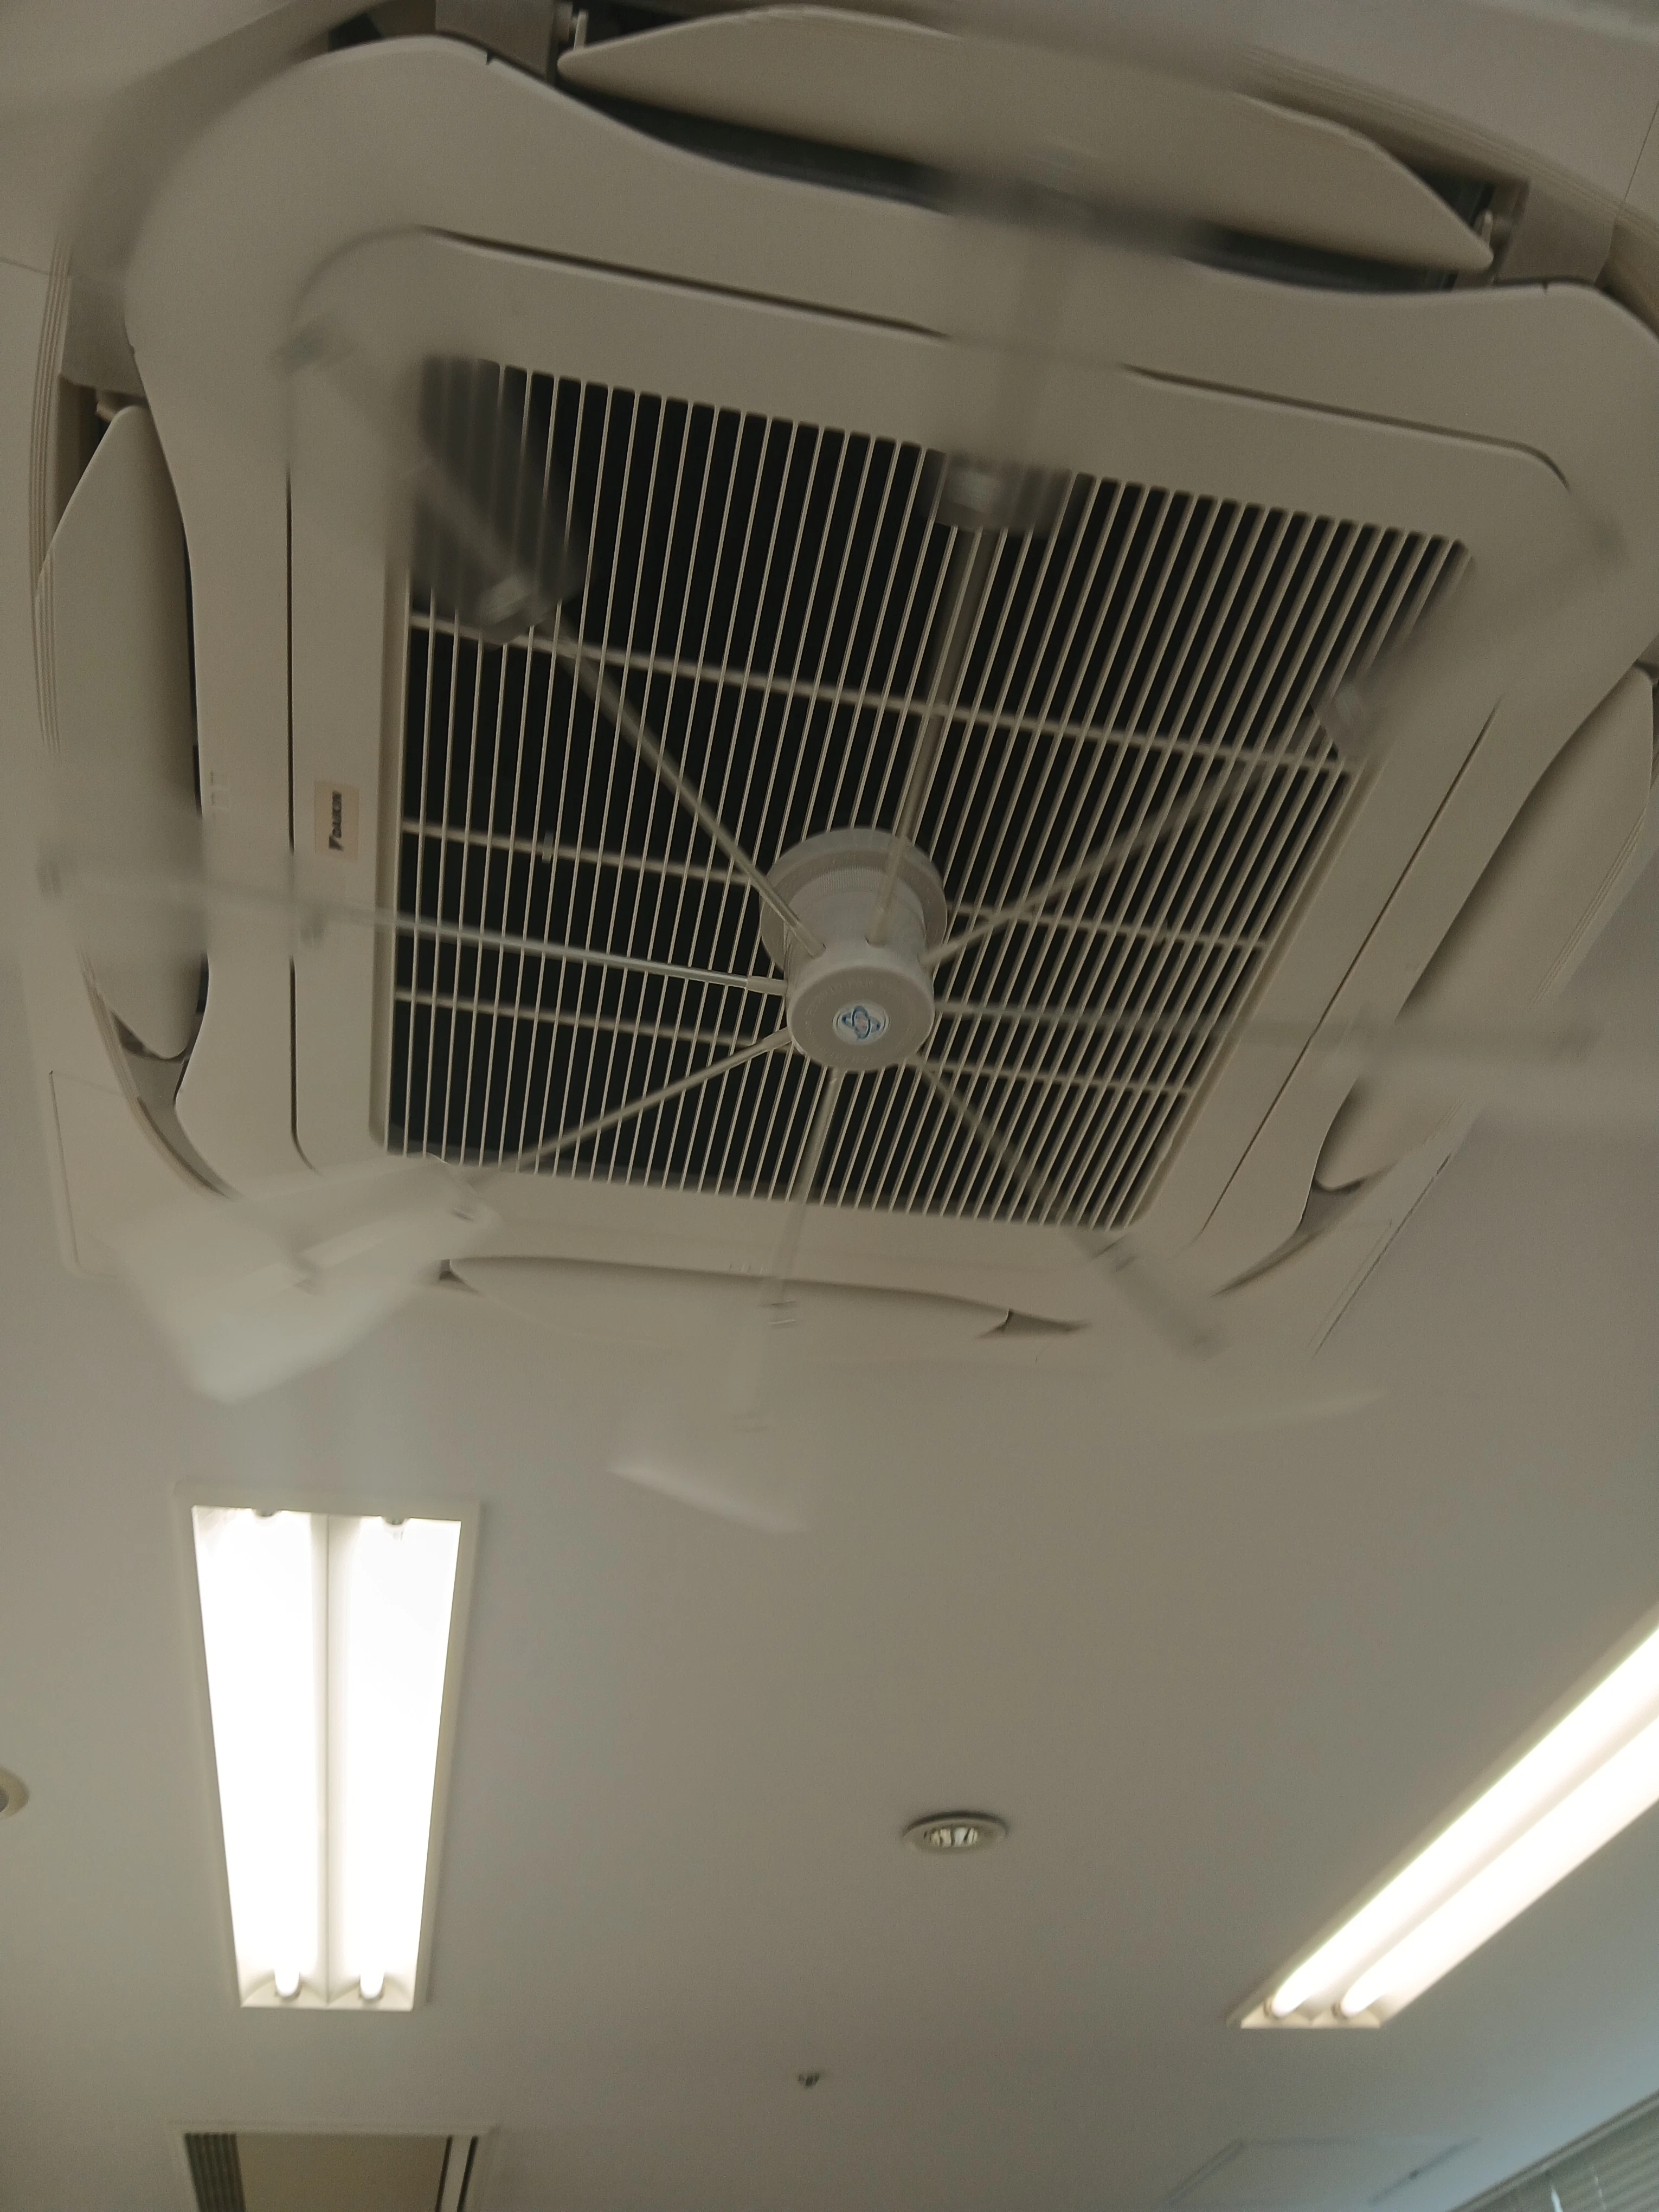
One on the desk under the air conditioning
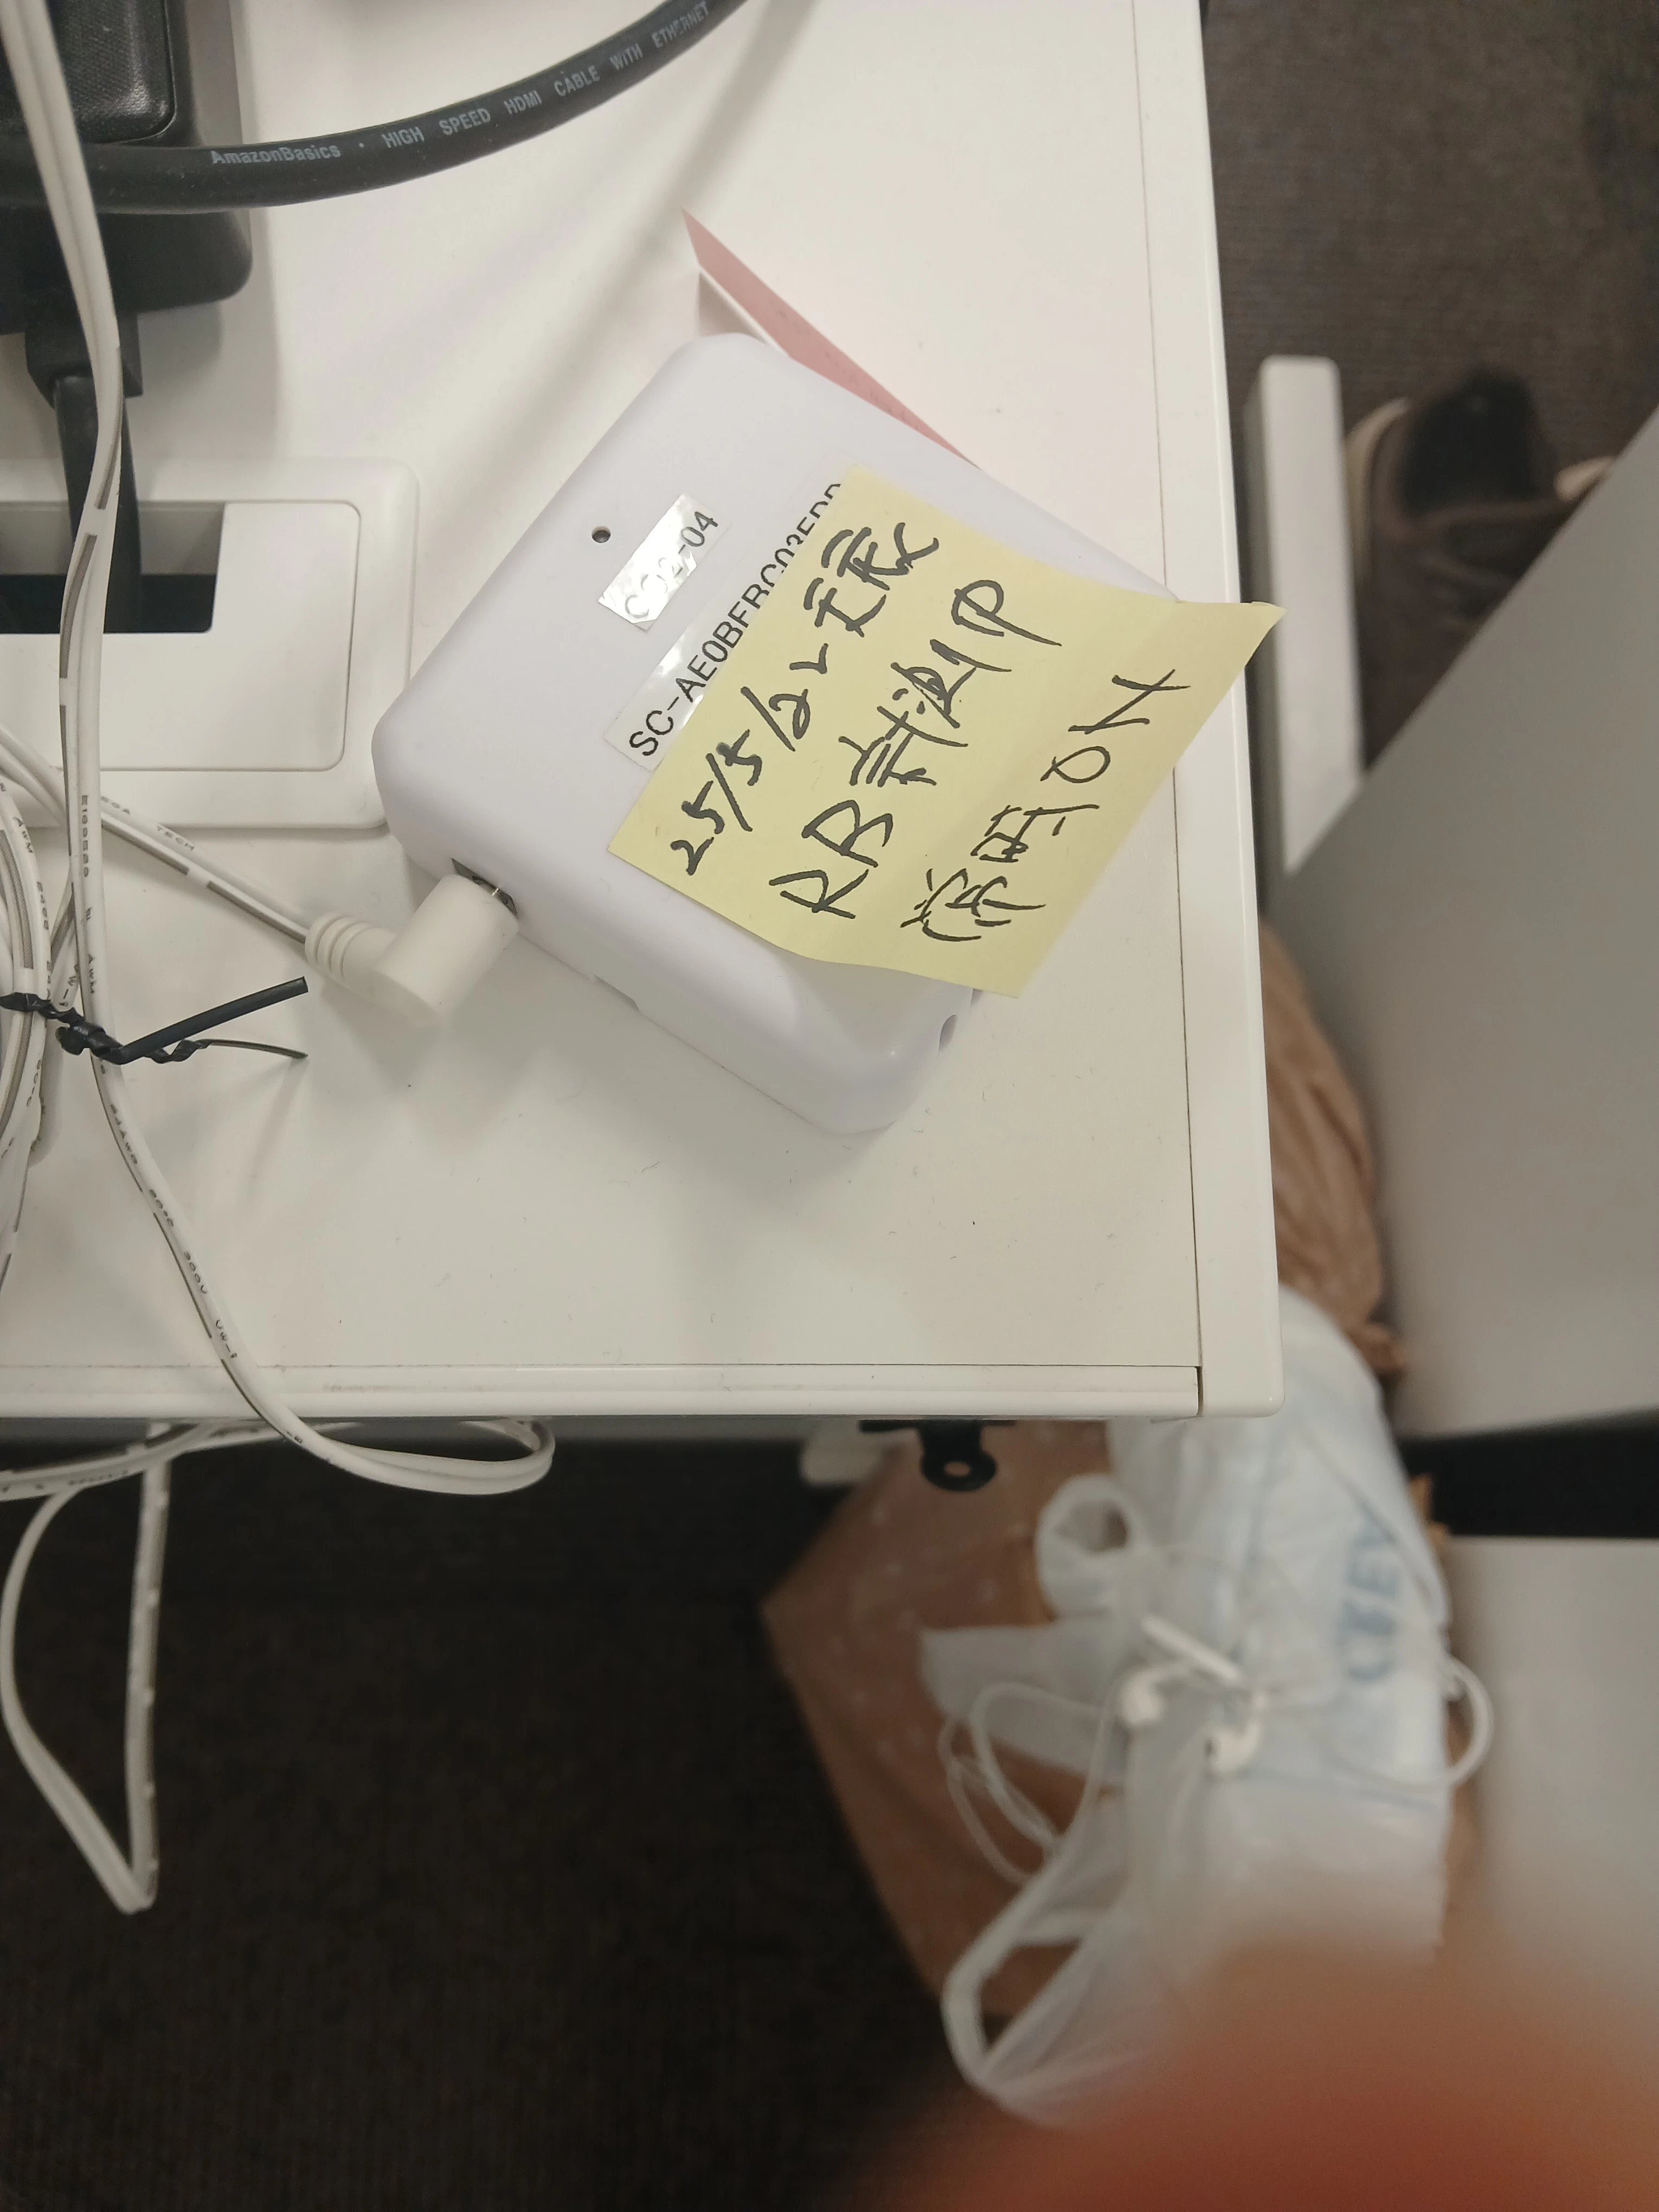
One on the desk near the office door.
I gahtered data between 11:00~16:00 on Jul 28 and 29
Data analysis
I downloaded csv files from RealBoard where the data gathered was located.
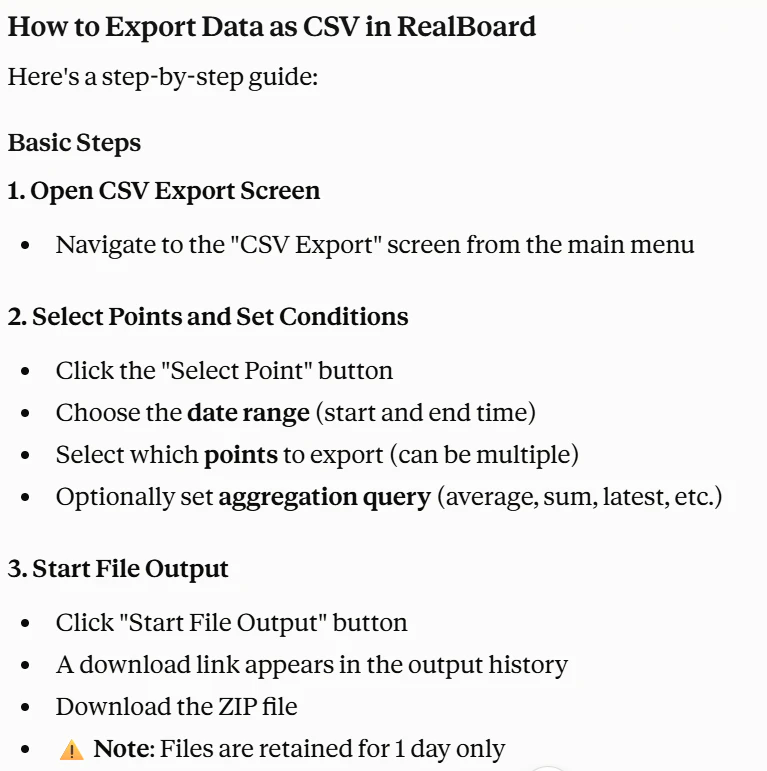
I used Claude to help me understand the use of system by asking Claude to summerise RealBoard mannual for AI prepared by PROMPT-X.
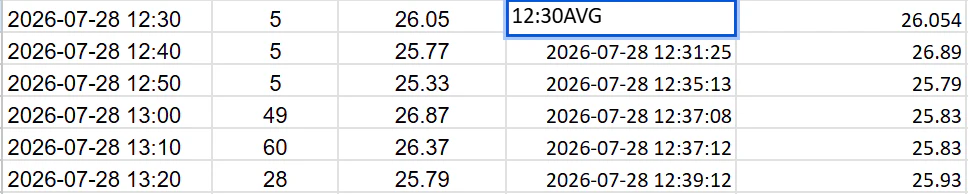
Sensor 3, which is not connected to RealBoard uses different file system, so I asked Claude to convert the temp. data into 10 min average.(I did not want to spend my time organizing 2700 lines of data by my hand)
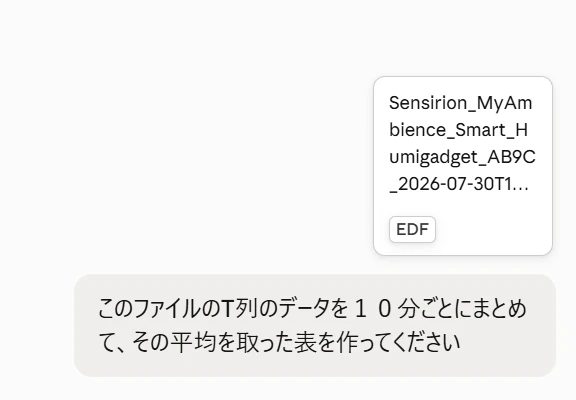
(TL:Create a table with data from T column averagaged by 10 minute timeframe)
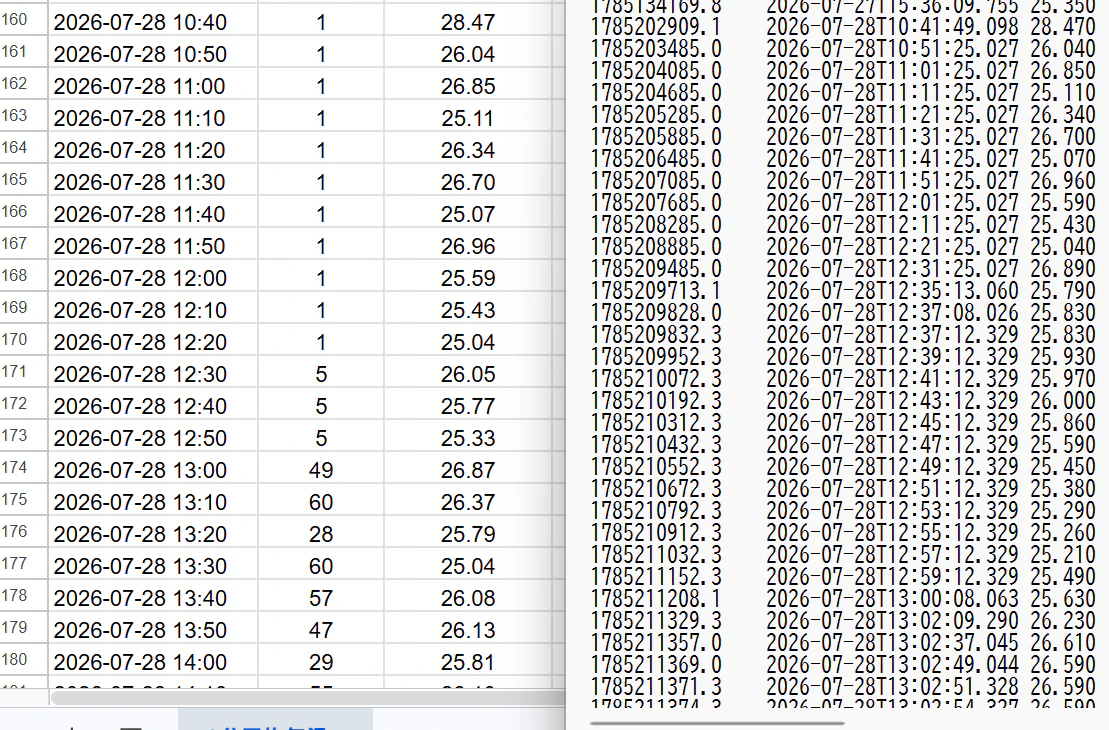
(Genarated table with time, number of samples, and 10 min avg. along with original file with raw data.)
As far as I can confortablly verify (such as row with low sample numbers) this table should be accurate.
Graphs! (everybody likes graphs)
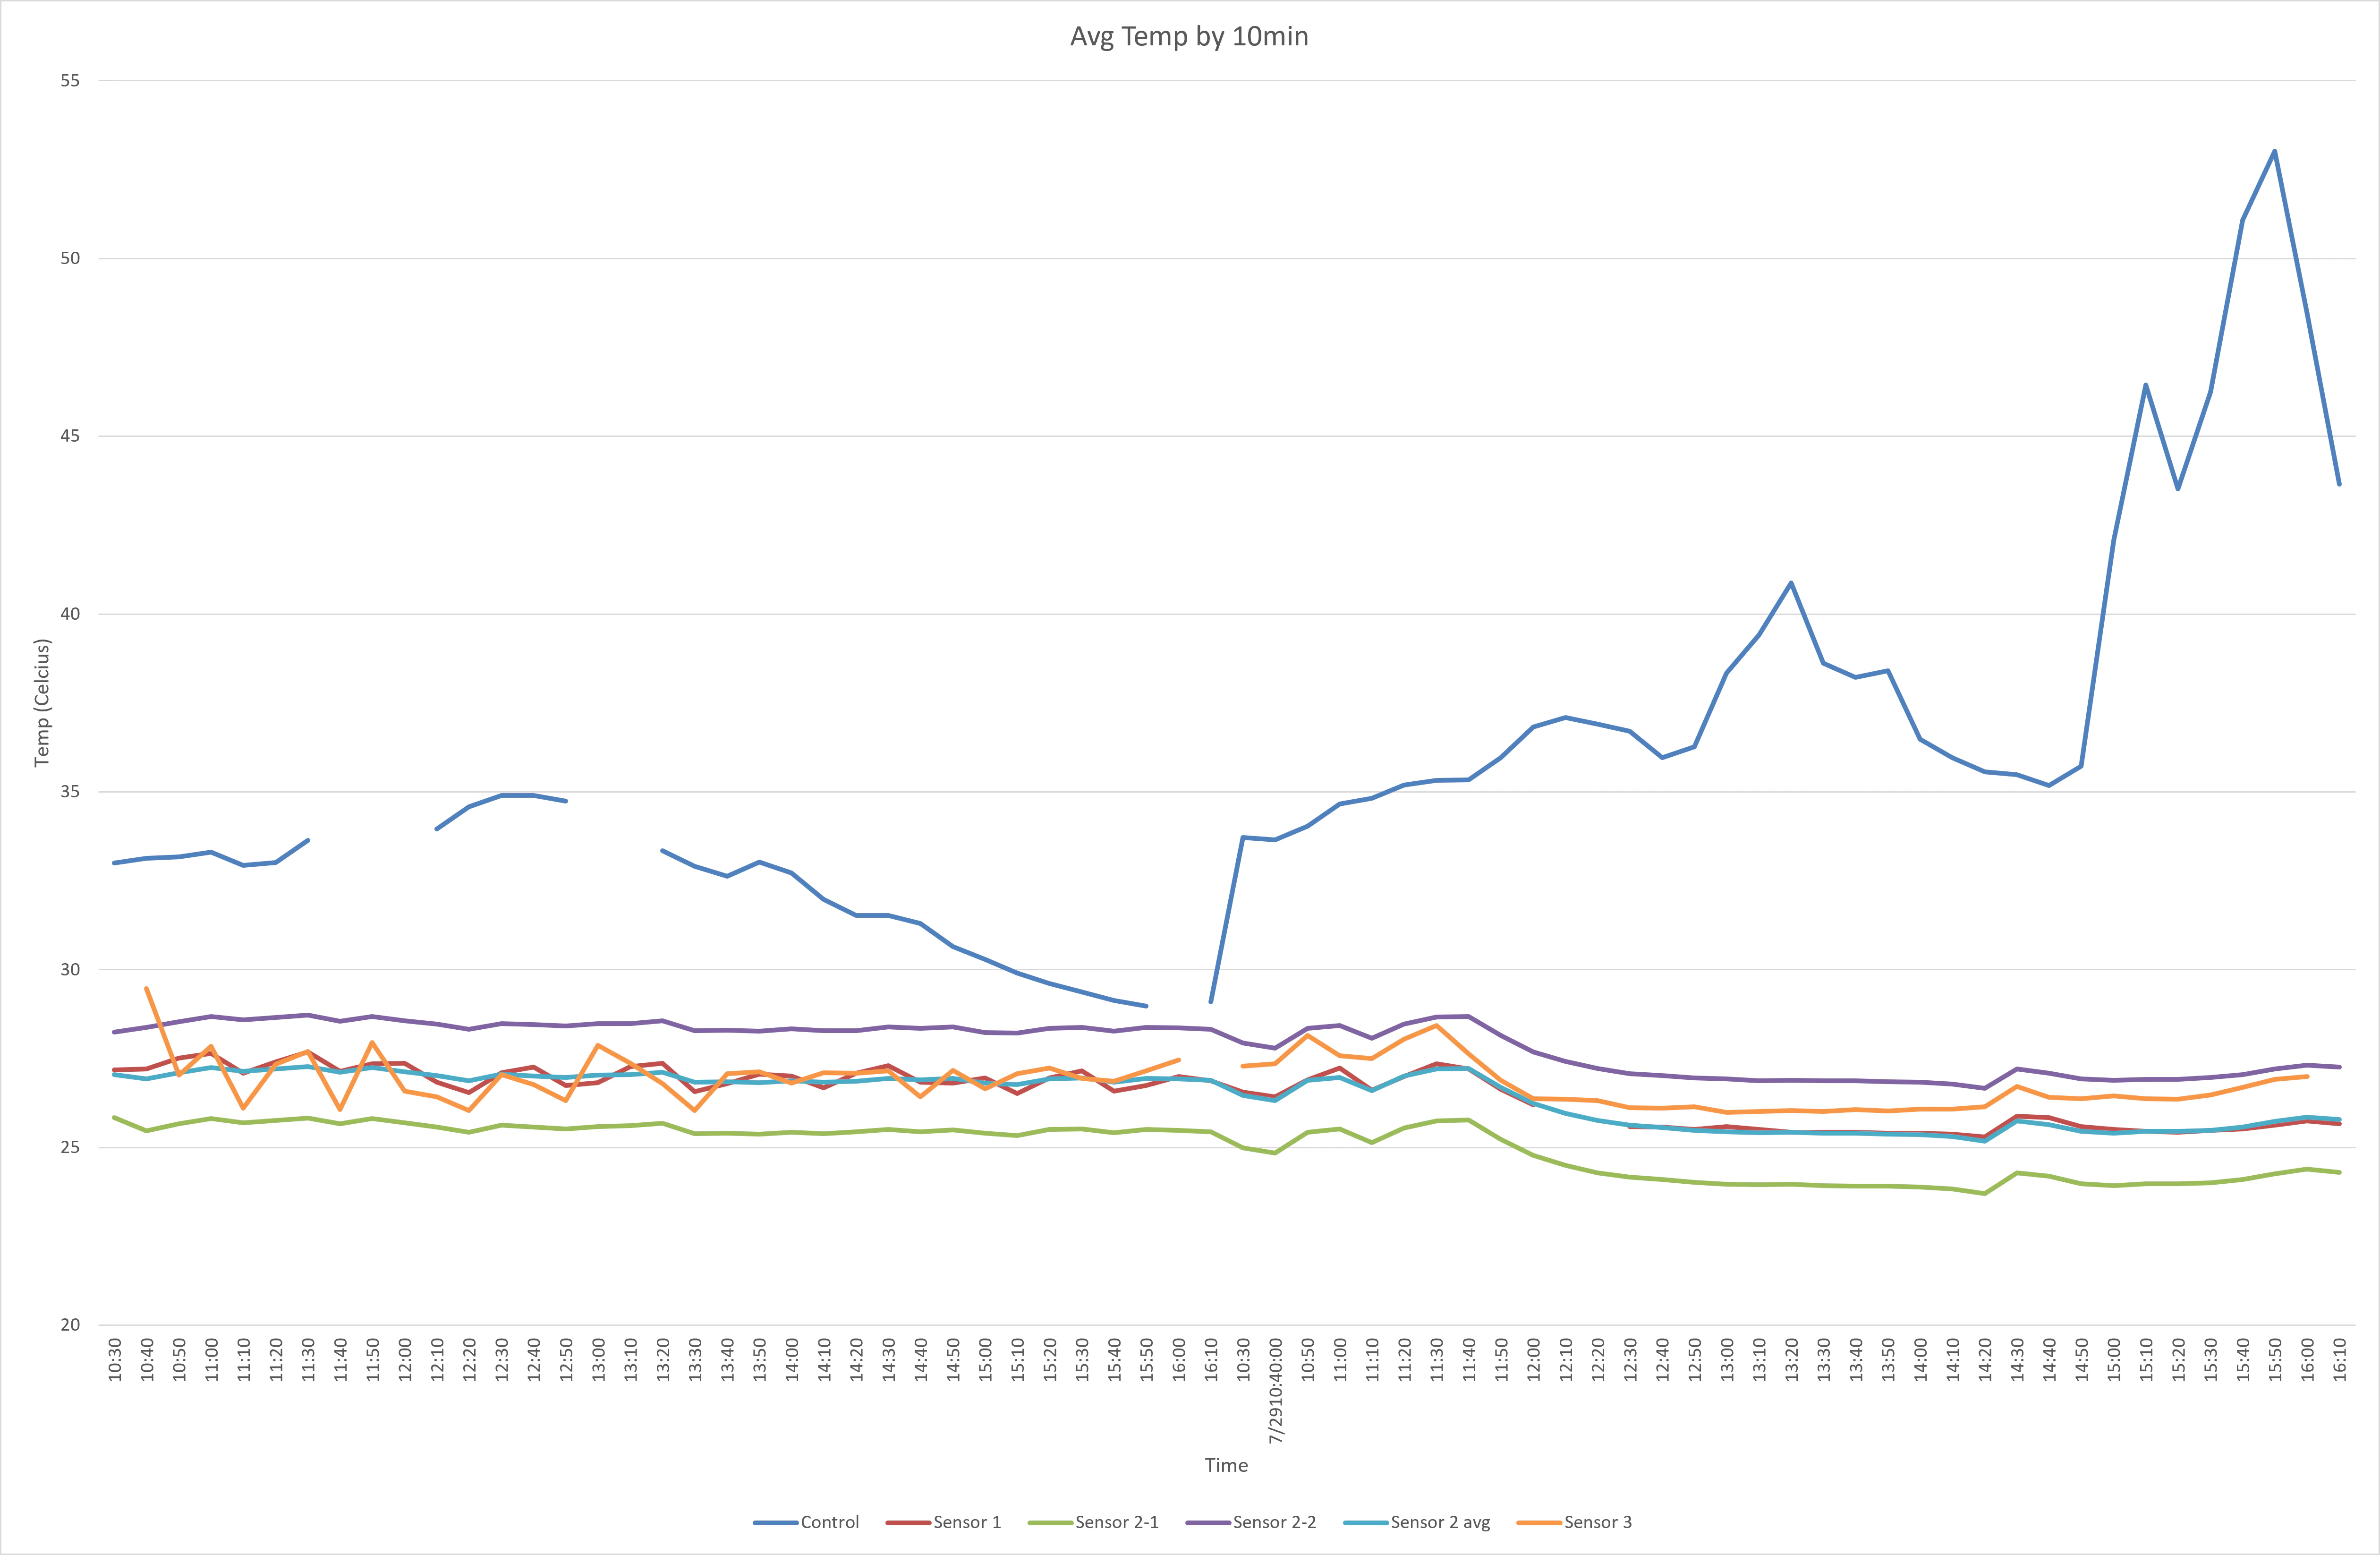
Control sensors have very high temperature reading, most likely due to the sun heating up the area between window and heat reflection mat strongly.
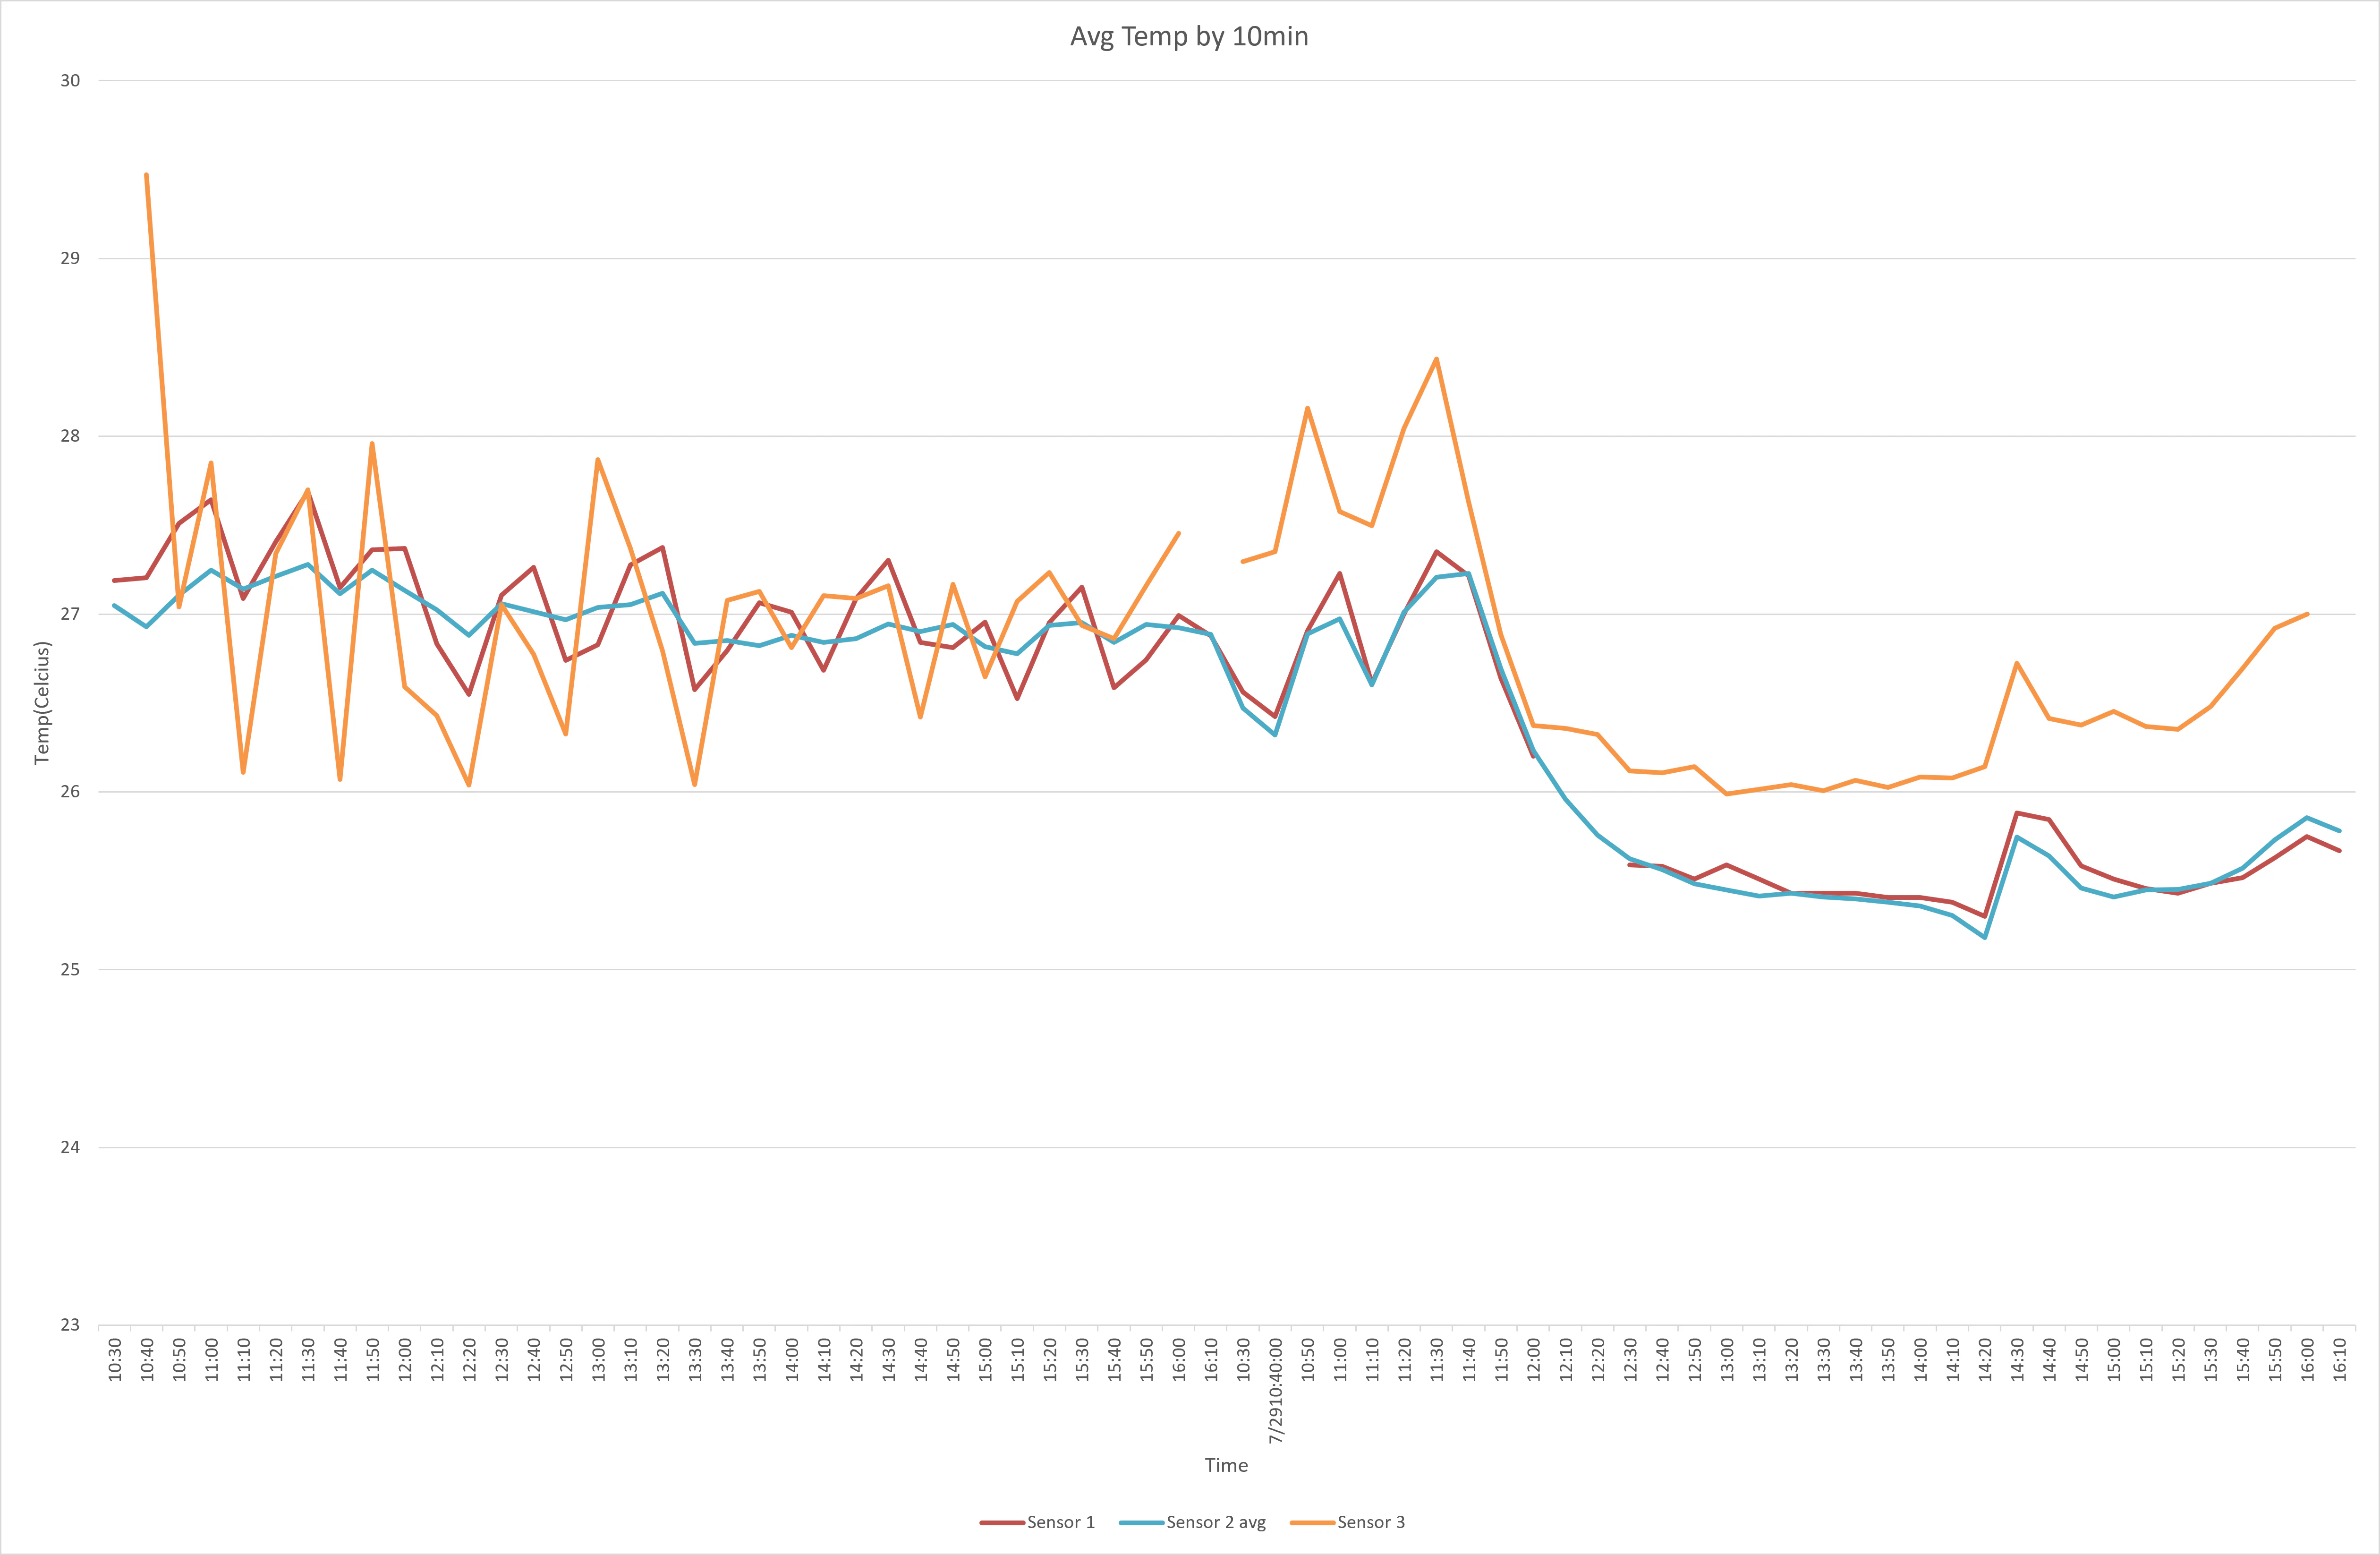
This is the graph with just data from sensor 1, sensor 2 average, and sensor 3 (with afforementioned + 1C change to the data).
This shows the temperature is very close, as oppposed to my theory, with sensor 1 and 2(sensor near window and under air conditioning) showing very similar temperature data, while sensor 3 reading higher on the data from Jul 29.
Discussion
There was no strong difference between sensor 1 and 2, which I predicted to have strongest difference.
Overall. I was able to see that office temperature measured between all sensors mostly stayed similar, possibly due to the effect of air conditioning. I was not able to spot clear and consistant difference of temperature between the sensors aside from sensor 3 on 7/29.
Possible cause of error
The error could have happened in experiment due to:
- diffrence between sensors, different sensors form different series may have caused errors in data
- Unreliable way of callibration, the callibration method used today relied on the assumption that sensors are all precise and would replicate difference shown in callibration period
- Lack of measurment data, due to the time constraint and restriction from sensor 3 I was not able to gather enough samples (between 11:00 and 16:00 over two days)
Room for future improvement
- Use uniform sensor for the measurment
- Use better calibration method
- measure data for longer period to ensure data does not reflect extreme circumstance
Future topic
- Create heatmap from data measured
- Measure other aspects relating to the heat, such as humidity and amount of wind from air conditioning
- Measure the temperature on a different time, such as room temperature during sunset which is likely to hit this office room facing north west strongly
Conclusion
The data from this experiment does not show strong difference in temperature in desk close to window and desk near the air conditioning, which does not support the hypothesis.
From this experiment, I learnt the difficulties of accurately and precisely measuring real-life phenominon and utilizing sensors, and the difficulty to think of a measurment plan to ensure accuracy and precision. However, this was a great way for me to learn the basics of data analysis and time series data.
Lastly, most imprtant lesson I learnt are
Air Conditioning are incredible!
Tools I used
RealBoard - For gathering the data from sensor, visualizing them as graphs, and exporting them as csv file to enter them in Excel.
Microsoft Excel(2021) - To create the graphs using the data exported.
Claude - To summerise RealBoard manual and to organize file from sensor 3 into same format as sensor 1 and 2.
Google Maps - To find the dirction of the office room.
Lastly
I would like to give my thanks and appriciation for PROMPT-X for offering me the oppotunity to join in this study program. It was a honor.