

Hello
I am back, with some reserch projects.
In this article, I am going to reserch the change of temperature and brightness, and see if guessing outside weather just by looking at the data recorded are possible.
Experiment method
- Place brightness, temperature sensor near outside or outside
- Measure data
- Analyze data
- RESULTS!
Hyphothesis
My hypothesis are:
If brightness decreases, than temperature also decreases.
Preparation
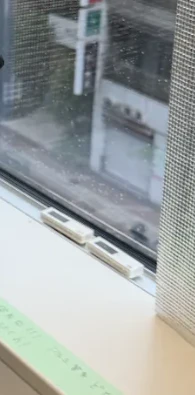
I first placed the lux sensor and temp sensor near the window
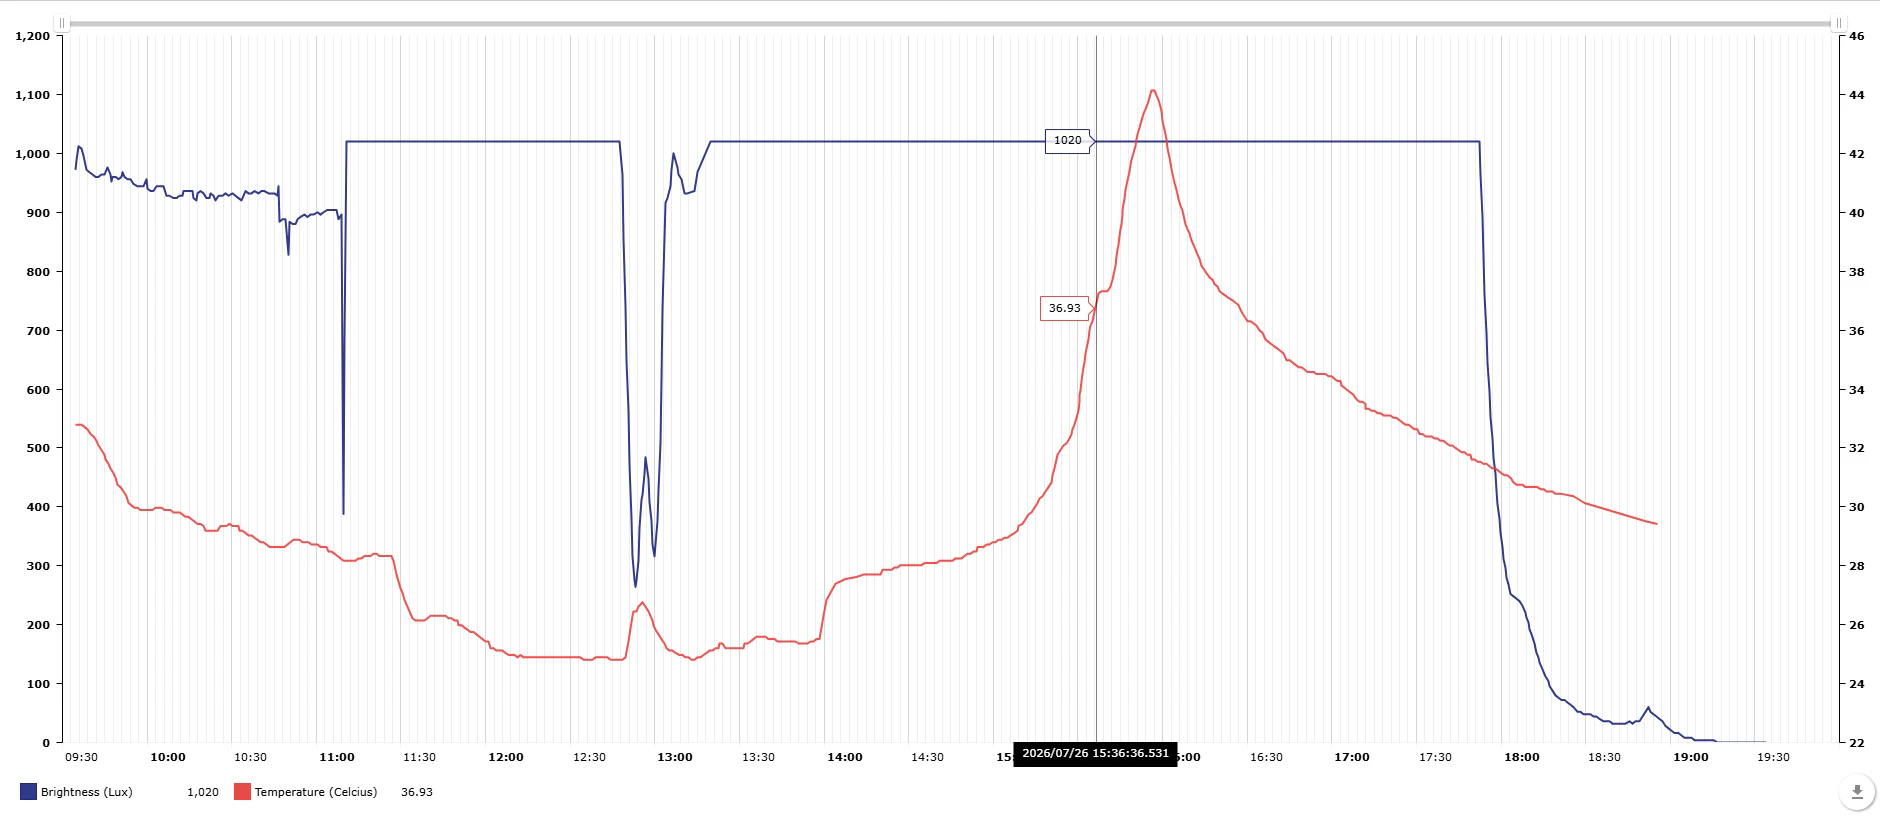
Oh... appearenty sunlight is way too bright for this sensor to measure(the readings are capped at 1020 lux)
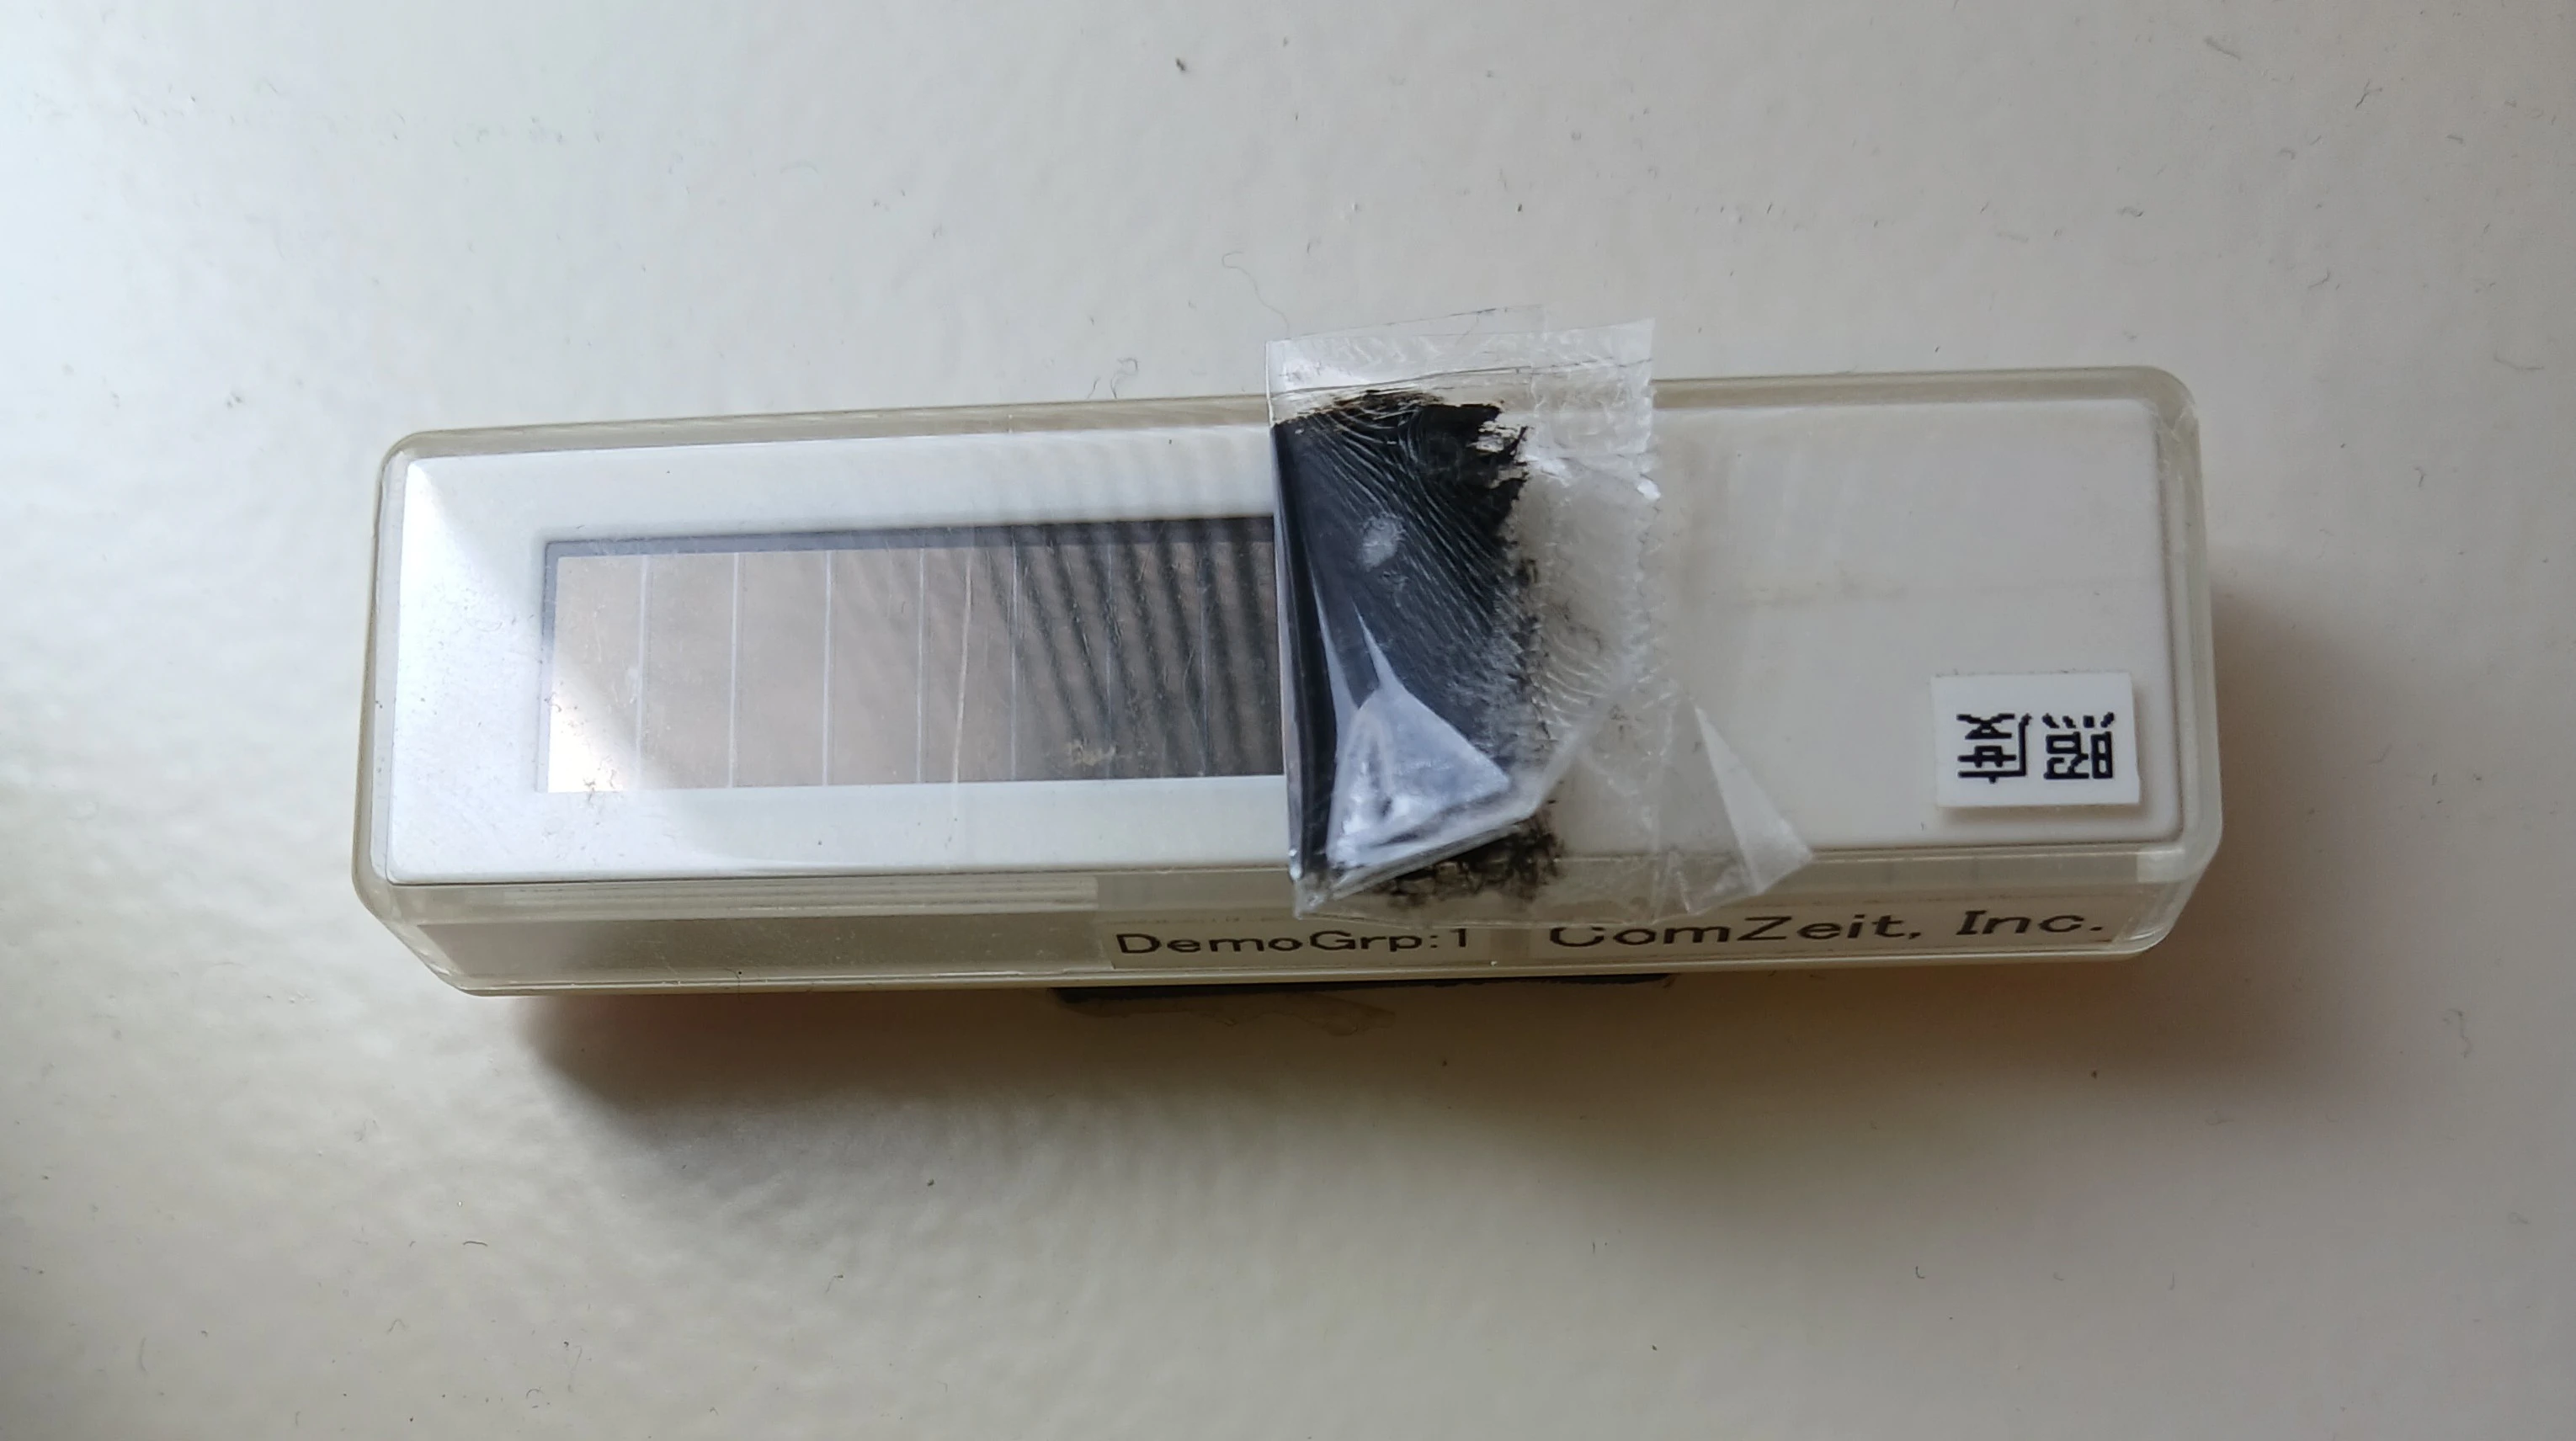
I placed filer, a.k.a. coloured tape on the sensor.
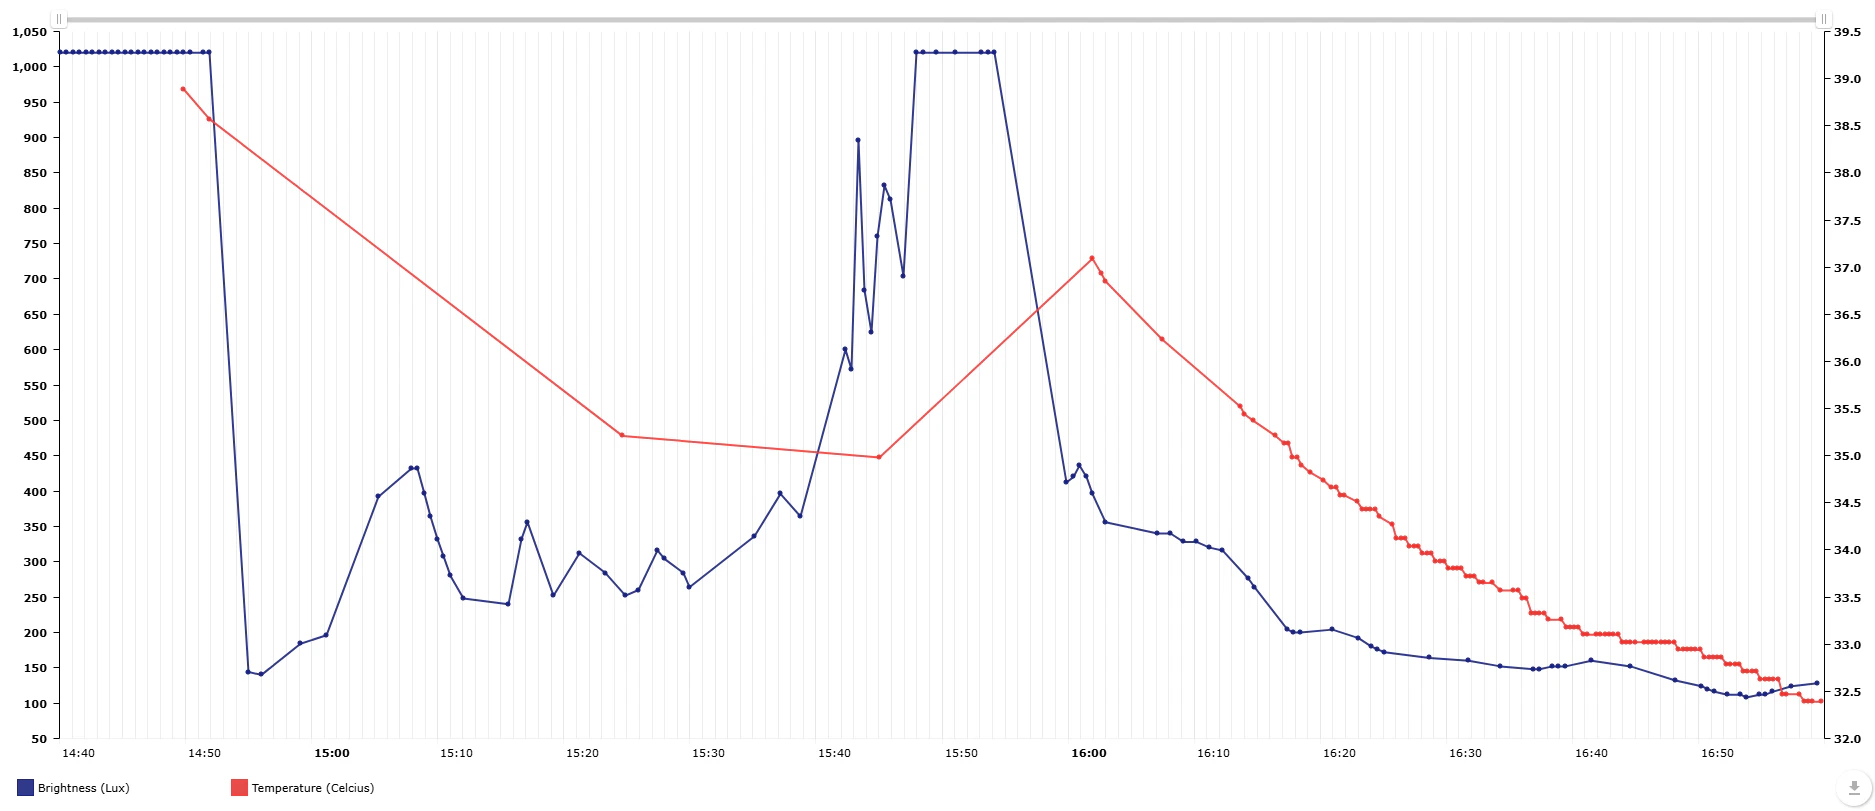
That looks pretty nice, I can see the change in the brightness.
Data recording
Data is gathered between 11:00 and 16:00 on Jul 28 and 29.
Jul 28(Overcast)
Today's weather forecast tells today should be mostly overcast, so I should not see brightness reading reaching cap.
Result
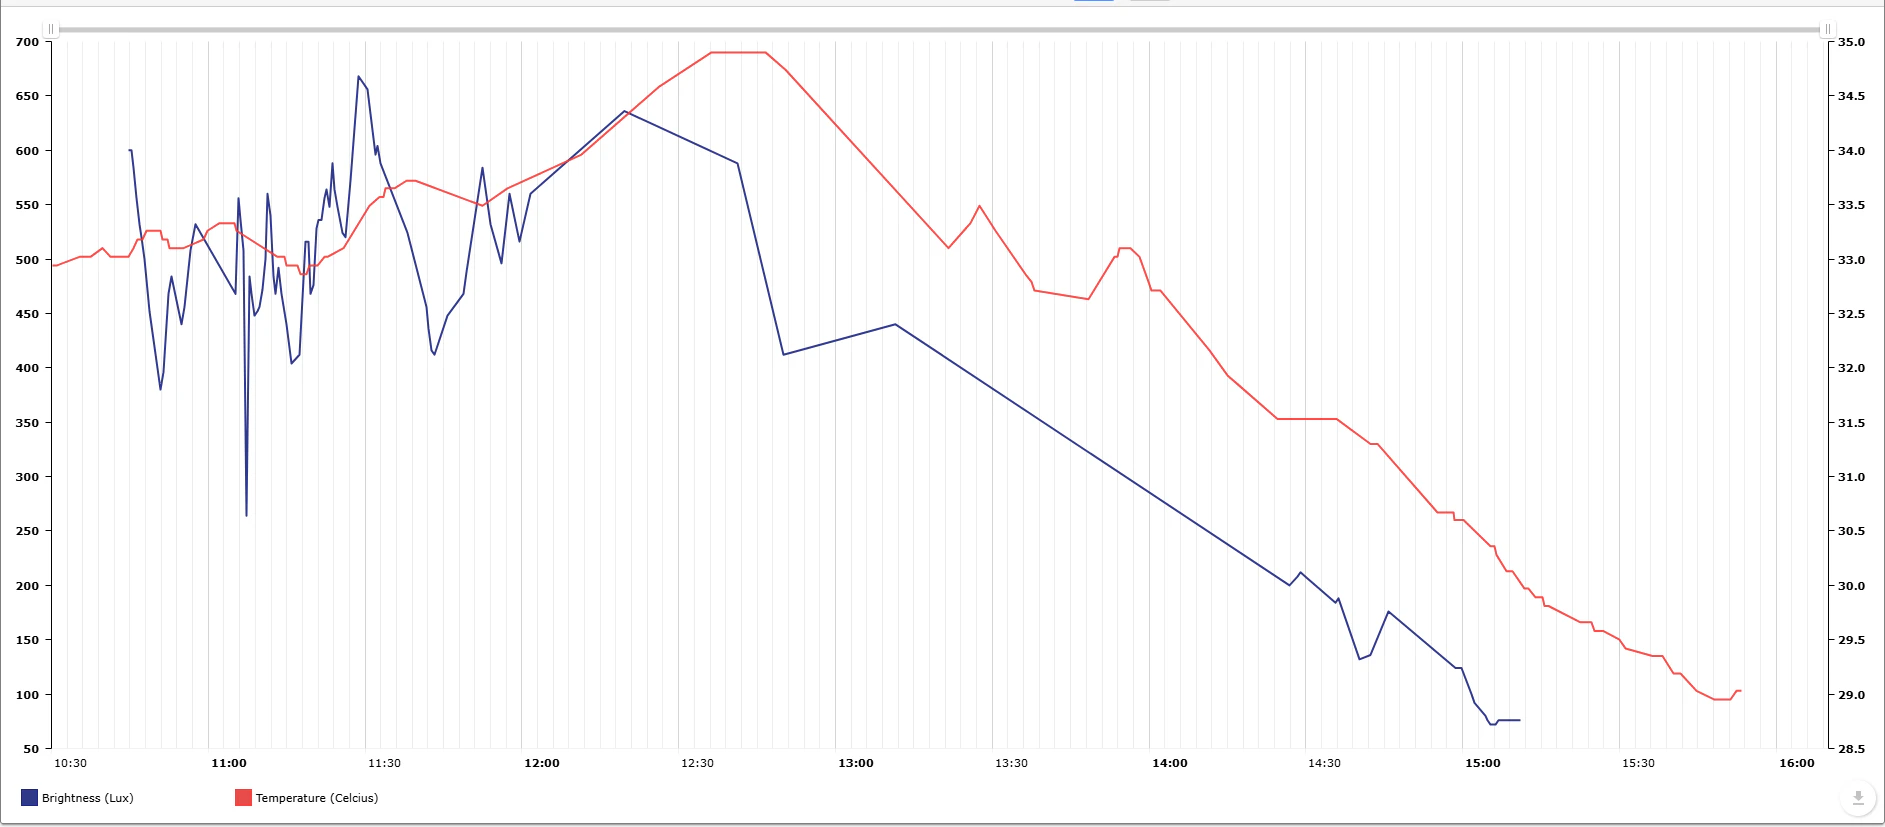
I can see very nicely that temperature and brightness have strong corelation. Where both temp and lux peaks around 12:30 and start to decrease into afternoon.
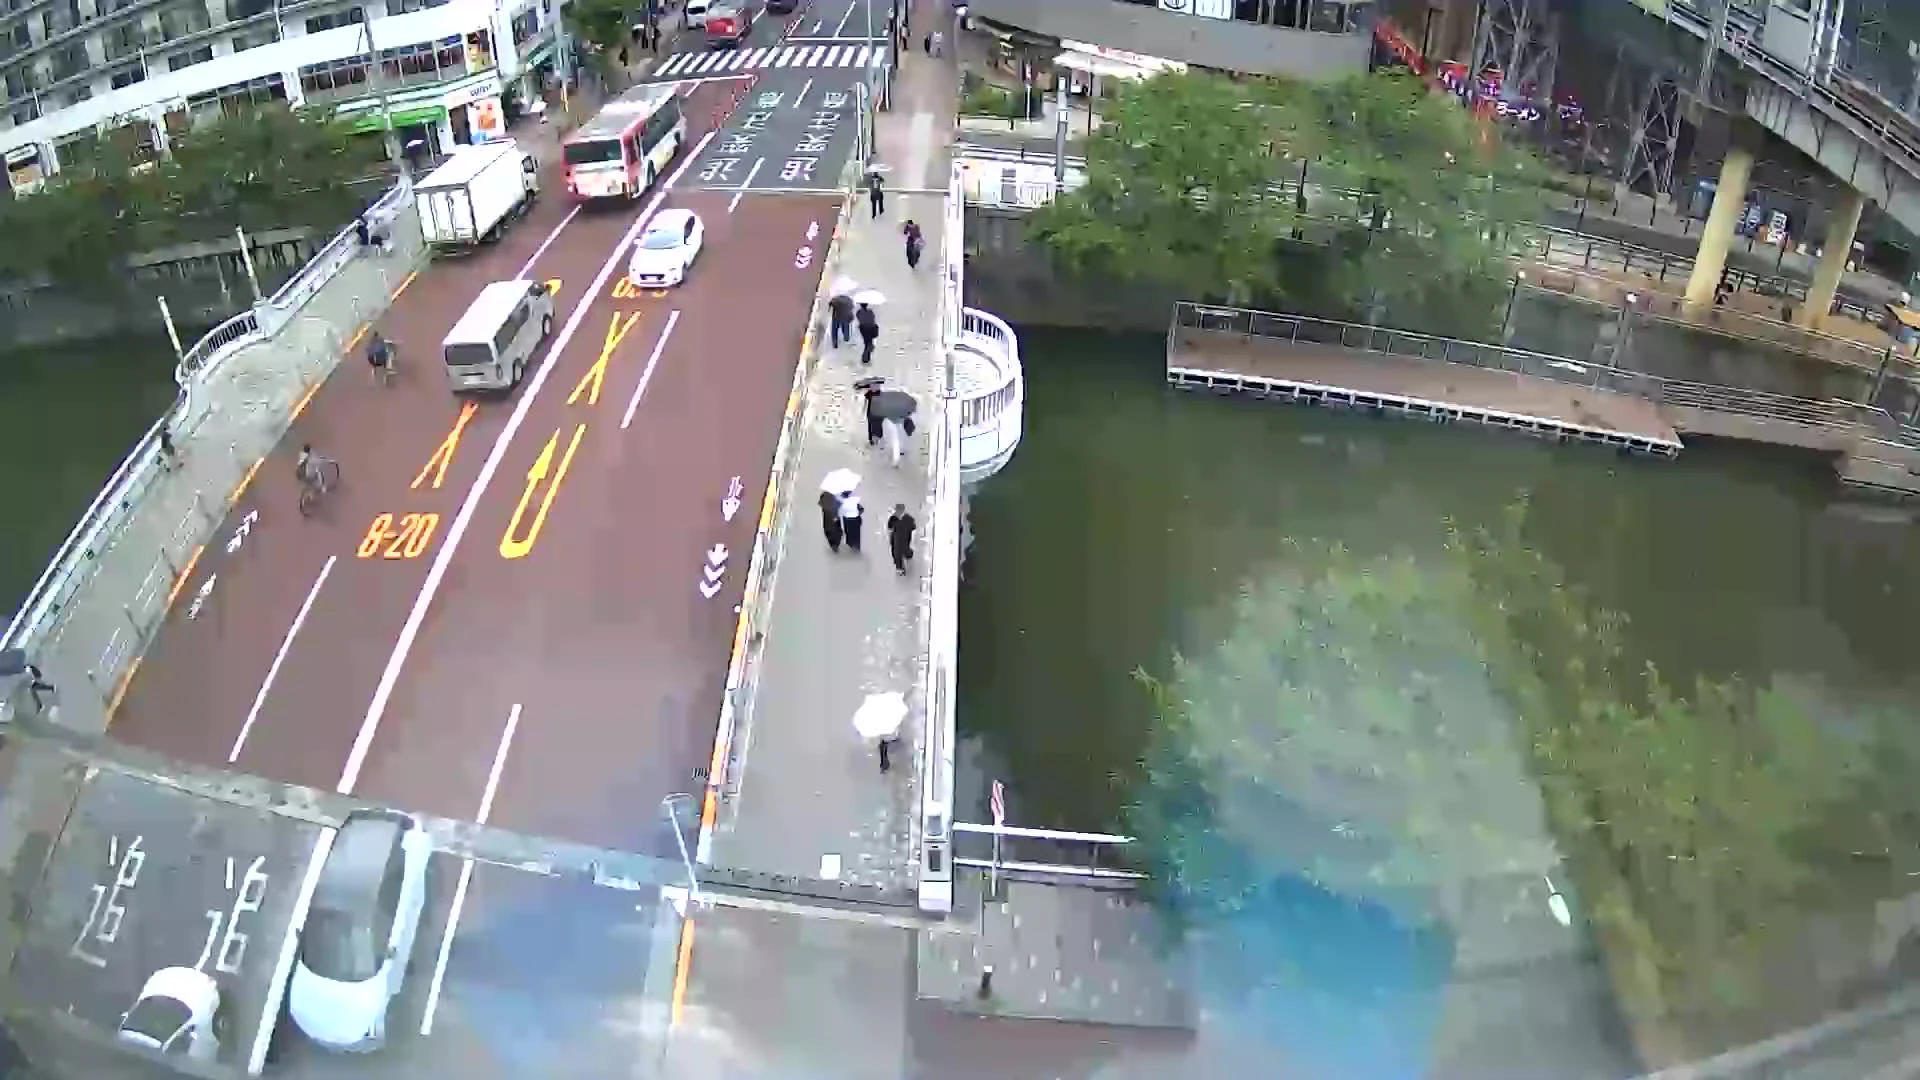
From this photo of street outside the office from 14:40,I can confirm the cloud increased form 12:30 to 14:00, with rain starting to fall around 14:40.
7/29(Sunny)
Forecast for today says today should be sunny, so I am looking to see more warmer and brighter readings.
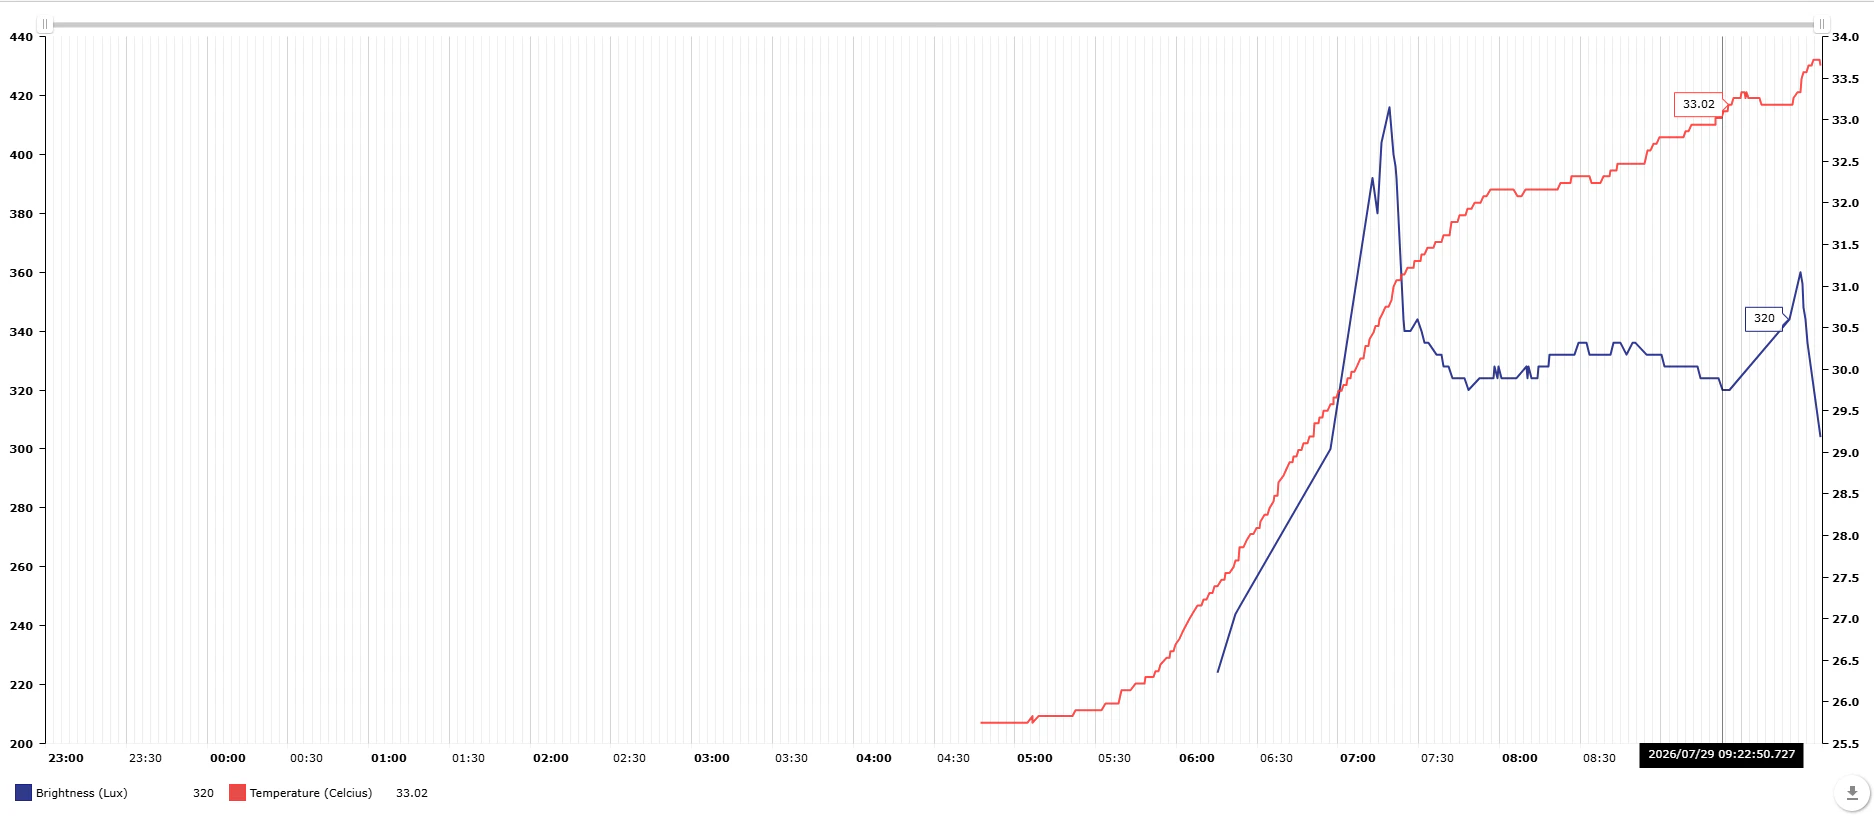
Hmm, brightnes seems to be not increasing with the temperature, they decreased as the temperature increased.
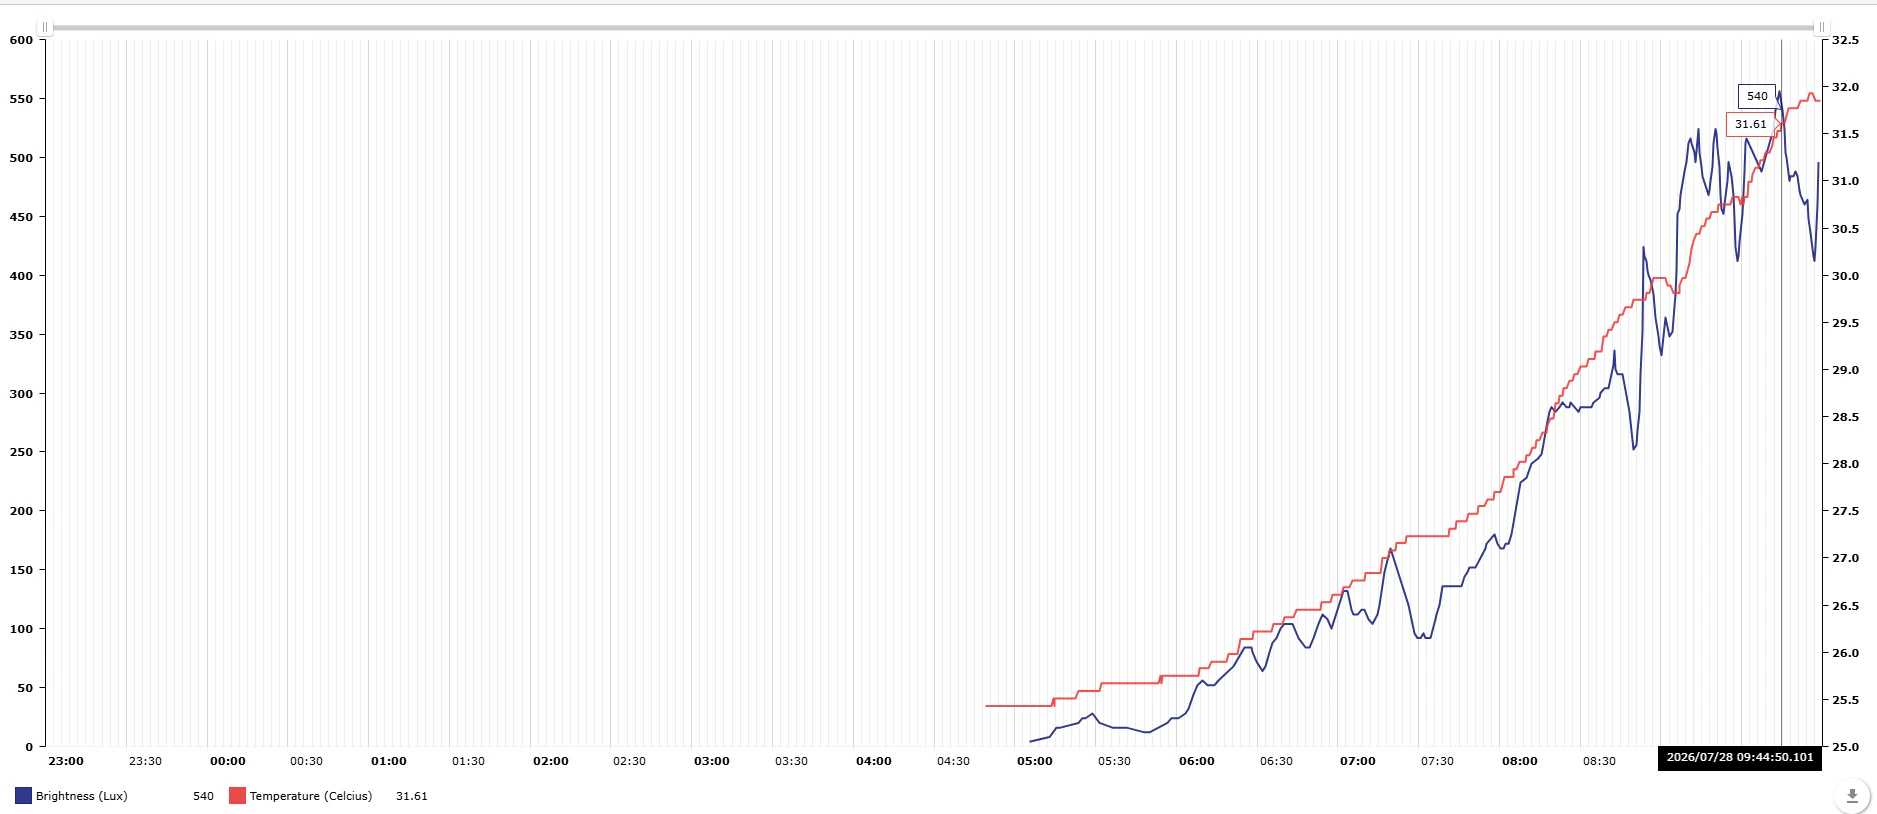
Conpared to yesterday, I can see that yesterday have higher Lux around the same time even though temperature are lower.
Why is this happenning?
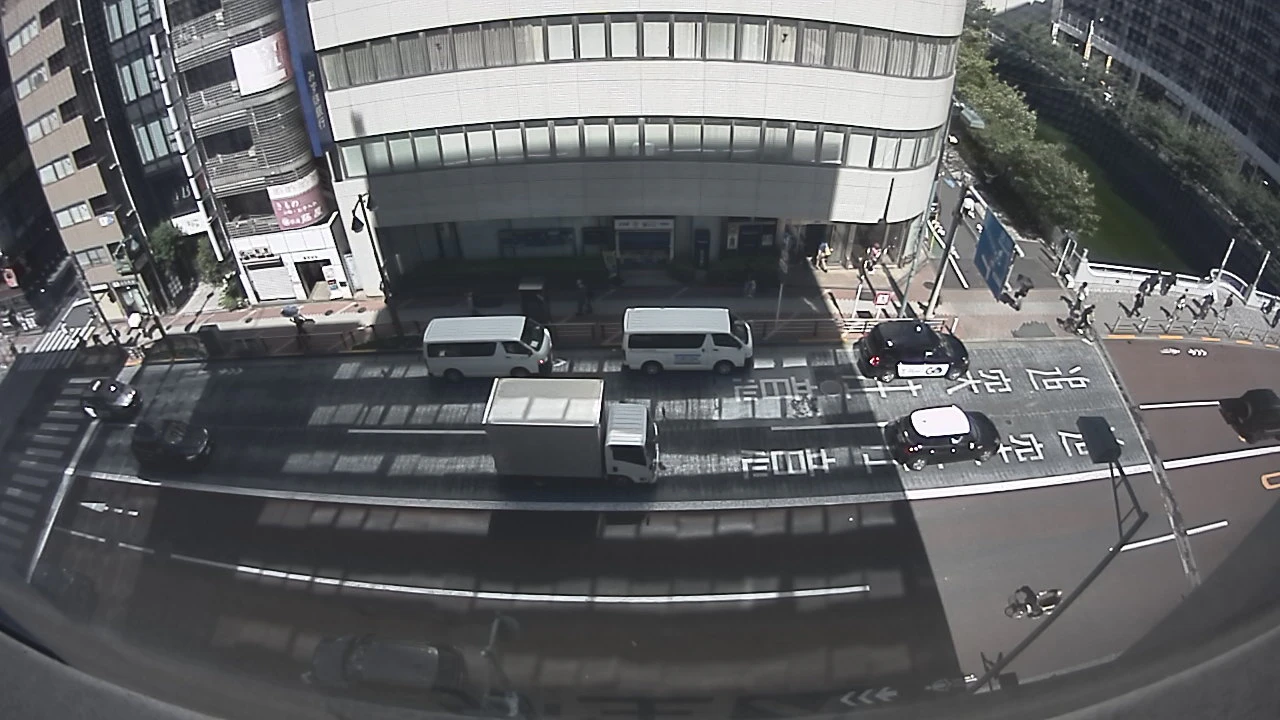
Ah, the shade from office building. That should eventually go away.
 (from Jul 23 11:56)
From picture from few days ago. the shade should move out of the window aorund noon.
Now nothing can stop me from taking the data on this hot and sunny day!
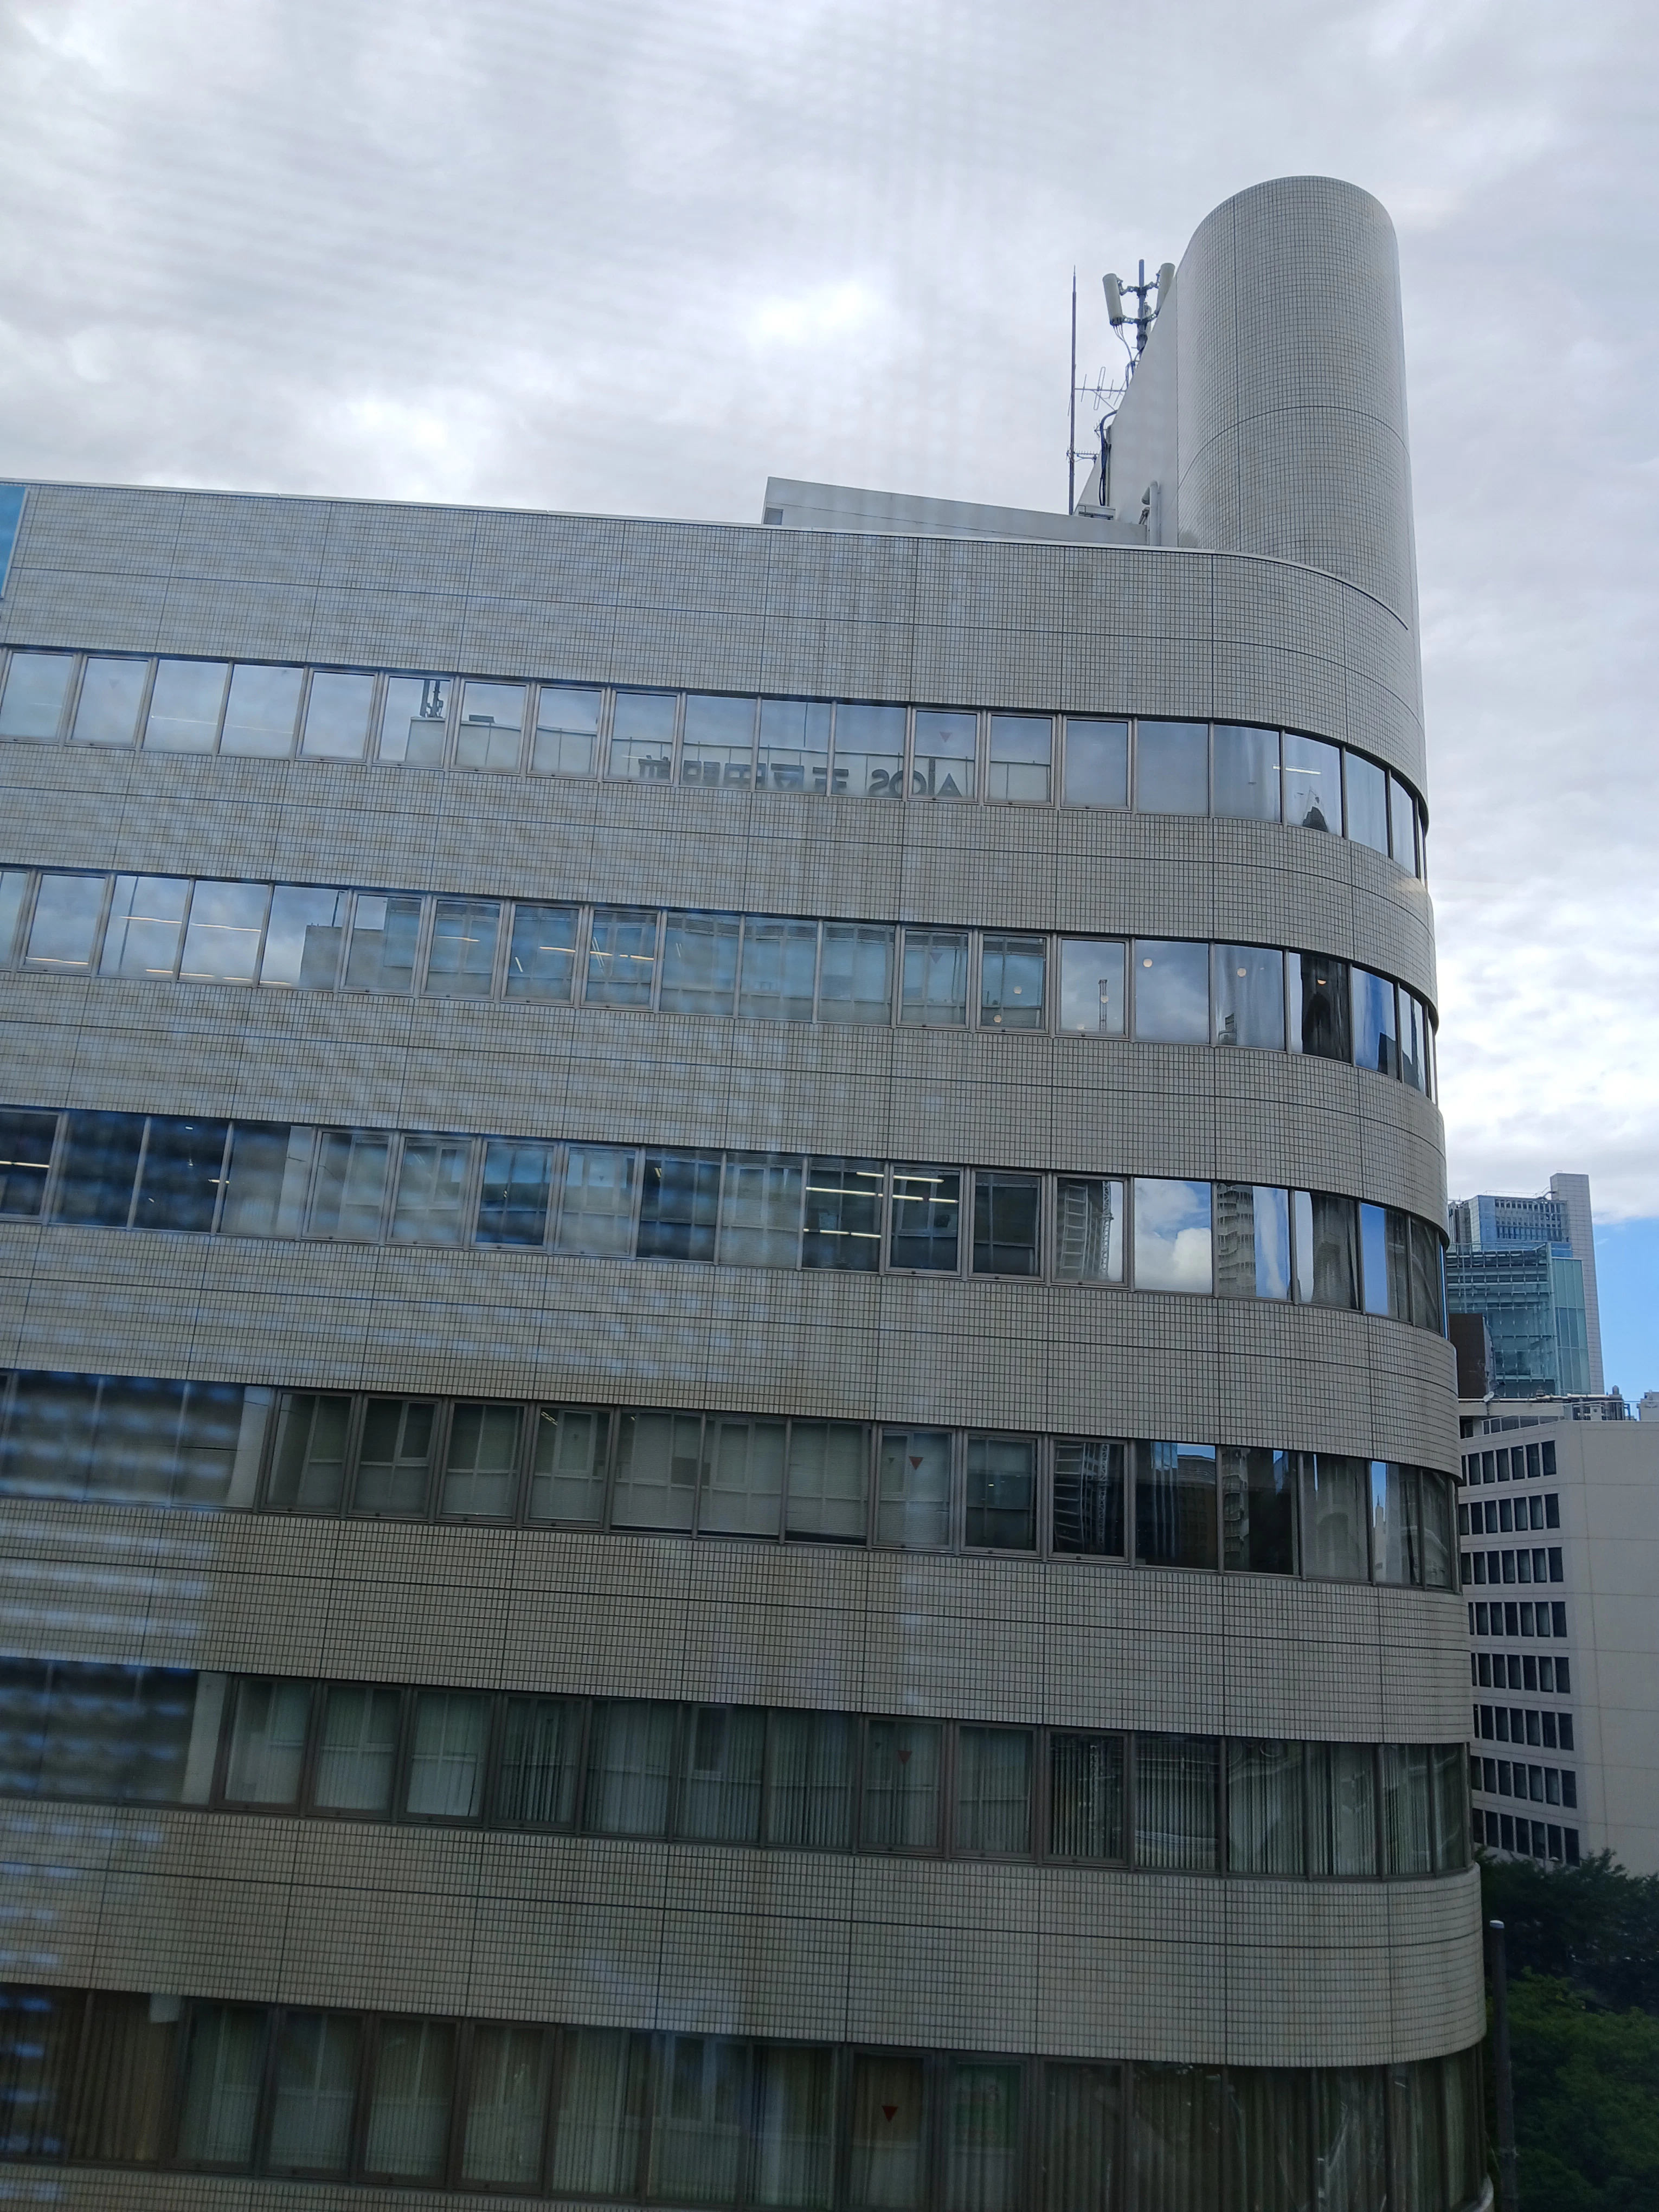
(14:40)
Oh... this is unfortunate.
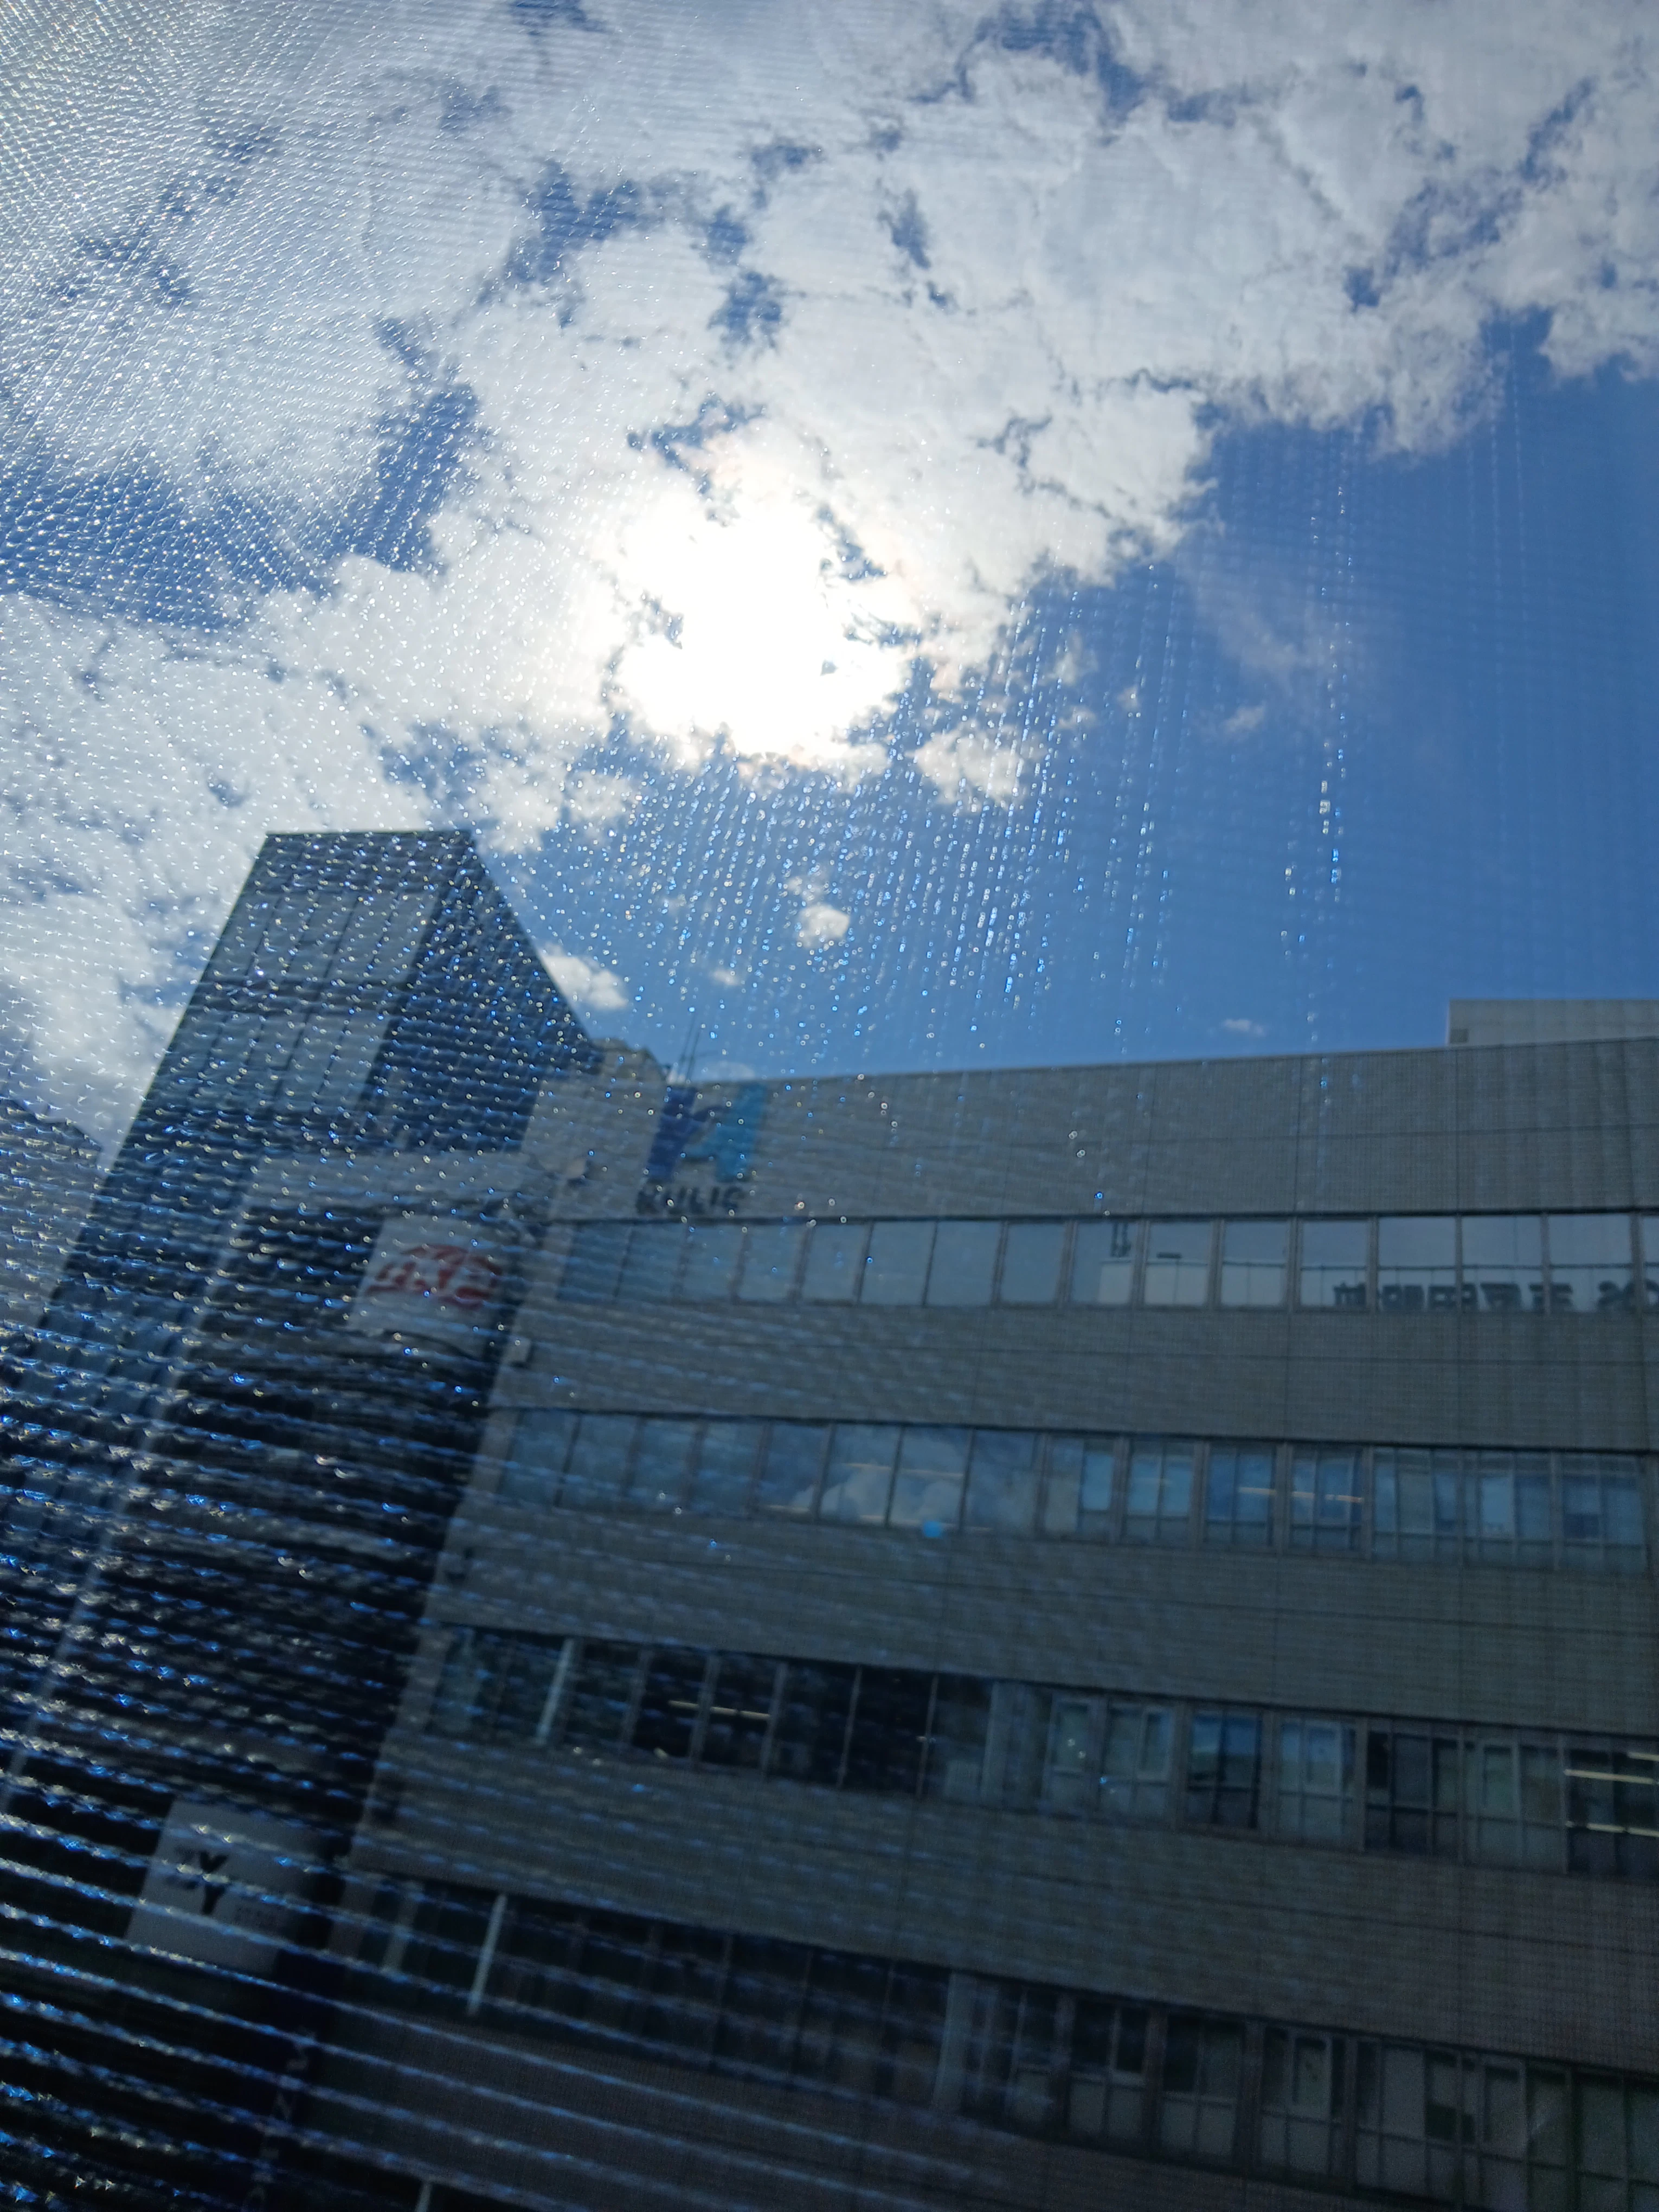
(15:00)
Cloud went away. So I should be able to get data on sunny condition.
Final data
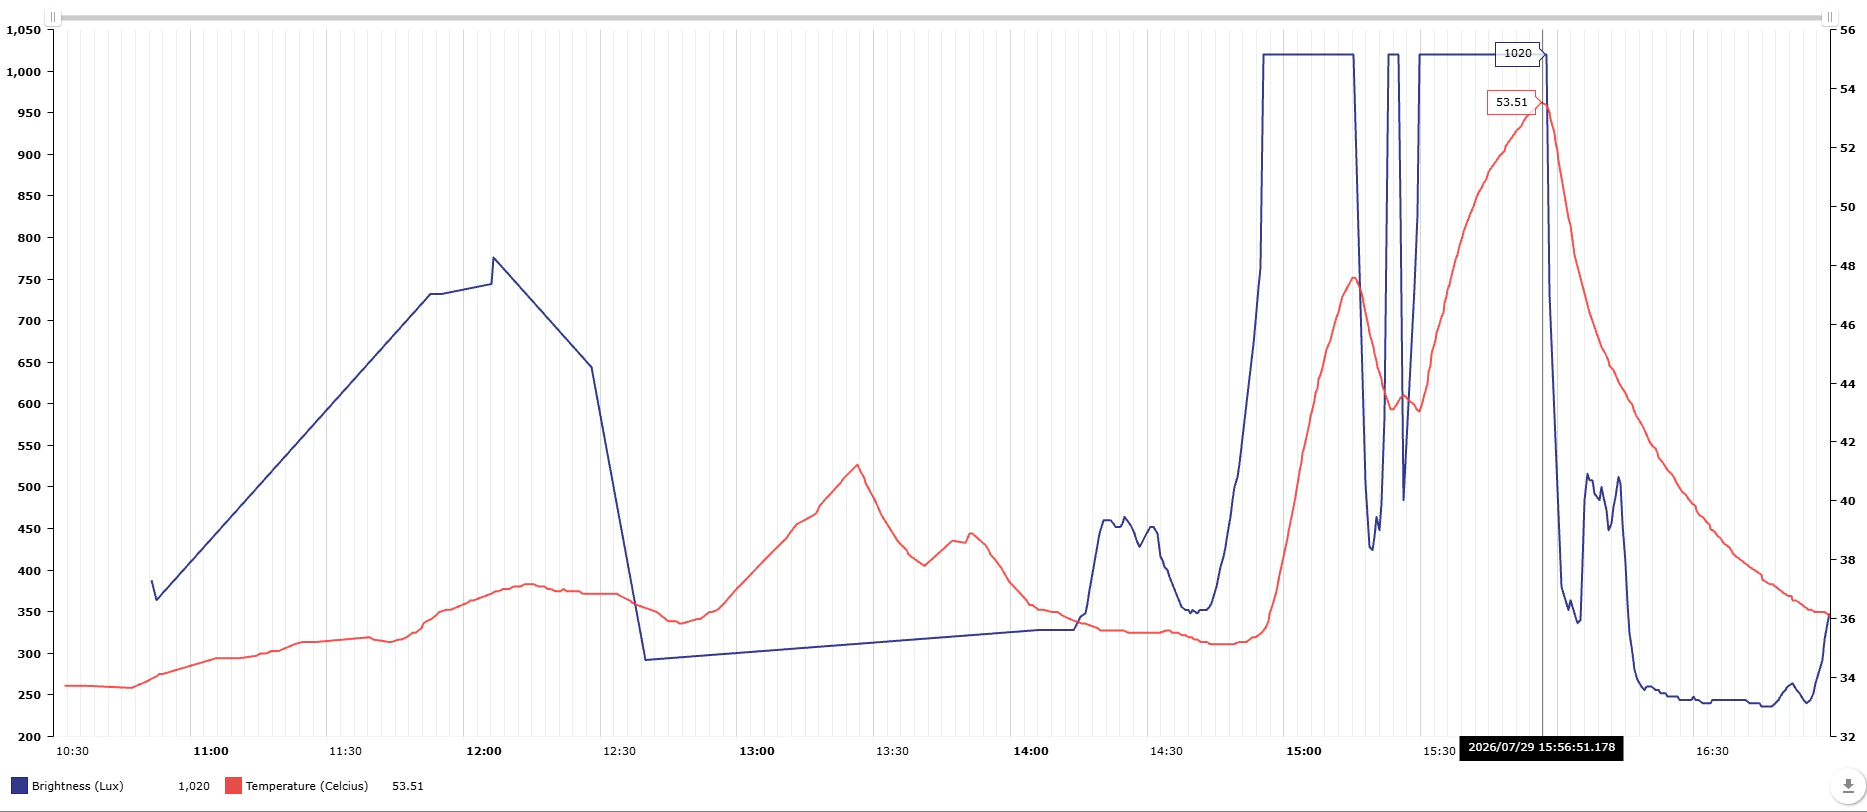
The final data for the day shows good corlelation of two datas, especially reflected in the change from 14:30 to 15:00
Graph in Excel
Let's study data from both days in Excel
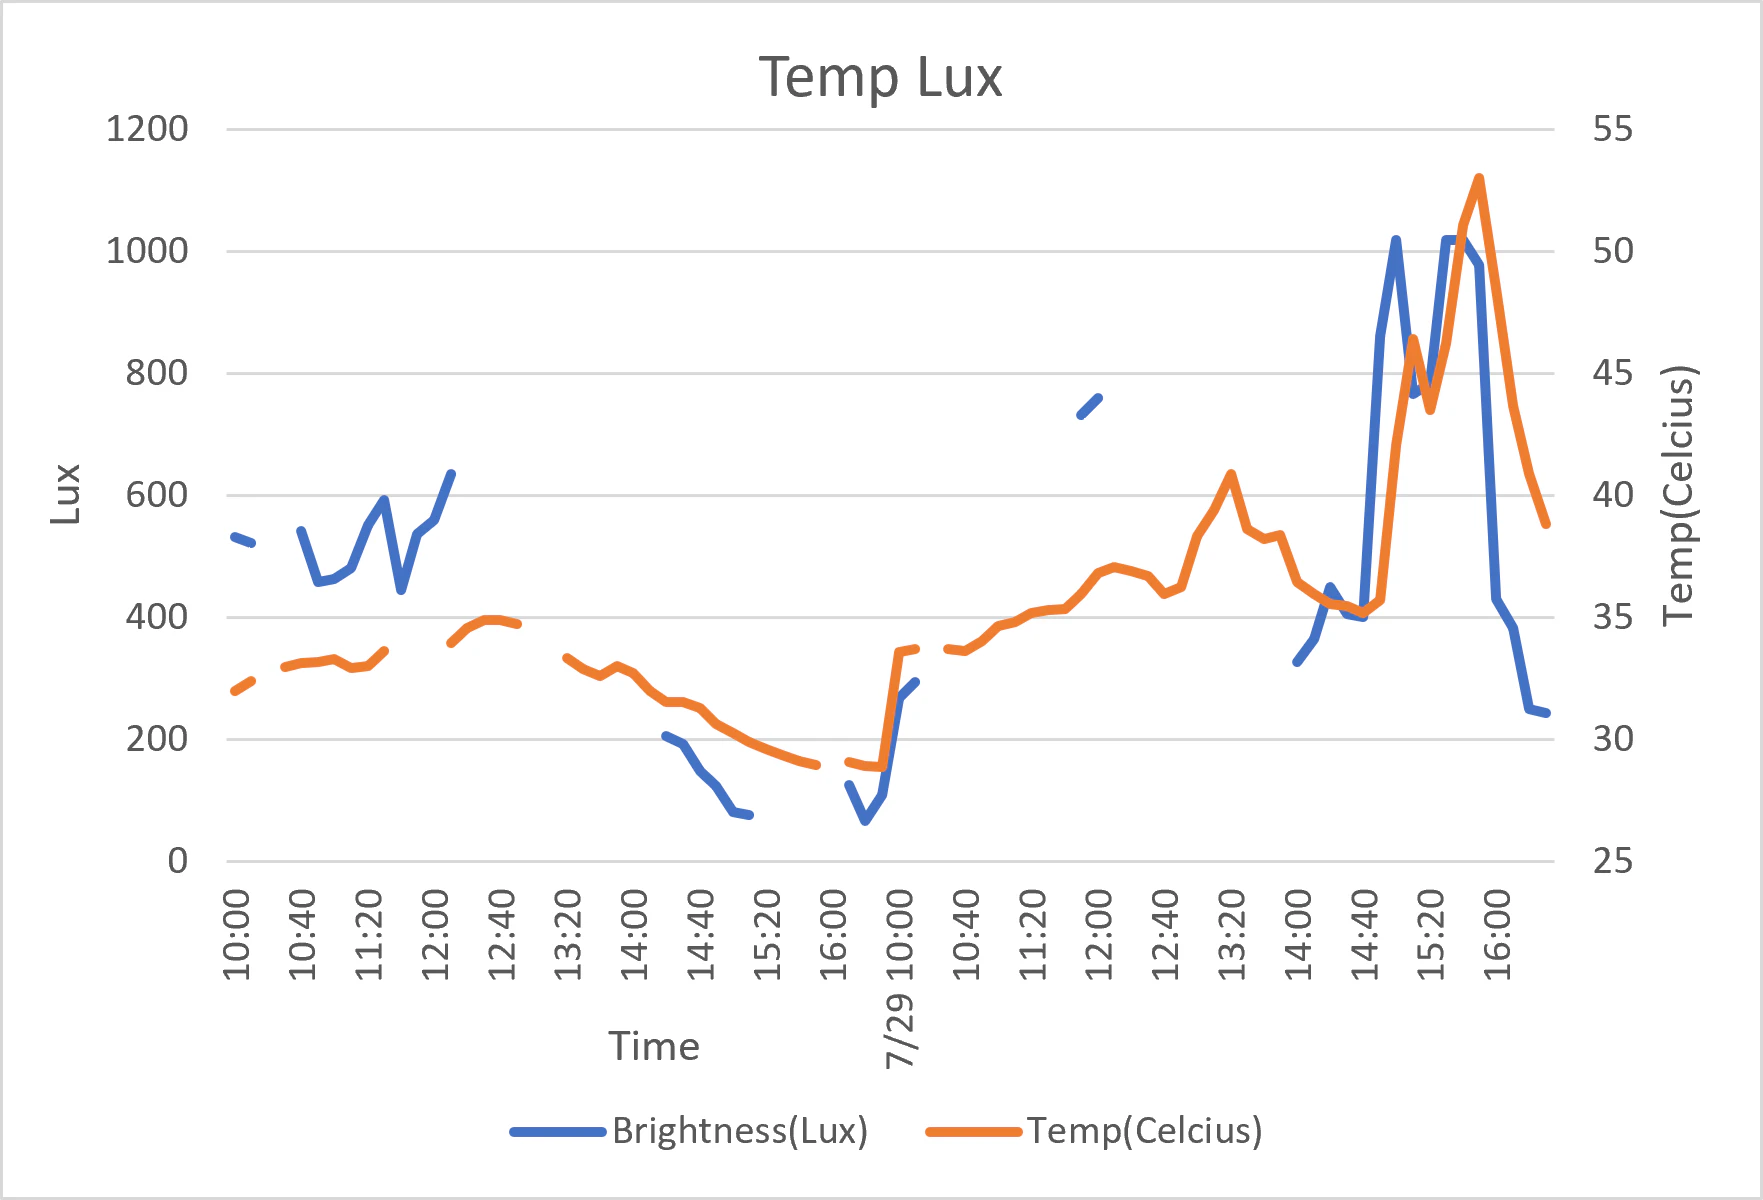
Huh, there is a lot of gaps.
What if I make Excel draw line between gaps?
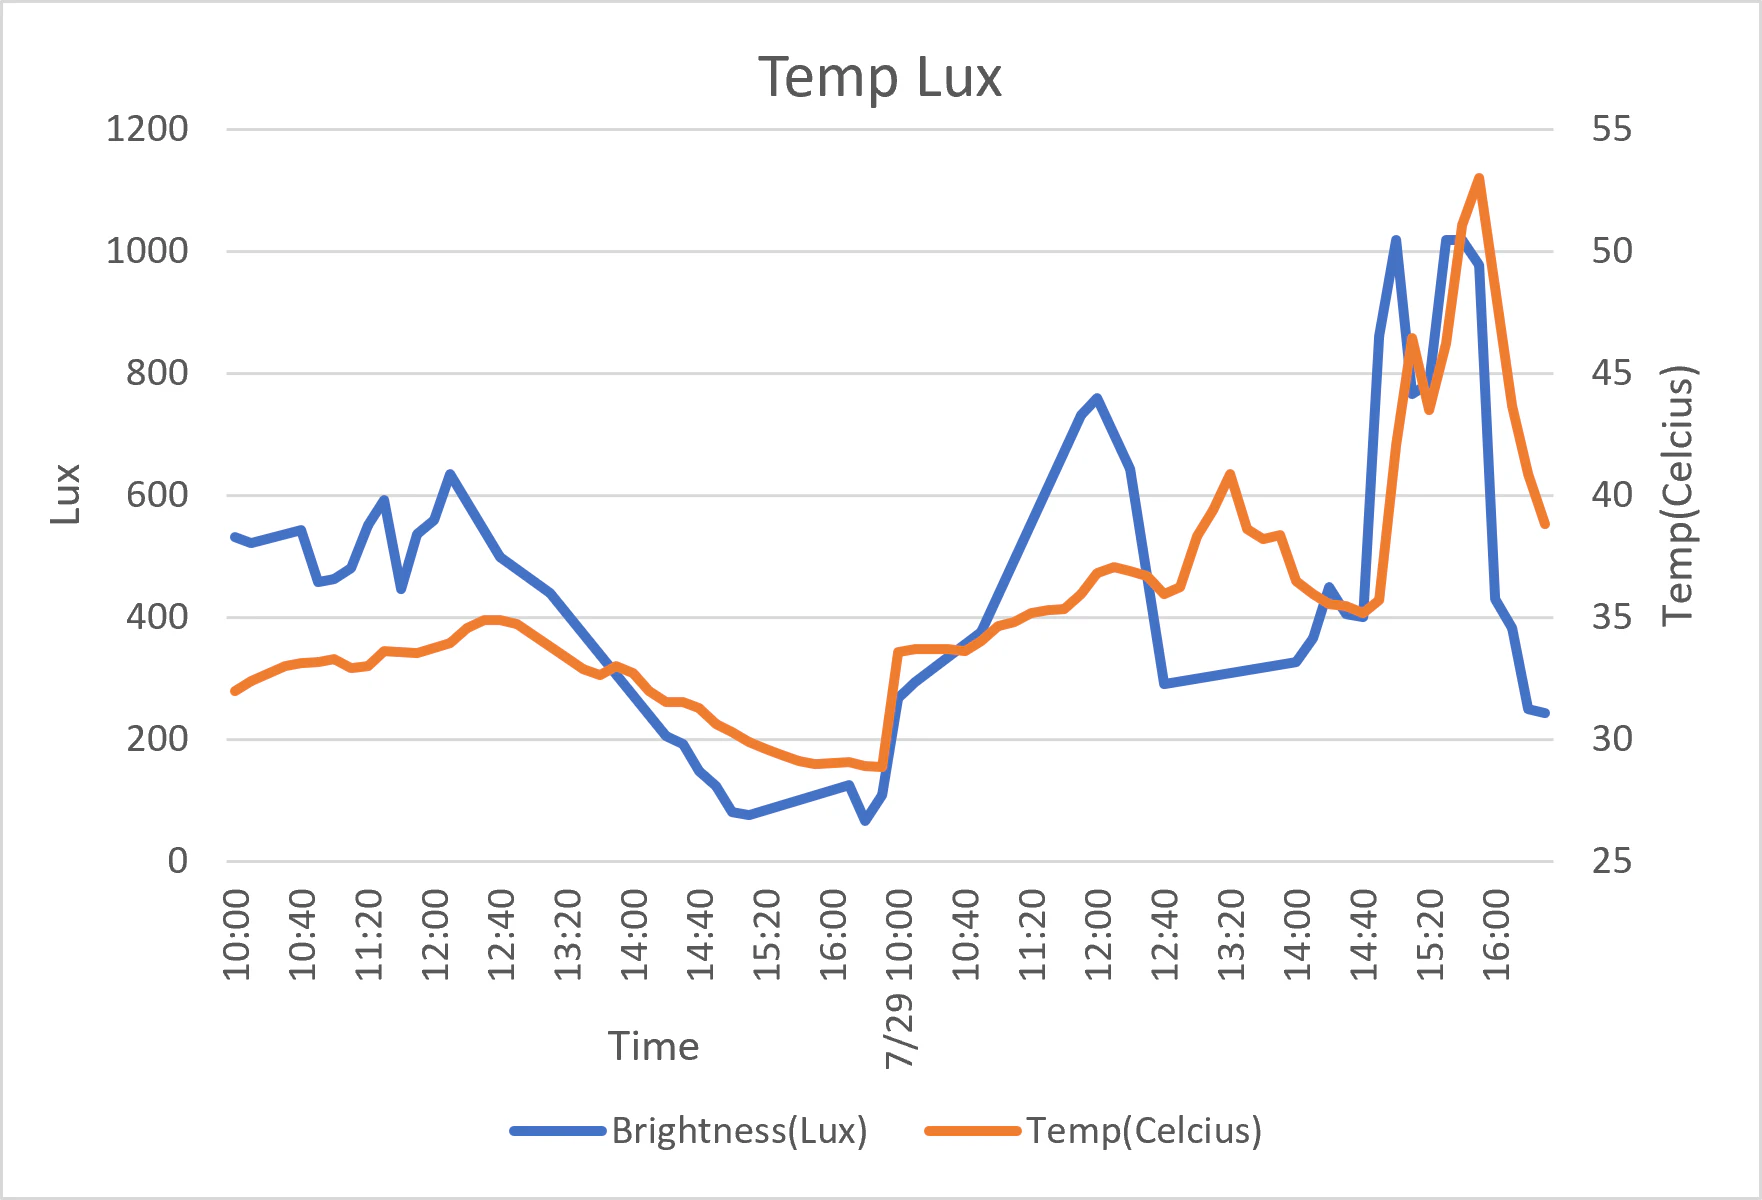
Ah, this must be what RealBoard was doing.
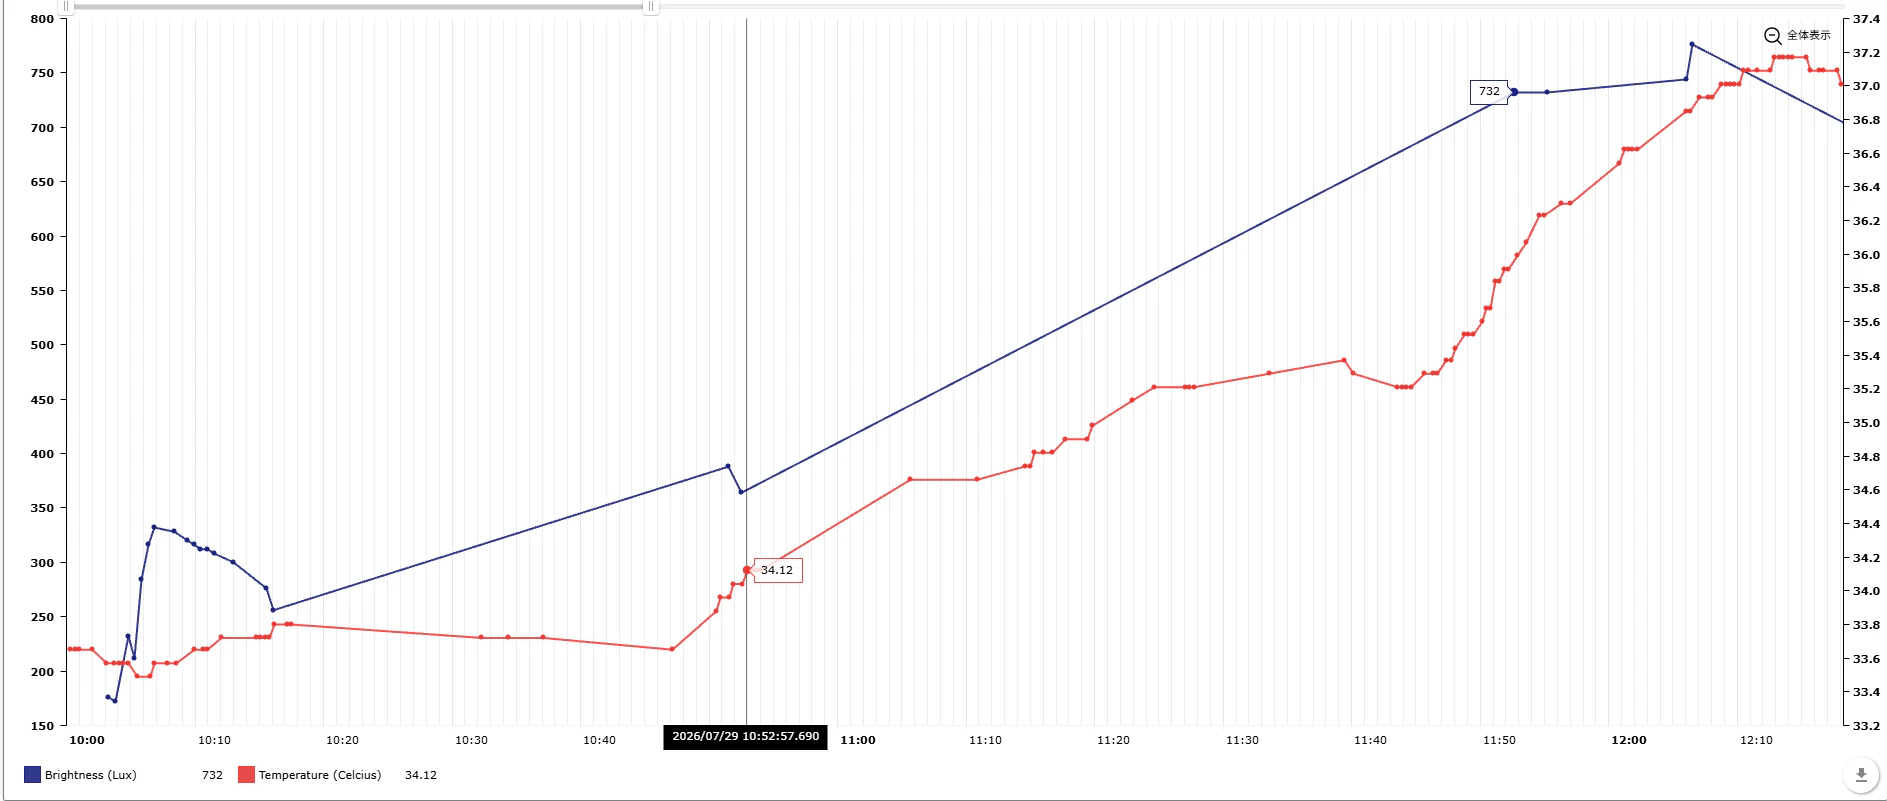
You can see here, the two dots on the blue line are separated by almost whole hour.
Discussion
While the lack of samples by brightness sensor can be spotted across the graph, data from 7/29 14:00 to 16:00 show strong corelation of brightness and tempearature, reflected in the weather changes observed. The measured data supports hypothesis.
Possible cause for errors
- Filter causing the lux values to be lower than an actual brightness, the uneven colouring of filter may have decreased precision of the brightness sensor
- Sensor not sending enough samples, possiblly due to disconnection or temporary loss of energy due to sensor's reliance on solar panels for energy
- The placement of temperature sensor(between heat reflection mat and window) may have caused temperature sensor to show value much higher than actual outside temperature
- Short measurment period may have caused the baissed data to be contained in the result
Room for future improvements
- Use brightness sensor with wider range of lux reading
- Use sensor with more reliable performance and connection
- Measure actual outside temperature by placing temperature sensor outside
- Measure data over longer period to decrease the possible effect of biassed data
Future topic
- Reserch how reliable is weather prediction based on temperature and brightness alone
- Also measure other weather related aspects, such as humidity and amount of percipitation or wind speed
- See if other weather events can be predicted or have corelation, such as relation of percipitation and wind speed
Conclusion
While weather is a difficult topic to study and learn, this experiment show a result that fit the hypothesis overall. And the data over past two days show corelation of temperature and brightness and their corelation reflected in the real change in weather, proving that guessing cuurent weather by recorded data of temperature and brightness are possible to a certain degree. I have also leant some challenges on real life problems can be solved by simple methods.
Tools I used
RealBoard - For gathering the data from sensor, visualizing them as graphs, and exporting them as csv file to enter them in Excel.
Microsoft Excel(2021) - To create the graphs using the data exported.
Claude - To summerise RealBoard manual.