はじめに
本記事では、JavaScriptのグラフ描画ライブラリのamChartを用いて、複数軸の線グラフの実装する際の第2縦軸の作成方法や日本語化などのカスタム方法を共有します。
開発環境
Ruby 2.5.1
Rails 5.2.4.4
amChartsとは
amChartsは、javascriptのグラフ描画ライブラリで、様々な種類の高機能なグラフを描画することができます。
公式リファレンス:https://www.amcharts.com/docs/v4/
日本語の情報が少ないため、カスタマイズする際は、公式リファレンスを参照することをおすすめします。
完成イメージ
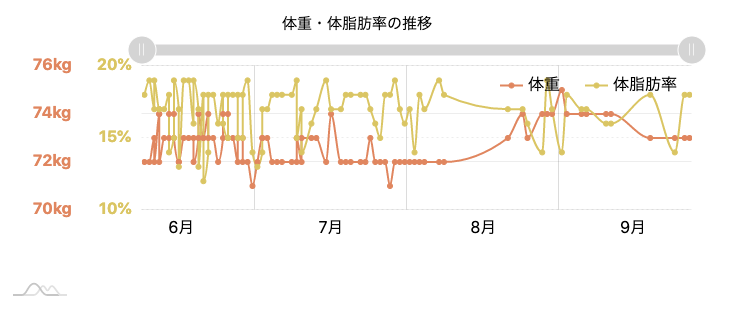
現在、体重と体脂肪率を記録してグラフ化する機能を持つアプリを開発中で、
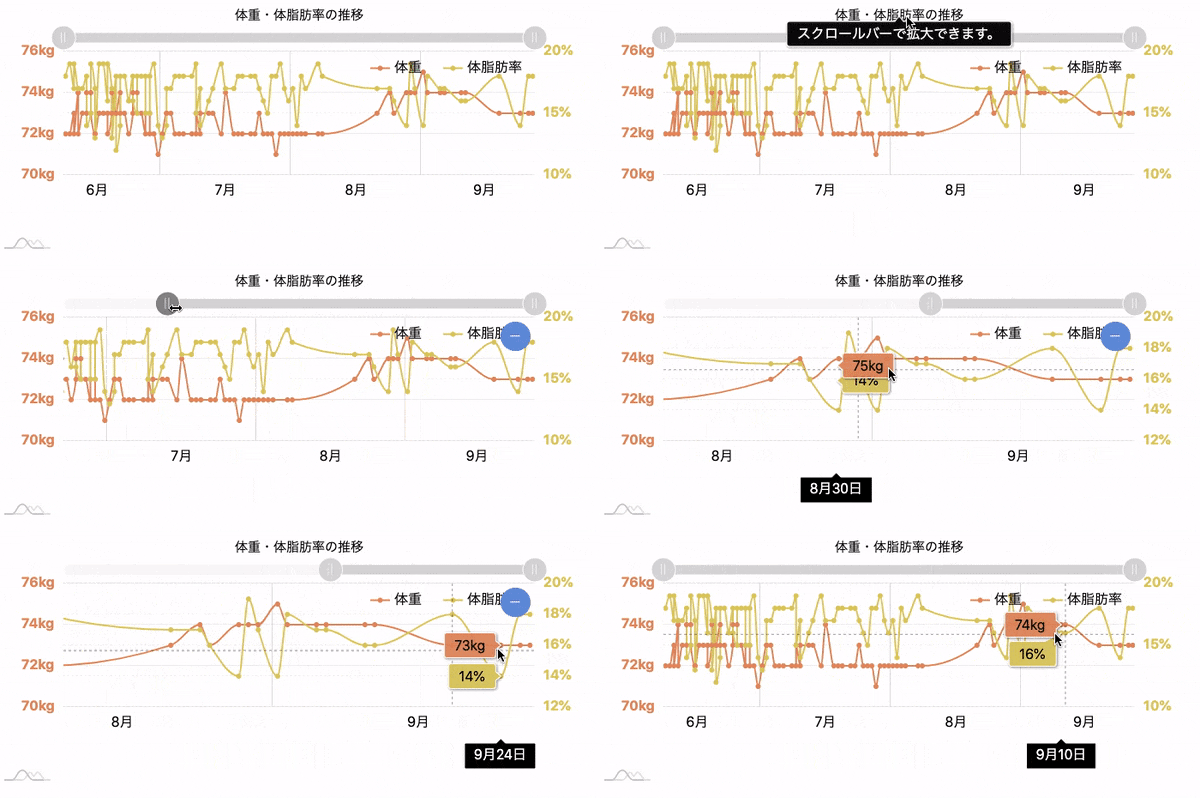
1つのグラフに横軸を日付、第1縦軸に体重、第2縦軸に体脂肪率を描画するため、amCharts4を使用しました。
- 横軸:日付、第1縦軸:体重、第2縦軸:体脂肪率
- カーソル上のデータをTooltipで表示
- スクロールバーで拡大
- タイトルをマウスホバーするとTooltipを表示
実装手順/解説
amChartsの導入
amChartsの導入方法はこちらの記事が参考になります。
amcharts 4 Demos を使ってグラフを作成
横軸の値が不連続な場合のグラフの作成
本記事の横軸の値が不連続になる場合のグラフの作成は、下記の記事を参考にさせていただきました。
Railsにて不連続な間隔(日付など)で投稿された値をamChartsを使って折れ線グラフを作成する。
デモデータの準備
csvファイルをseedして以下のようなデモデータを準備します。
| id | date | weight | body_fat_percentage |
|---|---|---|---|
| 1 | 2020/06/08 | 72 | 15 |
| 2 | ・・・ | ・・・ | ・・・ |
完成サンプルコード
解説の前にサンプルコードを貼っておきます。
Rails側の記述は今回割愛します。
record.html.erb
<style>
  #chartdiv {
    width: 700px;
    height: 300px;
  }
</style>

//必要なJSファイルの読み込み
<script src="https://www.amcharts.com/lib/4/core.js"></script>
<script src="https://www.amcharts.com/lib/4/charts.js"></script>
<script src="https://www.amcharts.com/lib/4/themes/animated.js"></script>
<script src="//www.amcharts.com/lib/4/lang/ja_JP.js"></script>

<script>
am4core.ready(function() {

am4core.useTheme(am4themes_animated);

var chart = am4core.create("chartdiv", am4charts.XYChart);
chart.dateFormatter.language = new am4core.Language();
chart.dateFormatter.language.locale = am4lang_ja_JP;
chart.language.locale["_date_day"] = "MMMdd日";
chart.language.locale["_date_year"] = "yyyy年";

const weights = <%== JSON.dump(@weights) %>;
const body_fat_percentages = <%== JSON.dump(@body_fat_percentages) %>;
const dates = <%== JSON.dump(@dates) %>;

var firstDate = new Date(dates[0])
var lastDate = new Date(dates.slice(-1)[0])
var termDate = (lastDate - firstDate) / 1000 / 60 / 60 / 24 + 1

function generateChartData() {
  var chartData = [];
  for (var j = 0; j < weights.length; j++ ) {
    for (var i = 0; i < termDate; i++ ) {
      var newDate = new Date(firstDate)
      newDate.setDate(newDate.getDate() + i);
      if ((new Date(dates[j])) - (newDate) == 0 ){
        weight = weights[j]
        body_fat_percentage = body_fat_percentages[j]
        chartData.push({
          date1: newDate,
          weight: weight,
          date2: newDate,
          body_fat_percentage: body_fat_percentage
        });
      }
    }
  }
  return chartData;
}

chart.data = generateChartData();

//グラフタイトルの設定
var title = chart.titles.create();
title.text = "体重・体脂肪率の推移"; //グラフタイトルの設定
title.fontSize = 15; //グラフタイトルのフォントサイズの設定
//タイトルをマウスホバーした際に表示させるTooltipの表示内容設定
title.tooltipText = "スクロールバーで拡大できます。";

//第1横軸の設定
var dateAxis = chart.xAxes.push(new am4charts.DateAxis());
dateAxis.renderer.grid.template.location = 0;
dateAxis.renderer.labels.template.fill = am4core.color("#ffffff");

//第2横軸の設定
var dateAxis2 = chart.xAxes.push(new am4charts.DateAxis());
dateAxis2.tooltip.disabled = true; //Tooltipの非表示設定
dateAxis2.renderer.grid.template.location = 0;
dateAxis2.renderer.labels.template.fill = am4core.color("#000000");

//第1縦軸の設定
var valueAxis = chart.yAxes.push(new am4charts.ValueAxis());
valueAxis.tooltip.disabled = true;
valueAxis.renderer.labels.template.fill = am4core.color("#e59165");
valueAxis.renderer.minWidth = 60;
valueAxis.renderer.labels.template.adapter.add("text", function(text) {
  return text + "kg";
});
valueAxis.renderer.fontWeight = "bold"; //軸の値を太字に変更

//第2縦軸の設定
var valueAxis2 = chart.yAxes.push(new am4charts.ValueAxis());
valueAxis2.tooltip.disabled = true;
valueAxis2.renderer.grid.template.strokeDasharray = "2,3";
valueAxis2.renderer.labels.template.fill = am4core.color("#dfcc64");
valueAxis2.renderer.minWidth = 60;
valueAxis2.renderer.labels.template.adapter.add("text", function(text) {
  return text + "%";
});
valueAxis2.renderer.opposite = true; //第2縦軸を右側に設定
valueAxis2.renderer.fontWeight = "bold"; //軸の値を太字に変更

//第1縦軸用の値の設定
var series = chart.series.push(new am4charts.LineSeries());
series.name = "体重";
series.dataFields.dateX = "date1";
series.dataFields.valueY = "weight";
series.tooltipText = "{valueY.value}kg";
series.fill = am4core.color("#e59165");
series.stroke = am4core.color("#e59165");
series.smoothing = "monotoneX";
series.strokeWidth = 2;

//系列のポイントの設定(第1縦軸)
var bullet = series.bullets.push(new am4charts.Bullet());
var circle = bullet.createChild(am4core.Circle);
circle.width = 5;
circle.height = 5;
circle.horizontalCenter = "middle";
circle.verticalCenter = "middle";

//第1縦軸用の値の設定
var series2 = chart.series.push(new am4charts.LineSeries());
series2.name = "体脂肪率";
series2.dataFields.dateX = "date2";
series2.dataFields.valueY = "body_fat_percentage";
series2.yAxis = valueAxis2;
series2.xAxis = dateAxis2;
series2.tooltipText = "{valueY.value}%"; //ツールチップの表示設定
series2.fill = am4core.color("#dfcc64"); //ツールチップの色
series2.stroke = am4core.color("#dfcc64"); //グラフの線の色
series2.smoothing = "monotoneX";
series2.strokeWidth = 2;

//系列のポイントの設定(第2縦軸)
var bullet2 = series2.bullets.push(new am4charts.Bullet());
var circle2 = bullet2.createChild(am4core.Circle);
circle2.width = 5;
circle2.height = 5;
circle2.horizontalCenter = "middle";
circle2.verticalCenter = "middle";

chart.scrollbarX = new am4core.Scrollbar(); //スクロールバーの設定

//カーソルの設定
chart.cursor = new am4charts.XYCursor();
chart.cursor.xAxis = dateAxis2;

//凡例の設定
chart.legend = new am4charts.Legend();
chart.legend.parent = chart.plotContainer;
chart.legend.zIndex = 100;
chart.legend.position = "top";
chart.legend.contentAlign = "right";

//グリッド線の設定
valueAxis2.renderer.grid.template.strokeOpacity = 0.07;
dateAxis2.renderer.grid.template.strokeOpacity = 0.07;
dateAxis.renderer.grid.template.strokeOpacity = 0.07;
valueAxis.renderer.grid.template.strokeOpacity = 0.07;

});
</script>

<div id="chartdiv"></div>
解説
複数縦軸の設定
サンプルコードの通り、複数軸のグラフの場合、各軸及び各値の設定が必要になります。
それぞれの使用するデータなどの設定を行います。
- 第1横軸:dateAxis
- 第2横軸:dateAxis2
- 第1縦軸:valueAxis
- 第2縦軸:valueAxis2
- 体重:series
- 体脂肪率:series2
日本語化
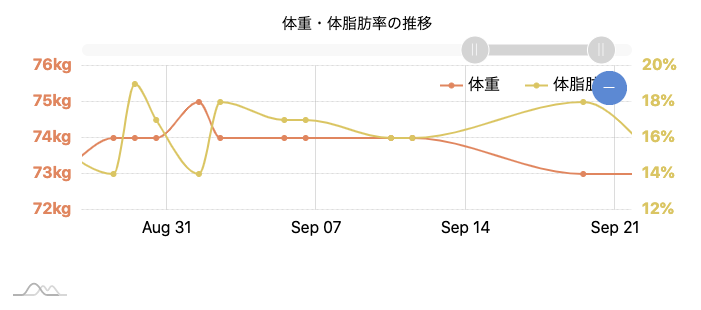
横軸が日付の場合、デフォルトの表記が米国式のため下図のように英語表記になります。

そのままでも問題は無いのですが、もし「◯月◯日」という表記にしたい場合は、以下の設定を追加します。
標準の翻訳設定では、例えば「Aug」を「8月」に翻訳はできますが、何日の方は「〇〇日」とは翻訳されないため、独自ルールを以下のように追加します。年も同様に行えます。
<script src="//www.amcharts.com/lib/4/lang/ja_JP.js"></script> //localeファイルの呼び出し
<script>
//中略
chart.dateFormatter.language = new am4core.Language(); //標準の翻訳設定
chart.dateFormatter.language.locale = am4lang_ja_JP; //標準の翻訳設定
chart.language.locale["_date_day"] = "MMMdd日"; 独自ルールで上書き
chart.language.locale["_date_year"] = "yyyy年"; 独自ルールで上書き
//中略
</script>
【参考リンク】
https://www.amcharts.com/docs/v4/concepts/locales/
https://github.com/amcharts/amcharts4/blob/master/src/lang/ja_JP.ts
第2縦軸の設定
デフォルトの設定ですと第1縦軸と第2縦軸は両方左側にあります。

少し見にくいので、第2縦軸を右側に変更したい時は、以下の設定を追加します。
valueAxis2.renderer.opposite = true; //第2縦軸を右側に設定
他の追加設定を紹介
- データポイントの設定
各系列毎にデータポイントの設定が行えます。circleをsquareに変えると四角に変更できます。
var bullet = series.bullets.push(new am4charts.Bullet());
var circle = bullet.createChild(am4core.Circle);
circle.width = 5;
circle.height = 5;
circle.horizontalCenter = "middle";
circle.verticalCenter = "middle";
【参考リンク】
https://www.amcharts.com/docs/v4/concepts/bullets/
- グラフの線を曲線に変更
series.smoothing = "monotoneX";
- 色の変更
series2.fill = am4core.color("#dfcc64"); //ツールチップの色
series2.stroke = am4core.color("#dfcc64"); //グラフの線の色
まとめ
amChartsを使うと高機能なグラフを描画できます。
折れ線グラフ以外にも様々なグラフを作ることができます。
日本語の情報が少ないので、カスタマイズしたい場合は、公式リファレンスを参照することをおすすめします。
参考URL
amcharts 4 Demos を使ってグラフを作成
Railsにて不連続な間隔(日付など)で投稿された値をamChartsを使って折れ線グラフを作成する。
