python/tensorflow初心者が、jupyter+tensorflow環境を構築してHello Worldする - Qiita
の続きで、今度はjupyter上にtensorBoardのグラフを表示させる手順です。
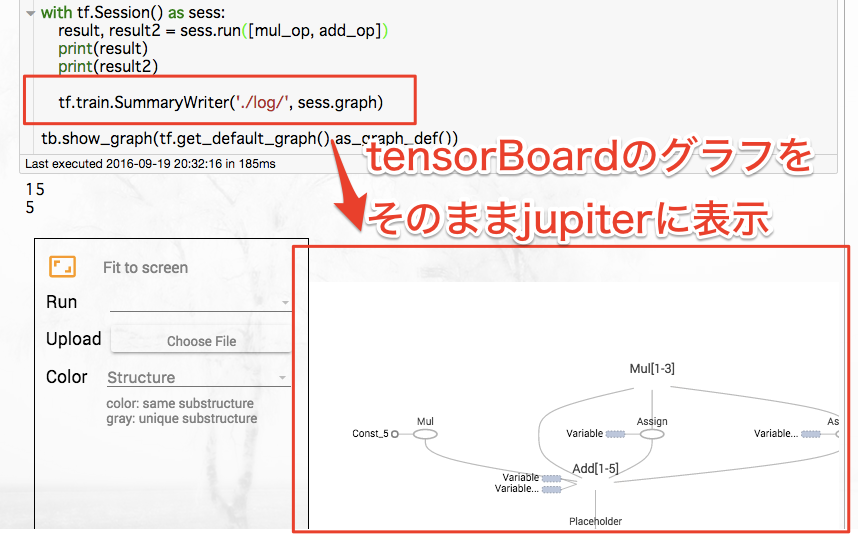
tensorBoardは非常に便利なので、そのままjupyter上に表示させちゃおう!という手順です.
目標画面
作成手順
tensorboardグラフを表示させるには、色々と準備が必要です。
何度も使うことが想定されるため、tensorboard.pyという名前で面倒くさい部分を追い出し、呼び出す時でサクッと使えるようにしていきます。
tensorboard.pyを作成
tensorboardを表示させる部分をまず作っていきます
空ファイルを作成
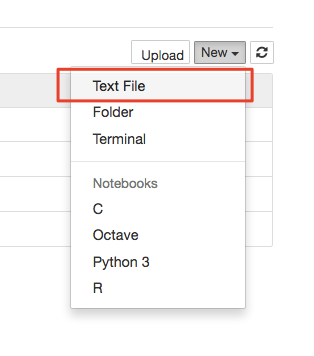
空ファイルを作成するため、以下のようにnewからTextFileを選んで下さい
(コマンドラインからやる人は、単純にtensorboard.pyを作ってOKです)。
作成場所はどこでもいいですが、notebookと同じフォルダに作ったものと想定しています
リネームとコピペ
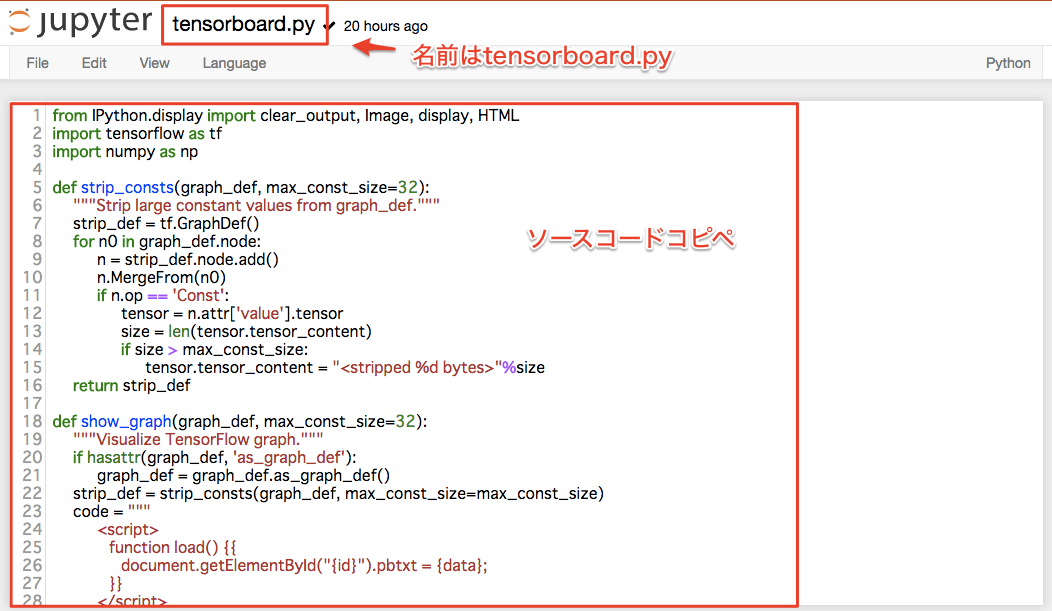
作ったままだとuntitled.txtなので、名前の部分を押下してtensorboard.pyとします。
ソースコードは以下を貼り付けて下さい。サイズ変更などできますのでおこのみで
from IPython.display import clear_output, Image, display, HTML
import tensorflow as tf
import numpy as np
def strip_consts(graph_def, max_const_size=32):
"""Strip large constant values from graph_def."""
strip_def = tf.GraphDef()
for n0 in graph_def.node:
n = strip_def.node.add()
n.MergeFrom(n0)
if n.op == 'Const':
tensor = n.attr['value'].tensor
size = len(tensor.tensor_content)
if size > max_const_size:
tensor.tensor_content = bytes("<stripped %d bytes>"%size, 'utf-8')
return strip_def
def show_graph(graph_def, max_const_size=32):
"""Visualize TensorFlow graph."""
if hasattr(graph_def, 'as_graph_def'):
graph_def = graph_def.as_graph_def()
strip_def = strip_consts(graph_def, max_const_size=max_const_size)
code = """
<script>
function load() {{
document.getElementById("{id}").pbtxt = {data};
}}
</script>
<link rel="import" href="https://tensorboard.appspot.com/tf-graph-basic.build.html" onload=load()>
<div style="height:600px">
<tf-graph-basic id="{id}"></tf-graph-basic>
</div>
""".format(data=repr(str(strip_def)), id='graph'+str(np.random.rand()))
iframe = """
<iframe seamless style="width:1200px;height:620px;border:0" srcdoc="{}"></iframe>
""".format(code.replace('"', '"'))
display(HTML(iframe))
参考: Simple way to visualize a TensorFlow graph in Jupyter? - Stack Overflow
確認
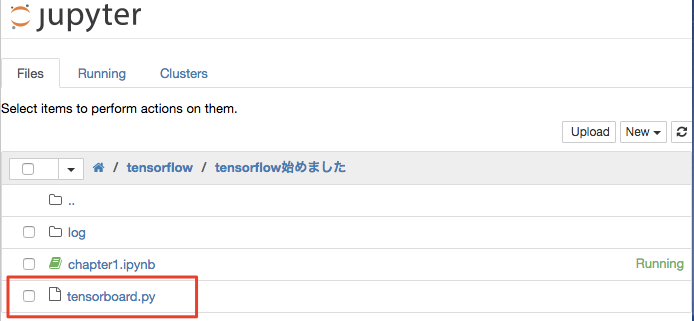
以下のようにファイルが作られていればOK
呼び出し側を修正する
作成したtensorboard.pyを読み込むimport tensorboard as tbと、表示するコードであるtb.show_graphを表示させたいプログラムに追加します。
import tensorflow as tf
import tensorboard as tb   # -> 追加

const1 = tf.constant(2)
const2 = tf.constant(3)
add_op = tf.add(const1, const2)
mul_op = tf.mul(add_op, const2)

with tf.Session() as sess:
    result, result2 = sess.run([mul_op, add_op])
    print(result)
    print(result2)

    tf.summary.FileWriter('./log/', sess.graph)

tb.show_graph(tf.get_default_graph().as_graph_def()) # -> 追加
後はctrl+Enterで実行すれば表示されます
備考
コピペするソースコードを上手く改変すれば、もっと使いやすいものになりそう。
そして、本当はgraphよりもeventsを表示させたいけど、やり方が見つからなかった(´ω`)


