1.はじめに
今回は、ダイクストラ法の最短経路を求める過程を視覚化させてみました。
ダイクストラ法で経路を求める過程を1ステップずつ確認できるようにしました。
5,6年前にC言語で同じようなのを作った事を思い出し進めました。。。
2.環境
windows10
vscode
ライブラリ
networkx
matplotlib.pyplot
random
heapq
3.コード
グラフの生成
# グラフの生成
def generate_graph(num_nodes, num_edges):
    G = nx.gnm_random_graph(num_nodes, num_edges, seed=42)
    for u, v in G.edges():
        G[u][v]['weight'] = random.randint(1, 10)
    return G
グラフ描画
def draw_graph(G, pos, path=None):
    # 前のノード/エッジの描画をクリアしない
    nx.draw_networkx_nodes(G, pos, node_color='blue', ax=ax)
    nx.draw_networkx_labels(G, pos, font_color='white', ax=ax)  # ノードラベルを白色で描画
    nx.draw_networkx_edges(G, pos, ax=ax)
    if path and len(path) > 1:
        # 新しいパスのエッジのみ赤色で描画
        edges = [(path[i], path[i + 1]) for i in range(len(path) - 1)]
        nx.draw_networkx_edges(G, pos, edgelist=edges, edge_color='red', width=2, ax=ax)
ダイクストラ法
# ダイクストラ法
def dijkstra(G, start, end):
    visited = set()
    #∞で初期化
    distances = {node: float('inf') for node in G.nodes()}
    distances[start] = 0
    queue = [(0, start, [start])]
    while queue:
        (cost, node, path) = heapq.heappop(queue)
        if node not in visited:
            visited.add(node)
            if node == end:
                return path
            for next_node, data in G[node].items():
                new_cost = cost + data['weight']
                if new_cost < distances[next_node]:
                    distances[next_node] = new_cost
                    heapq.heappush(queue, (new_cost, next_node, path + [next_node]))
    return []
グラフを更新させる
def update(val):
    global current_path, current_step
    print(f"Current step before update: {current_step}")  # デバッグステートメント
    if len(full_path) > current_step + 1:
        current_path.append(full_path[current_step + 1])
        current_step += 1
        print(f"Current step after update: {current_step}, Current path: {current_path}")  # デバッグステートメント
        draw_graph(G, pos, current_path)  # グラフを更新
        plt.draw()
    else:
        print("Reached the end of the path or no more steps available.")  # デバッグステートメント
python
import matplotlib.pyplot as plt
from matplotlib.widgets import Button
from matplotlib.widgets import TextBox
import networkx as nx
import random
import heapq


# グラフの生成
def generate_graph(num_nodes, num_edges):
    G = nx.gnm_random_graph(num_nodes, num_edges, seed=42)
    for u, v in G.edges():
        G[u][v]['weight'] = random.randint(1, 10)
    return G

def draw_graph(G, pos, path=None):
    # 前のノード/エッジの描画をクリアしない
    nx.draw_networkx_nodes(G, pos, node_color='blue', ax=ax)
    nx.draw_networkx_labels(G, pos, font_color='white', ax=ax)  # ノードラベルを白色で描画
    nx.draw_networkx_edges(G, pos, ax=ax)
    if path and len(path) > 1:
        # 新しいパスのエッジのみ赤色で描画
        edges = [(path[i], path[i + 1]) for i in range(len(path) - 1)]
        nx.draw_networkx_edges(G, pos, edgelist=edges, edge_color='red', width=2, ax=ax)

# ダイクストラ法
def dijkstra(G, start, end):
    visited = set()
    distances = {node: float('inf') for node in G.nodes()}
    distances[start] = 0
    queue = [(0, start, [start])]
    while queue:
        (cost, node, path) = heapq.heappop(queue)
        if node not in visited:
            visited.add(node)
            if node == end:
                return path
            for next_node, data in G[node].items():
                new_cost = cost + data['weight']
                if new_cost < distances[next_node]:
                    distances[next_node] = new_cost
                    heapq.heappush(queue, (new_cost, next_node, path + [next_node]))
    return []

# 更新関数
def update(val):
    global current_path, current_step
    print(f"Current step before update: {current_step}")  # デバッグステートメント
    if len(full_path) > current_step + 1:
        current_path.append(full_path[current_step + 1])
        current_step += 1
        print(f"Current step after update: {current_step}, Current path: {current_path}")  # デバッグステートメント
        draw_graph(G, pos, current_path)  # グラフを更新
        plt.draw()
    else:
        print("Reached the end of the path or no more steps available.")  # デバッグステートメント

def submit(text):
    try:
        start, end = map(int, text.split())
        global full_path
        full_path = dijkstra(G, start, end)
        global current_path
        current_path = [full_path[0]] if full_path else []
        global current_step
        current_step = 0
        draw_graph(G, pos, current_path)
        plt.draw()
    except Exception as e:
        print(f"Error: {e}")

# グラフの準備
G = generate_graph(10, 15)
pos = nx.spring_layout(G, seed=42)  # ノードの位置を計算し、保持
full_path = dijkstra(G, 2, 8)
current_path = [full_path[0]]
current_step = 0
print(f"Full path: {full_path}")  # 経路を出力して確認

# 描画の準備
fig, ax = plt.subplots()
plt.subplots_adjust(bottom=0.2)
draw_graph(G, pos, current_path)  # 初期状態の描画

# ボタンの追加
axnext = plt.axes([0.81, 0.05, 0.1, 0.075])
btnext = Button(axnext, '進む')
btnext.on_clicked(update)

for u, v, data in G.edges(data=True):
    print(f"Edge from {u} to {v} with weight {data['weight']}")
# テキストボックスの追加
axbox = plt.axes([0.1, 0.05, 0.2, 0.075])
text_box = TextBox(axbox, 'S, E', initial="0 4")
text_box.on_submit(submit)

plt.show()
4.結果
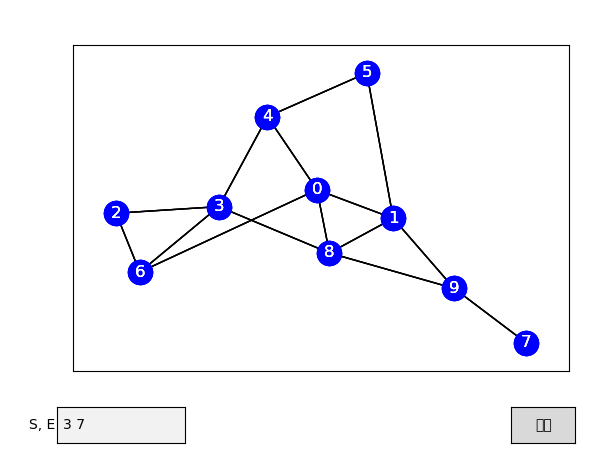
初期状態
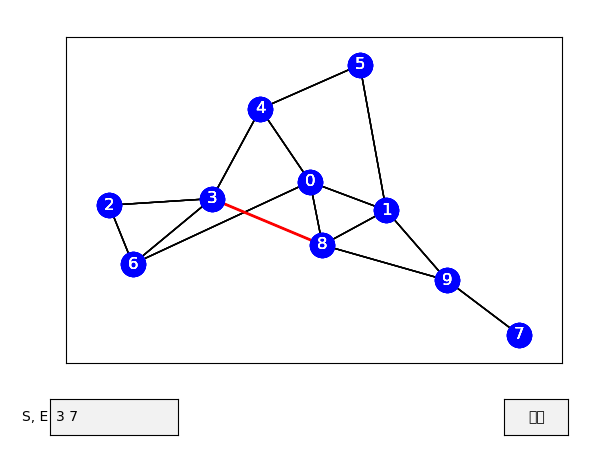
1ステップ目
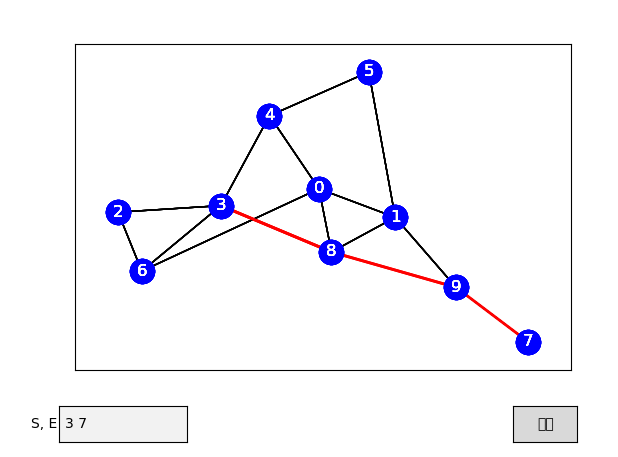
最終状態
5.最後に
PythonってやっぱりCとかに比べて楽すぎてプログラミングしてる感があまりないですね。。
よりPythonのレベルを上げれるよう精進させていただきます。