Chart.js v2.7.xのドキュメントに載ってないことメモ。
印刷すると粗くなってしまう対策
一応ドキュメントに項目(Device Pixel Ratio)は存在するが、Markdownのままで見落としてしまう。
http://www.chartjs.org/docs/latest/general/
optionsにdevicePixelRatio: 4を追加する。まだ粗ければ数値を大きくする。
参考:Added 'devicePixelRatio' option to override the window's DPR setting #4270
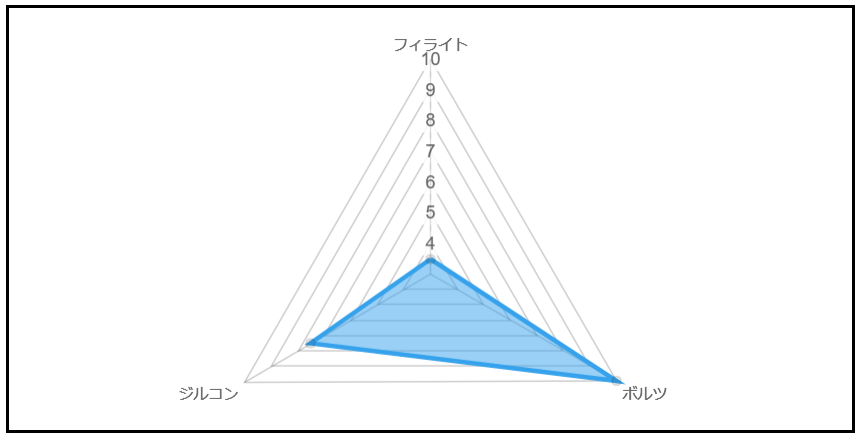
3項目のレーダーチャートの収まりが悪い対策
下に隙間が空いてしまうのをバランス良くする。
参考:https://stackoverflow.com/questions/36730861/chart-js-v2-remove-padding-margin-from-radar-chart
<!DOCTYPE html>
<html>
<head>
  <script src="https://cdnjs.cloudflare.com/ajax/libs/Chart.js/2.7.0/Chart.min.js"></script>
</head>
<body>
<canvas id="radar-chart" style="border: solid"></canvas>
<script>
window.onload = function() {
  new Chart(document.getElementById('radar-chart').getContext('2d'), {
    type: 'radar',
    data: {
      labels: ['フィライト', 'ボルツ', 'ジルコン'],
      datasets: [{
        data: [3.5, 10, 7.5],
        backgroundColor: "rgba(54, 162, 235, 0.5)",
        borderColor: "rgb(54, 162, 235)"
      }]
    },
    options: {
      legend: {display: false},
      scale: {
        beforeFit: function (scale) {
          if (scale.chart.config.data.labels.length === 3) {
            var pointLabelFontSize = Chart.helpers.getValueOrDefault(scale.options.pointLabels.fontSize, Chart.defaults.global.defaultFontSize);
            scale.height *= (2 / 1.7)
            scale.height -= pointLabelFontSize;
          }
        },
        afterFit: function (scale) {
          if (scale.chart.config.data.labels.length === 3) {
            var pointLabelFontSize = Chart.helpers.getValueOrDefault(scale.options.pointLabels.fontSize, Chart.defaults.global.defaultFontSize);
            scale.height += pointLabelFontSize;
            scale.height /= (2 / 1.7);
          }
        },
      },
    },
  });
};
</script>
</body>
</html>
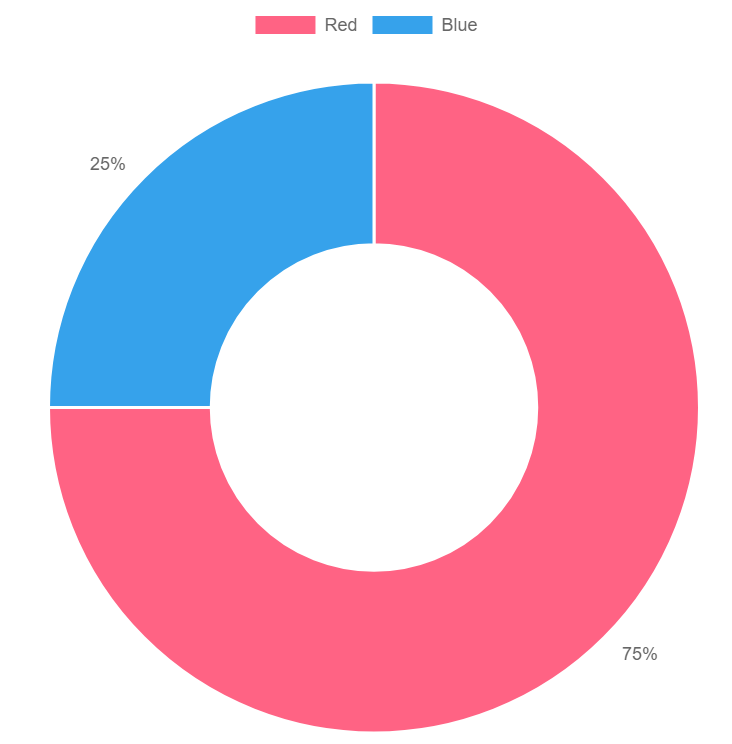
常にツールチップ(というか値の)表示
Pie, Doughnut
プラグインChart.PieceLabel.jsを使う。表示の仕方を選べる。
<!DOCTYPE html>
<html>
<head>
  <script src="https://cdnjs.cloudflare.com/ajax/libs/Chart.js/2.7.0/Chart.min.js"></script>
  <script src="Chart.PieceLabel.min.js"></script>
</head>
<body>
<canvas id="doughnut-chart"></canvas>
<script>
var config = {
  type: 'doughnut',
  data: {
    datasets: [{
      data: [75, 25],
      backgroundColor: [
        'rgb(255, 99, 132)',
        'rgb(54, 162, 235)',
      ]
    }],
    labels: ['Red', 'Blue']
  },
  options: {
    pieceLabel: {position: 'outside'},
  },
};

window.onload = function() {
  var ctx = document.getElementById('doughnut-chart').getContext('2d');
  new Chart(ctx, config);
};
</script>
</body>
</html>
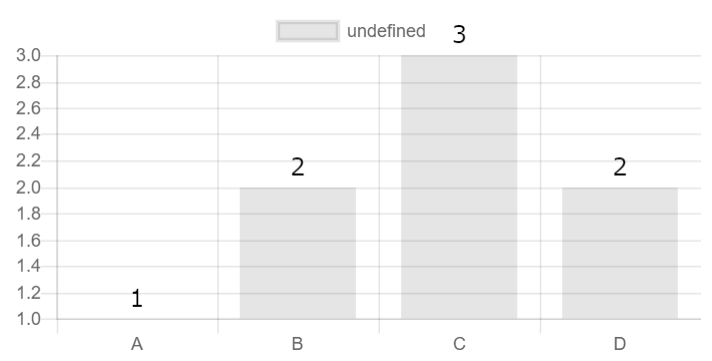
Bar
サンプルのソースを参考
http://www.chartjs.org/samples/latest/advanced/data-labelling.html
<!DOCTYPE html>
<html>
<head>
  <script src="https://cdnjs.cloudflare.com/ajax/libs/Chart.js/2.7.0/Chart.min.js"></script>
</head>
<body>
<canvas id="bar-chart"></canvas>
<script>
//http://www.chartjs.org/samples/latest/advanced/data-labelling.html
Chart.plugins.register({
  afterDatasetsDraw: function(chart, easing) {
    if (chart.config.type != 'bar') return;
    // To only draw at the end of animation, check for easing === 1
    var ctx = chart.ctx;

    chart.data.datasets.forEach(function (dataset, i) {
      var meta = chart.getDatasetMeta(i);
      if (!meta.hidden) {
        meta.data.forEach(function(element, index) {
          // Draw the text in black, with the specified font
          ctx.fillStyle = 'rgb(0, 0, 0)';

          var fontSize = 16;
          var fontStyle = 'normal';
          var fontFamily = 'Helvetica Neue';
          ctx.font = Chart.helpers.fontString(fontSize, fontStyle, fontFamily);

          // Just naively convert to string for now
          var dataString = dataset.data[index].toString();

          // Make sure alignment settings are correct
          ctx.textAlign = 'center';
          ctx.textBaseline = 'middle';

          var padding = 5;
          var position = element.tooltipPosition();
          ctx.fillText(dataString, position.x, position.y - (fontSize / 2) - padding);
        });
      }
    });
  }
});

var data = {
  labels: ['A','B','C','D'],
  datasets: [
    {
      data: ['1','2','3','2'],
    },
  ],
};
var config = {
  type: 'bar',
  data: data,
};

window.onload = function() {
  var ctx = document.getElementById('bar-chart').getContext('2d');
  new Chart(ctx, config);
};
</script>
</body>
</html>
データの切替
毎回new Chartしてはいけない。
<!DOCTYPE html>
<html>
<head>
  <script src="https://cdnjs.cloudflare.com/ajax/libs/Chart.js/2.7.0/Chart.min.js"></script>
</head>
<body>
<input type="button" value="graphA" onclick="graphA()">
<input type="button" value="graphB" onclick="graphB()">
<canvas id="graph1"></canvas>
<script>
function chartdata(data) {
  return {
    labels: ["1月","2月","3月"],
    datasets: [
      {
        label: "件数",
        fillColor: "rgba(220,220,220,0.5)",
        strokeColor: "rgba(220,220,220,0.8)",
        highlightFill: "rgba(220,220,220,0.75)",
        highlightStroke: "rgba(220,220,220,1)",
        data: data
      }
    ]
  };
}

let ctx = document.getElementById('graph1').getContext("2d");
let myChart = new Chart(ctx, {type: 'bar', data: chartdata([])});

function graphA() {
  myChart.data = chartdata([3, 2, 10]);
  myChart.update();
}
function graphB() {
  myChart.data = chartdata([6,4,5]);
  myChart.update();
}
</script>
</body>
</html>