概要
骨格抽出をしたいなと思った時、Tensorflowが公開している事前学習済みのモデルを見つけたので、そちらを利用して骨格推定AIを作成した際の作業メモです。
実装
環境
- macOS Catalina(v10.15.7)
- Python: 3.8
必要ライブラリのインストール
必要ライブラリをインストールするために、下記のコマンドを実行する。
pip install matplotlib opencv-python tensorflow tensorflow-hub
モデルの選択
モデルはMobileNetV2ベースのものを用いる。それ以外のモデルを利用する場合は、下記のTensorflowHubのページから利用したいモデルを探す。
開発
入力した画像に対してAIによる処理を実行し、骨格を抽出するプログラムを下記に示す
main.py
import numpy as np
import tensorflow as tf
import tensorflow_hub as hub


class PoseEstimator:
    """入力画像から骨格のキーポイントを返す。"""

    def __init__(self) -> None:
        # Download the model from TF Hub.
        model = hub.load("https://tfhub.dev/google/movenet/singlepose/lightning/4")
        self.movenet = model.signatures["serving_default"]

    def predict(self, target_image: np.ndarray) -> np.ndarray:
        """RGB画像の入力から、その画像に映る1人の骨格のキーポイントを返す。

        Args:
            target_image (np.ndarray): 処理対象の画像

        Returns:
            np.ndarray: 検出されたキーポイント
        """
        # 推論できるように画像の整形
        image = tf.expand_dims(target_image, axis=0)
        image = tf.cast(tf.image.resize_with_pad(image, 192, 192), dtype=tf.int32)
        # Run model inference.
        outputs = self.movenet(image)
        # Output is a [1, 1, 17, 3] tensor.
        keypoints = outputs["output_0"]

        del outputs, image, target_image
        return keypoints.numpy()

    def draw_prediction_on_image(self, target_image: np.ndarray, keypoints: np.ndarray):

        from util import draw_prediction_on_image

        return draw_prediction_on_image(target_image, keypoints)


if __name__ == "__main__":
    import argparse

    import cv2

    # 引数の設定
    parser = argparse.ArgumentParser()

    parser.add_argument("image_path", help="実験対象の画像へのパス")

    args = parser.parse_args()

    img = cv2.imread(args.image_path)

    # モデルの初期化
    pe = PoseEstimator()
    # 画像のキーポイントを取得
    keypoints = pe.predict(img)
    print(keypoints)

    # 実行結果を保存
    drwaed_img = pe.draw_prediction_on_image(img, keypoints=keypoints)
    cv2.imwrite(f"{args.image_path.split('.')[0]}_results.png", drwaed_img)

    # 出力
    h, w, _ = drwaed_img.shape
    concat_img = cv2.hconcat([cv2.resize(img, (w, h)), drwaed_img])
    cv2.imshow("smaple", concat_img)

    # キーが押されるまで待ち続ける。
    cv2.waitKey(0)
    cv2.destroyAllWindows()
他のモデルを利用したい場合は、下記のhub.load()で読み込むモデルのURLを変更することで、簡単に他のモデルに切り替えることができる。
main.py
model = hub.load("https://tfhub.dev/google/movenet/singlepose/lightning/4")
利用するモデルは、画像に含まれる人物の骨格の座標を返すのみなので、座標を元の画像に描画する処理は自前で作成する必要がある。Tensorflowの公式のサンプルに、元画像に骨格の描画処理が記載されているので、今回はそれをそのまま利用する。
予測されたキーポイントを、入力画像に描画する処理をutil.pyとして作成する。
util.pyの全体像
util.py
# https://github.com/tensorflow/hub/blob/master/examples/colab/movenet.ipynb
# Import TF and TF Hub libraries.
import cv2
import matplotlib.patches as patches
import numpy as np
from matplotlib import pyplot as plt
from matplotlib.collections import LineCollection

# Dictionary that maps from joint names to keypoint indices.
KEYPOINT_DICT = {
    "nose": 0,
    "left_eye": 1,
    "right_eye": 2,
    "left_ear": 3,
    "right_ear": 4,
    "left_shoulder": 5,
    "right_shoulder": 6,
    "left_elbow": 7,
    "right_elbow": 8,
    "left_wrist": 9,
    "right_wrist": 10,
    "left_hip": 11,
    "right_hip": 12,
    "left_knee": 13,
    "right_knee": 14,
    "left_ankle": 15,
    "right_ankle": 16,
}

# Maps bones to a matplotlib color name.
KEYPOINT_EDGE_INDS_TO_COLOR = {
    (0, 1): "m",
    (0, 2): "c",
    (1, 3): "m",
    (2, 4): "c",
    (0, 5): "m",
    (0, 6): "c",
    (5, 7): "m",
    (7, 9): "m",
    (6, 8): "c",
    (8, 10): "c",
    (5, 6): "y",
    (5, 11): "m",
    (6, 12): "c",
    (11, 12): "y",
    (11, 13): "m",
    (13, 15): "m",
    (12, 14): "c",
    (14, 16): "c",
}


def _keypoints_and_edges_for_display(
    keypoints_with_scores, height, width, keypoint_threshold=0.11
):
    """Returns high confidence keypoints and edges for visualization.
    Args:
      keypoints_with_scores: A numpy array with shape [1, 1, 17, 3] representing
        the keypoint coordinates and scores returned from the MoveNet model.
      height: height of the image in pixels.
      width: width of the image in pixels.
      keypoint_threshold: minimum confidence score for a keypoint to be
        visualized.
    Returns:
      A (keypoints_xy, edges_xy, edge_colors) containing:
        * the coordinates of all keypoints of all detected entities;
        * the coordinates of all skeleton edges of all detected entities;
        * the colors in which the edges should be plotted.
    """
    keypoints_all = []
    keypoint_edges_all = []
    edge_colors = []
    num_instances, _, _, _ = keypoints_with_scores.shape
    for idx in range(num_instances):
        kpts_x = keypoints_with_scores[0, idx, :, 1]
        kpts_y = keypoints_with_scores[0, idx, :, 0]
        kpts_scores = keypoints_with_scores[0, idx, :, 2]
        kpts_absolute_xy = np.stack(
            [width * np.array(kpts_x), height * np.array(kpts_y)], axis=-1
        )
        kpts_above_thresh_absolute = kpts_absolute_xy[
            kpts_scores > keypoint_threshold, :
        ]
        keypoints_all.append(kpts_above_thresh_absolute)

        for edge_pair, color in KEYPOINT_EDGE_INDS_TO_COLOR.items():
            if (
                kpts_scores[edge_pair[0]] > keypoint_threshold
                and kpts_scores[edge_pair[1]] > keypoint_threshold
            ):
                x_start = kpts_absolute_xy[edge_pair[0], 0]
                y_start = kpts_absolute_xy[edge_pair[0], 1]
                x_end = kpts_absolute_xy[edge_pair[1], 0]
                y_end = kpts_absolute_xy[edge_pair[1], 1]
                line_seg = np.array([[x_start, y_start], [x_end, y_end]])
                keypoint_edges_all.append(line_seg)
                edge_colors.append(color)
    if keypoints_all:
        keypoints_xy = np.concatenate(keypoints_all, axis=0)
    else:
        keypoints_xy = np.zeros((0, 17, 2))

    if keypoint_edges_all:
        edges_xy = np.stack(keypoint_edges_all, axis=0)
    else:
        edges_xy = np.zeros((0, 2, 2))
    return keypoints_xy, edges_xy, edge_colors


def draw_prediction_on_image(
    image,
    keypoints_with_scores,
    crop_region=None,
    close_figure=False,
    output_image_height=None,
):
    """Draws the keypoint predictions on image.
    Args:
      image: A numpy array with shape [height, width, channel] representing the
        pixel values of the input image.
      keypoints_with_scores: A numpy array with shape [1, 1, 17, 3] representing
        the keypoint coordinates and scores returned from the MoveNet model.
      crop_region: A dictionary that defines the coordinates of the bounding box
        of the crop region in normalized coordinates (see the init_crop_region
        function below for more detail). If provided, this function will also
        draw the bounding box on the image.
      output_image_height: An integer indicating the height of the output image.
        Note that the image aspect ratio will be the same as the input image.
    Returns:
      A numpy array with shape [out_height, out_width, channel] representing the
      image overlaid with keypoint predictions.
    """
    height, width, channel = image.shape
    aspect_ratio = float(width) / height
    fig, ax = plt.subplots(figsize=(12 * aspect_ratio, 12))
    # To remove the huge white borders
    fig.tight_layout(pad=0)
    ax.margins(0)
    ax.set_yticklabels([])
    ax.set_xticklabels([])
    plt.axis("off")

    im = ax.imshow(image)
    line_segments = LineCollection([], linewidths=(4), linestyle="solid")
    ax.add_collection(line_segments)
    # Turn off tick labels
    scat = ax.scatter([], [], s=60, color="#FF1493", zorder=3)

    (keypoint_locs, keypoint_edges, edge_colors) = _keypoints_and_edges_for_display(
        keypoints_with_scores, height, width
    )

    line_segments.set_segments(keypoint_edges)
    line_segments.set_color(edge_colors)
    if keypoint_edges.shape[0]:
        line_segments.set_segments(keypoint_edges)
        line_segments.set_color(edge_colors)
    if keypoint_locs.shape[0]:
        scat.set_offsets(keypoint_locs)

    if crop_region is not None:
        xmin = max(crop_region["x_min"] * width, 0.0)
        ymin = max(crop_region["y_min"] * height, 0.0)
        rec_width = min(crop_region["x_max"], 0.99) * width - xmin
        rec_height = min(crop_region["y_max"], 0.99) * height - ymin
        rect = patches.Rectangle(
            (xmin, ymin),
            rec_width,
            rec_height,
            linewidth=1,
            edgecolor="b",
            facecolor="none",
        )
        ax.add_patch(rect)

    fig.canvas.draw()
    image_from_plot = np.frombuffer(fig.canvas.tostring_rgb(), dtype=np.uint8)
    image_from_plot = image_from_plot.reshape(
        fig.canvas.get_width_height()[::-1] + (3,)
    )
    plt.close(fig)
    if output_image_height is not None:
        output_image_width = int(output_image_height / height * width)
        image_from_plot = cv2.resize(
            image_from_plot,
            dsize=(output_image_width, output_image_height),
            interpolation=cv2.INTER_CUBIC,
        )
    return image_from_plot
実行
実行する場合は、引数に画像のパスを指定して下記のコマンドを実行する。
$ python main.py sample/sample_1.jpg
[[[[0.13743249 0.509241   0.67622167] # 鼻
   [0.12190758 0.52718556 0.6613471 ] # 左目
   [0.12153202 0.49221942 0.62564003] # 右目
   [0.13553336 0.5490756  0.67242754] # 左耳
   [0.13495947 0.4691895  0.755946  ] # 右耳
   [0.23906666 0.60141593 0.7639849 ] # 左肩
   [0.23728989 0.4271693  0.80395174] # 右肩
   [0.37938306 0.6392927  0.74136597] # 左肘
   [0.36010218 0.38605294 0.7875248 ] # 右肘
   [0.47282204 0.56788296 0.66048586] # 左手首
   [0.4542732  0.42760295 0.54725796] # 右手首
   [0.49338314 0.5560917  0.7308052 ] # 左尻
   [0.47667205 0.447928   0.6906055 ] # 右尻
   [0.7080015  0.54386944 0.7572984 ] # 左膝
   [0.5948106  0.3165937  0.8118323 ] # 右膝
   [0.8745679  0.51792836 0.5204293 ] # 左足首
   [0.6435391  0.4699328  0.70983475]]]] # 右足首
学習済みモデルから返された各関節のキーポイントの座標と、その信頼スコアが出力されている。関節ごとに[0-1]の範囲に正規化された値が、[y座標, x座標, 信頼スコア]の順に格納されている。各座標がどの部位にあたるのかコメントを記載した。
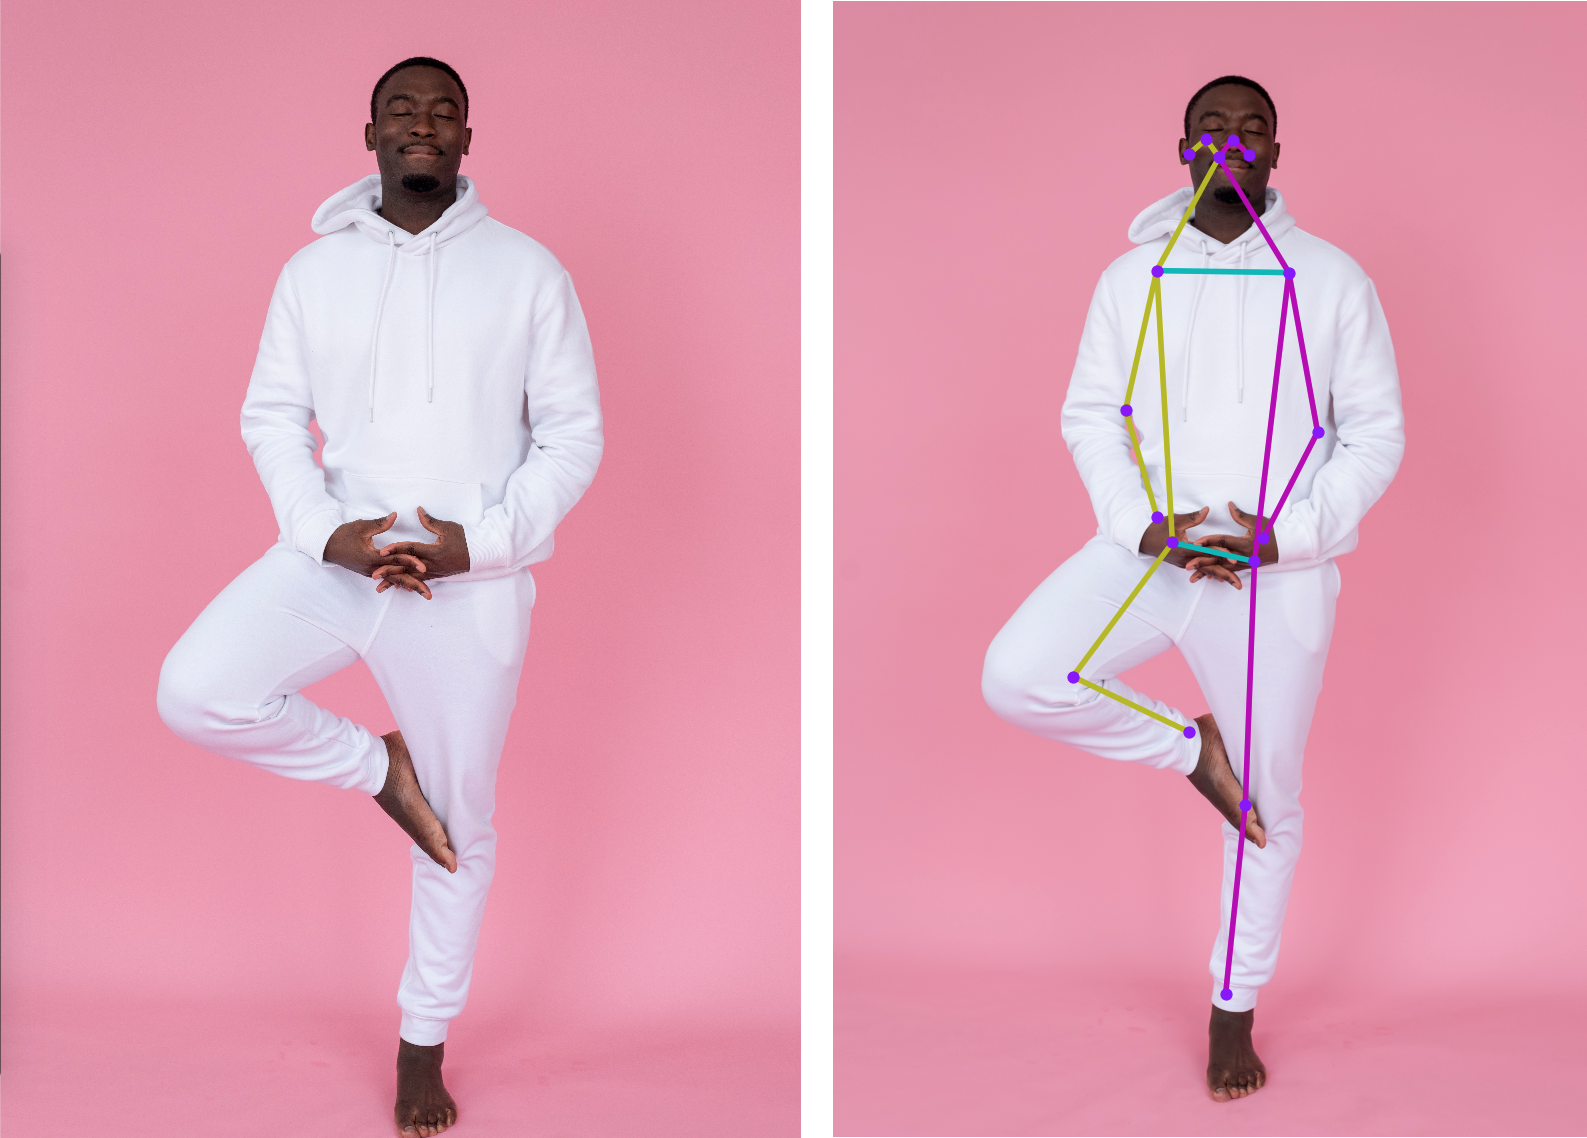
元画像と検出された骨格の座標をプロットした画像を以下に示す。完全に一致、というほどでもないが、概ね問題なく骨格を検出できていることが確認できる。