Pythonで作成したDataframeをパワポに載せる際に、
一度EXCELに出力してからテーブル画像を作成するのは手間です。
綺麗なテーブルをPythonから出力するための情報が少ないなと知ったため作成しました。
matplotlibでもできなくはないですが、plotlyのほうが便利です。
1. plotlyのインストール
https://qiita.com/ogrew/items/e6ba517cec9fb5161cb6
に詳しく記述されています。
2. テーブルの作成
plotly.rb
import pandas as pd
import plotly.graph_objects as go
import numpy as np

# データの作成
x1 = np.arange(0,10, 1)
y2 = np.arange(0,20, 2)
z3 = np.arange(0,30, 3)
P_X = ["<b>{}</b>".format(i) for i in range(10)]

# Dataframeの作成
df = pd.DataFrame({"X1":x1, "Y2":y2, "Z3":z3, "P<sub>X</sub>":P_X})

# テーブルの作成
fig = go.Figure(data=[go.Table(
        columnwidth =  [10, 20, 30, 40], #カラム幅の変更
        header=dict(values=df.columns, align='center', font_size=20),
        cells=dict(values=df.values.T, align='center', font_size=10)
        )])
fig.update_layout(title={'text': "sample_table",'y':0.85,'x':0.5,'xanchor': 'center'})#タイトル位置の調整
fig.layout.title.font.size= 24 #タイトルフォントサイズの変更
fig.write_image("sample_table.jpg")#,height=600, width=800)
# fig.write_image("sample_table.jpg",height=600, width=800) #デーブルのサイズ変更
# fig.show()
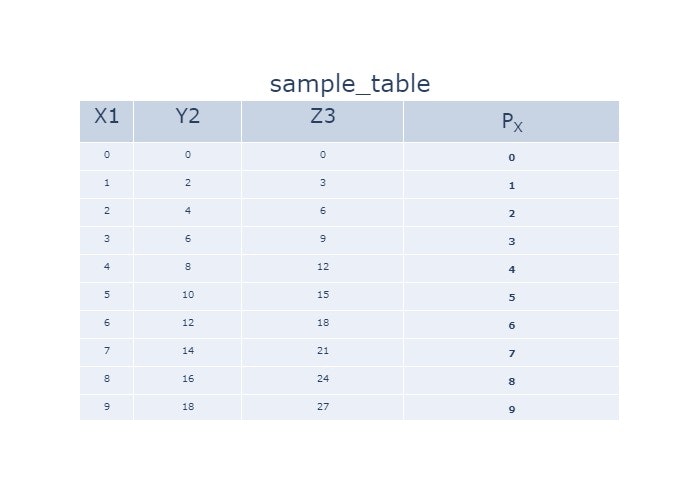
出力結果
3.Plotlyについて
plotlyはhtmlのタグを使用できるので、データにhtmlタグを入れることで任意の形式のテーブルを作成することができます。
詳しくはplotly公式サイトに記述されています。
https://plot.ly/python/table/