はじめに
この記事はjupyter notebook Advent Calender 2016の12/18分の投稿です。
なお、著者はJpyter notebook初心者です。悪しからず。
今回紹介するのはplotlyをjupyter notebook上で利用するための簡単な手順についてです。
plotlyはデータ可視化プラットホームです。さまざまなグラフをオンラインで編集したり、共有したりすることが可能です。Matplotlibよりお洒落なグラフが書けます。
オンラインと言いましたが、もちろん、ローカルで使用することも可能です。(昔はできなかったらしい!)
基本的にはどの機能も無料で利用できます。
ちなみにカナダのモントリオールに開発している企業があるそうです。
RythonやRをはじめMatlab,JavaScript,Ruby,Go...などの言語、ArduinoやRasberryPiといったハードウェアと連携した利用も可能です。
3Dプロットなどの一部の機能は過去、有料だったようですが昨年末ごろオープンソース化されたことをきっかけにこれらも無料となりました。やったね。
素人ながらすごい便利だと感じたものの、日本では(?)あまり流行っていないようです。
とここまで書いておいてなんですが、似たようなサービスであるBokehについて、すでにおとといのAdvent Calenderでdrillerさんがしっかりとまとめられていました。
ipywidgetsとBokeh使ってインタラクティブな可視化をする
余談ですが、Anacondaで有名なContinuum Analysis社が主にBokehを開発している、一方で最近話題のExploratoryというRをベースとしたソフトウェアの影響もあって、
- Bokeh -> Python
- Plotly -> R
の構図ができありつつあるようです。(違ったらすいません。)
まずは準備
①ターミナルまたはコマンドプロントで
$ pip install plotly
あるいはanacondaを導入している場合は
$ conda install plotly
を実行して、PlotlyのPythonパッケージをインストールします。
すでにインストールされている場合は適宜アップグレードします。
②plotlyのサイトからログインします。
アカウントを持っていない場合はサインアップします。
2016年12月時点ではfacebook,Google+,Twitter,GitHubでのサインアップが可能です。
③無事サインアップ後、accounts@plot.lyから確認のメールが来るので確認します。
④ユーザーページのSettingから自身のAPIキーを確認します。
⑤必要であればcredentials file(認証用ファイル)を設定します。
Jupyter notebook上で
plotly.tools.set_credentials_file(username="xxxxxxx", api_key="yyyyyyy"
を実行します。
(これをせずにPlotlyを実行するたびに
py = plotly.plotly(username='<your-username>', key='<your-api-key>')
のように記述しても構いません。)
これで準備は終了です。
とりあえず使ってみる
import plotly
plotly.__version__
>>> 1.12.9
import plotly.plotly as py
import plotly.graph_objs as go
from plotly.tools import FigureFactory as FF

import pandas as pd
import numpy as np
import string
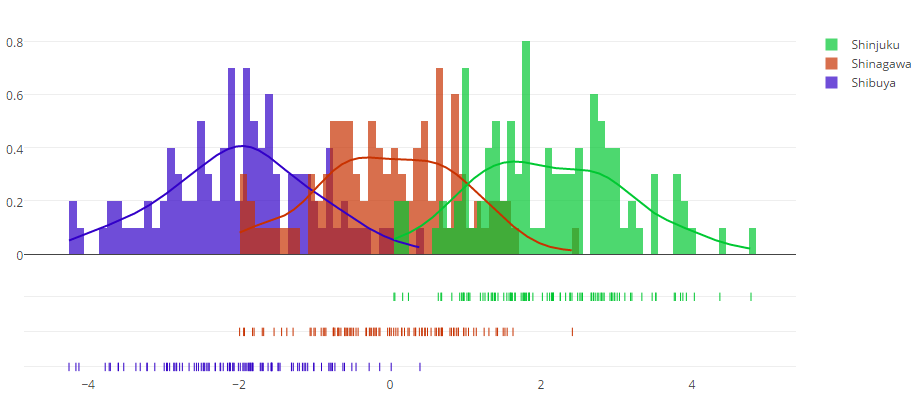
x1 = np.random.randn(100)-2
x2 = np.random.randn(100)
x3 = np.random.randn(100)+2
hist_data = [x1, x2, x3]

group_labels = ['Shibuya', 'Shinagawa', 'Shinjuku']
colors = ['rgb(50, 0, 200)', 'rgb(200, 50, 0)','rgb(0, 200, 50)']

fig = FF.create_distplot(hist_data, group_labels,colors=colors, bin_size=.1)

py.iplot(fig, filename='Compare with 3 city', validate=False)
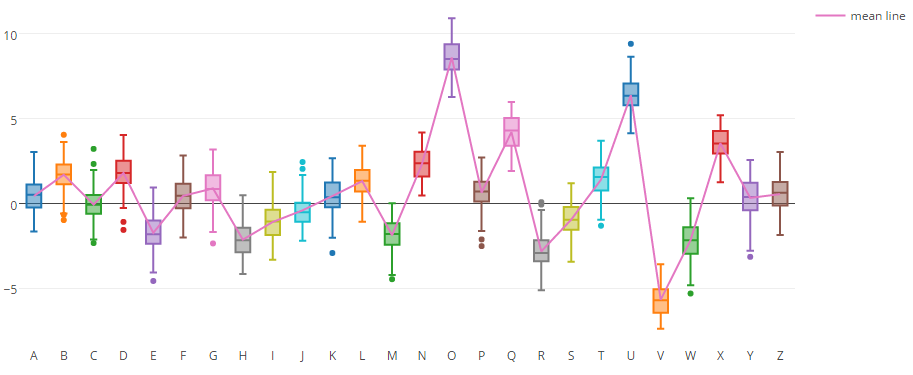
N = 100
y_vals = {}
for letter in list(string.ascii_uppercase):
     y_vals[letter] = np.random.randn(N)+(3*np.random.randn())

df = pd.DataFrame(y_vals)

data = []

for col in df.columns:
    data.append(  go.Box( y=df[col], name=col, showlegend=False ) )

data.append( go.Scatter( x = df.columns, y = df.mean(), mode='lines', name='mean line' ) )

py.iplot(data, filename='pandas-box-plot', validate=False)
公式のチートシートがあるので簡単な文法はここで確認できます。
まとめ
いかがだったでしょうか。今回はすごい単純なグラフしかお見せできませんでしたが、公式サイトをざっと見ただけでも様々なインタラクティブな作図が可能なのことがわかると思います。
気になる方は、ぜひお試しください。

