目的
pythonで画像の輝度値のヒストグラムを表示した際の備忘録です
コード
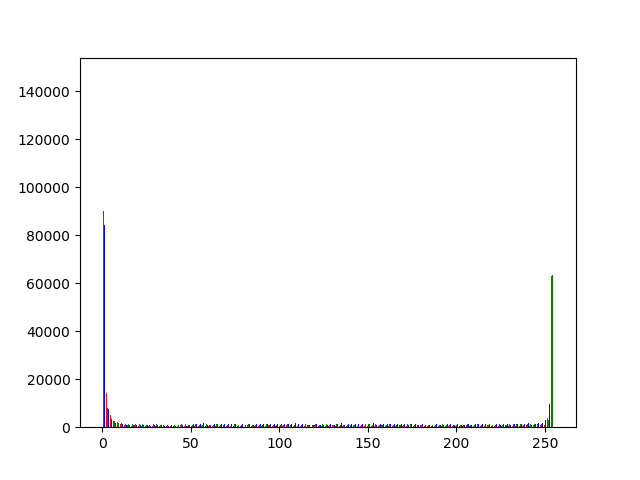
カラー画像のヒストグラム表示する
histgram.py
from PIL import Image
import matplotlib.pyplot as plt
import numpy as np

def color_hist(filename):
    img = np.asarray(Image.open(filename).convert("RGB")).reshape(-1,3)
    plt.hist(img, color=["red", "green", "blue"], bins=128)
    plt.show()

color_hist("./test.jpg")
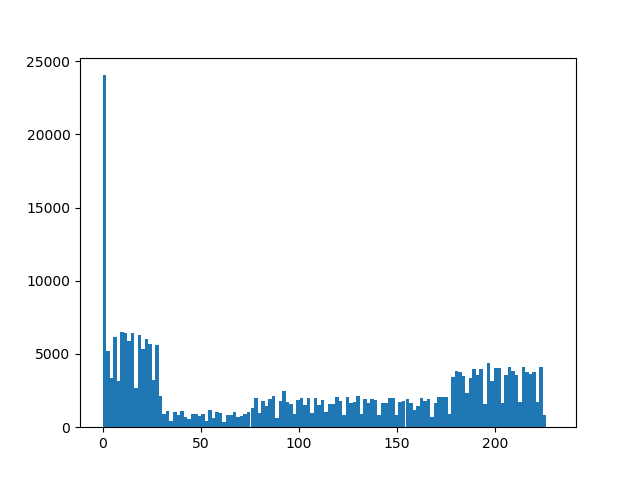
カラー画像をグレイスケールで読み込んでヒストグラム表示する
histgram.py
from PIL import Image
import matplotlib.pyplot as plt
import numpy as np

def color_hist(filename):
    img = np.asarray(Image.open(filename).convert("L")).reshape(-1,1)
    plt.hist(img, bins=128)
    plt.show()

color_hist("./test.jpg")
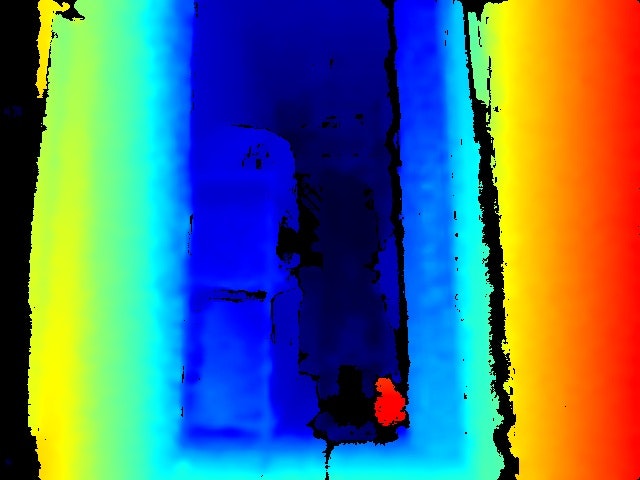
元画像
追記
画像を切り出す場合
from PIL import Image
import matplotlib.pyplot as plt
import numpy as np
import cv2

def color_hist(filename):
    img = np.asarray(Image.open(filename).convert("L")).reshape(-1,1)
    plt.hist(img, bins=256)
    plt.show()

def cut_image(filename):
    im = cv2.imread(filename,0)
    dst = im[0:400,250:410] #y,x
    cv2.imwrite('./tmp.jpg',dst)

cut_image("./test.jpg")
color_hist("./tmp.jpg")
CodingError対策
特になし
参考
Pythonで画像のピクセル操作
Python でグレースケール(grayscale)化
Pythonで画像のカラーヒストグラムを簡単に表示する方法