概要
PythonのBokehで趣味のマラソンのデータを可視化してみます。
Bokehとは
WebブラウザをターゲットにしたインタラクティブなPythonの可視化ライブラリ。
https://bokeh.pydata.org/en/latest/
特徴
・結果として画像ではなく、HTMLファイルを生成
・インタラクティブな操作が可能
グラフをドラッグして拡大縮小、要素や範囲を選択
ボタンやスライダーなどの表示
・Python以外にも、ScalaやR、Julia等からも利用可能
・Jupyter Notebookでの表示にも対応している
可視化するデータ
私は2014年からマラソンを始め、毎年1回はフルマラソンに出場しています。
昨年、長年の目標だったサブ3.5(3時間半以内にゴールする)を達成しました。
2016年からRuntasticというランニング記録アプリを使っていて、2016年以降のマラソンのデータは保存されています。このデータをBokehを使って可視化してみます。
(公式のタイムとは少し誤差があります)
・Runtastic
https://www.runtastic.com/ja
| 日付 | タイム |
|---|---|
| 2016/10/30 | 3時間52分14秒 |
| 2017/10/29 | 3時間56分18秒 |
| 2018/10/28 | 3時間59分00秒 |
| 2018/11/25 | 3時間28分09秒 |
マラソンデータの可視化
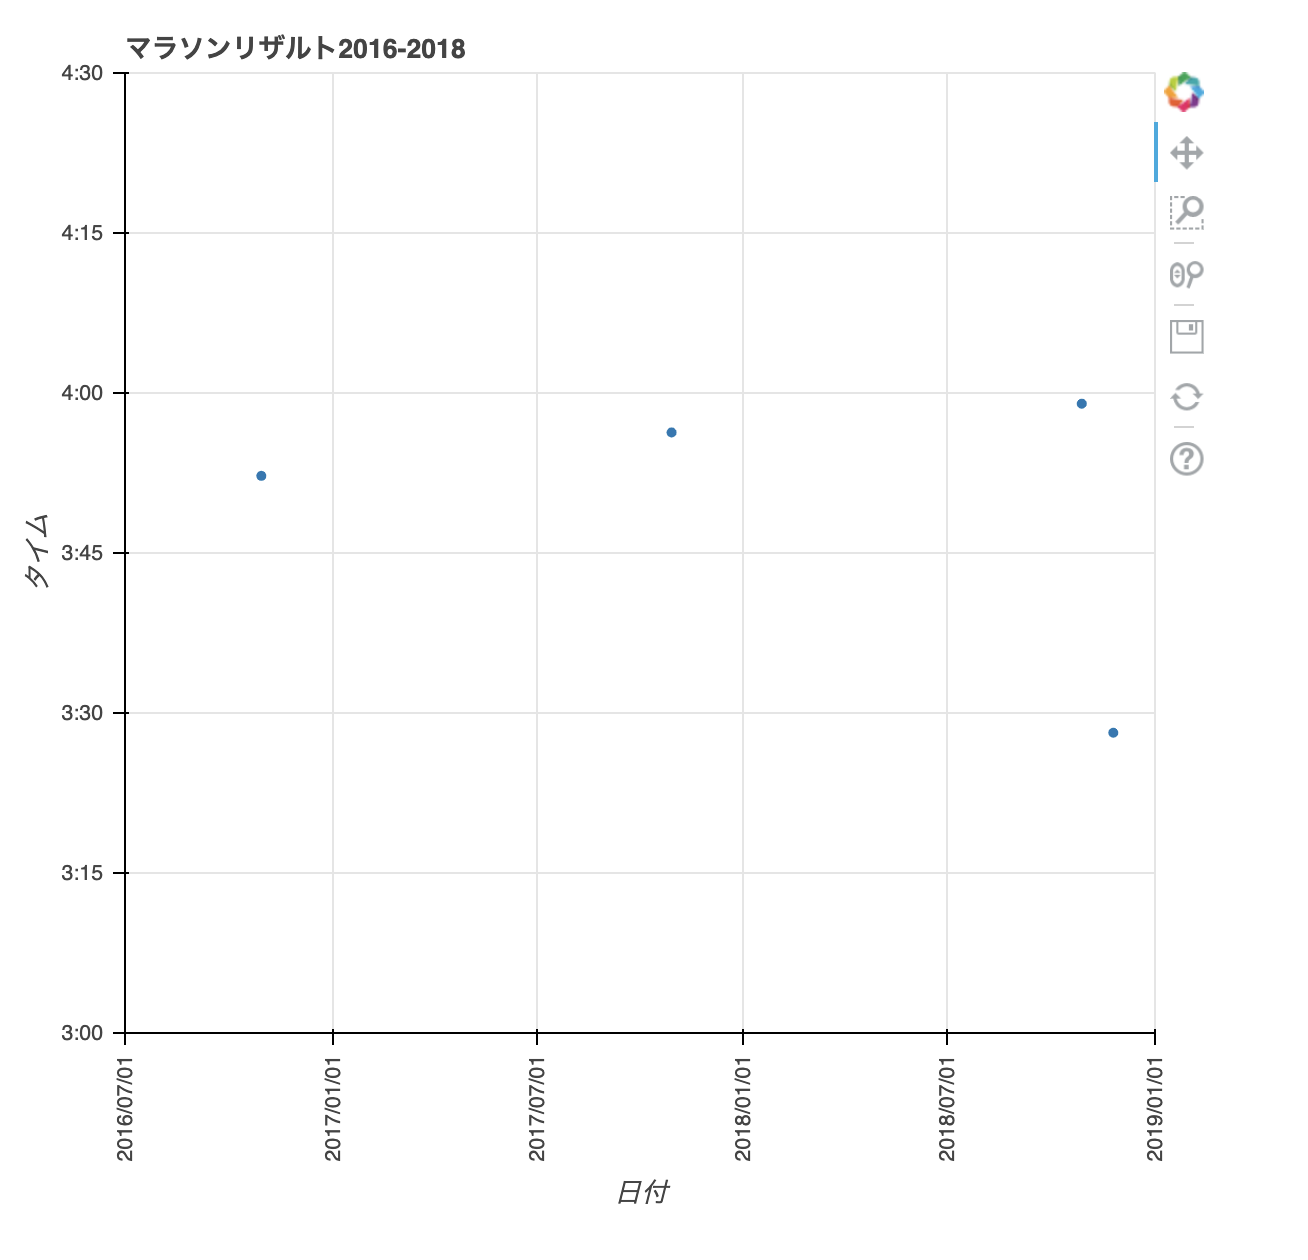
まずはプロットしてみます。
from bokeh.io import show
from bokeh.plotting import figure
from bokeh.models import DatetimeTickFormatter
from datetime import datetime as dt
import math

xlist=['2016-10-30', '2017-10-29', '2018-10-28', '2018-11-25']
ylist=['03:52:14', '03:56:18', '03:59:00', '03:28:09']

# xlist,ylistを datetime型に変換
xlist = [dt.strptime(d, '%Y-%m-%d') for d in xlist]
ylist = [dt.strptime(d, '%H:%M:%S') for d in ylist]

# データをプロット
p = figure(
            title="マラソンリザルト2016-2018",
            x_axis_type='datetime',
            y_axis_type='datetime',
            x_range=(dt.strptime('2016-07-01','%Y-%m-%d'),
                   dt.strptime('2019-01-01', '%Y-%m-%d')),
            y_range=(dt.strptime('03:00:00','%H:%M:%S'),
                    dt.strptime('04:30:00','%H:%M:%S')),
            x_axis_label='日付',
            y_axis_label='タイム'
            )

p.circle(xlist, ylist)

# X軸の設定
x_format = "%Y/%m/%d"
p.xaxis.formatter = DatetimeTickFormatter(
    days=[x_format],
    months=[x_format],
    years=[x_format]
)
p.xaxis.major_label_orientation = math.radians(90)

# Y軸の設定
y_format = "%H:%M:%S"
p.yaxis.formatter = DatetimeTickFormatter(
    seconds=[y_format],
    minutes=[y_format],
    hours=[y_format]
    )
show(p)
上記コードのp.circle(xlist, ylist)の部分をp.line(xlist, ylist, legend="Temp.", line_width=2)に変更すると、以下のようなグラフが描けます。
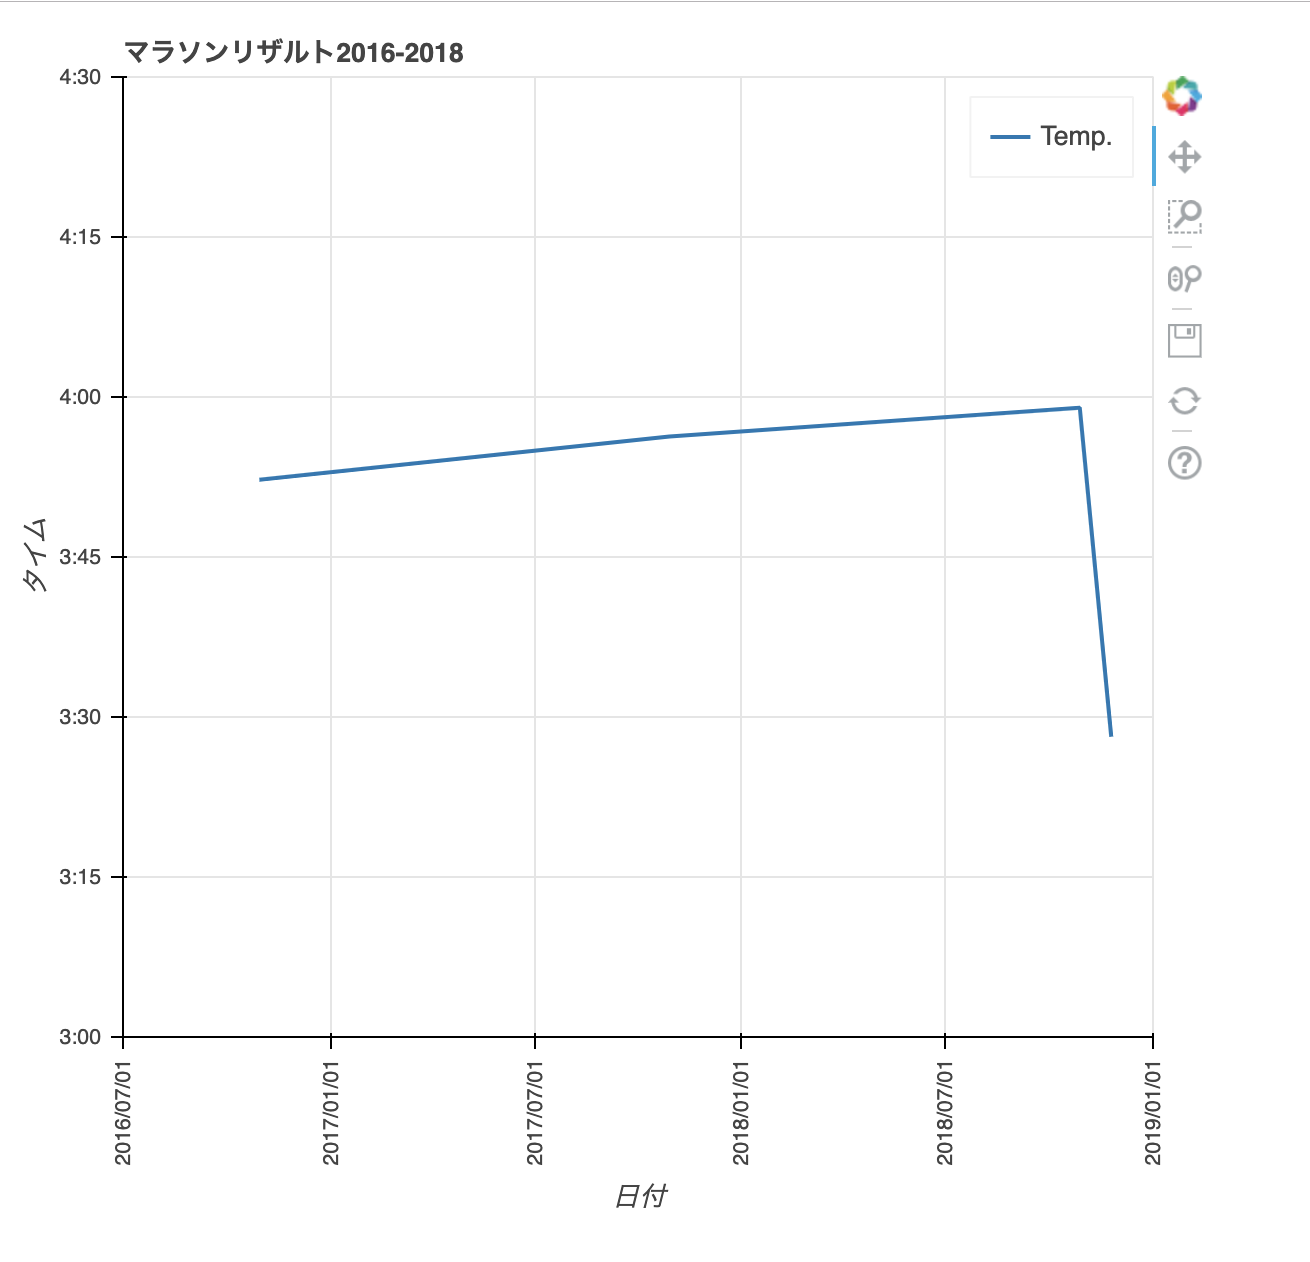
少しずつ遅くなっていたタイムが急に早くなったことがわかりやすく表示されました。
2018年は10月に横浜マラソン、11月につくばマラソンに参加しました。
横浜マラソンは練習として参加し、つくばマラソンで本気を出してサブ3.5を達成しました。
つくばマラソンのペースを可視化
つくばマラソンの1キロ毎のタイムが残っていたので、可視化してみます。
from bokeh.io import show
from bokeh.plotting import figure
from bokeh.models import DatetimeTickFormatter
from datetime import datetime as dt
import math
xlist = []
for i in range(1, 44):
    xlist.append(i)

ylist=['4:49', '5:02', '4:59', '4:44', '4:58', '4:55', '4:59', '4:50', '4:53', '4:49',
       '4:51', '4:49', '4:49', '4:44', '4:59', '4:48', '4:44', '4:52', '4:47', '4:48',
       '4:48', '4:45', '4:43', '4:50', '4:42', '4:43', '4:48', '4:44', '5:10', '4:43',
       '4:38', '5:01', '5:12', '4:50', '4:56', '4:54', '4:57', '5:00', '4:42', '4:44',
       '4:50', '4:56', '5:00']

# xlist,ylistを datetime型に変換
xlist = [d for d in xlist]
ylist = [dt.strptime(d, '%M:%S') for d in ylist]

# データをプロット
p = figure(
            title="つくばマラソンリザルト 2018/11/25",
            y_axis_type='datetime',
            y_range=(dt.strptime('4:00','%M:%S'),
                    dt.strptime('6:00','%M:%S')),
            x_axis_label='距離(km)',
            y_axis_label='タイム(分)'
            )
p.line(xlist, ylist, legend="ペース", line_width=2)
p.xaxis.major_label_orientation = math.radians(90)
# Y軸の設定
y_format = "%M:%S"
p.yaxis.formatter = DatetimeTickFormatter(
    seconds=[y_format],
    minutes=[y_format]
    )
show(p)
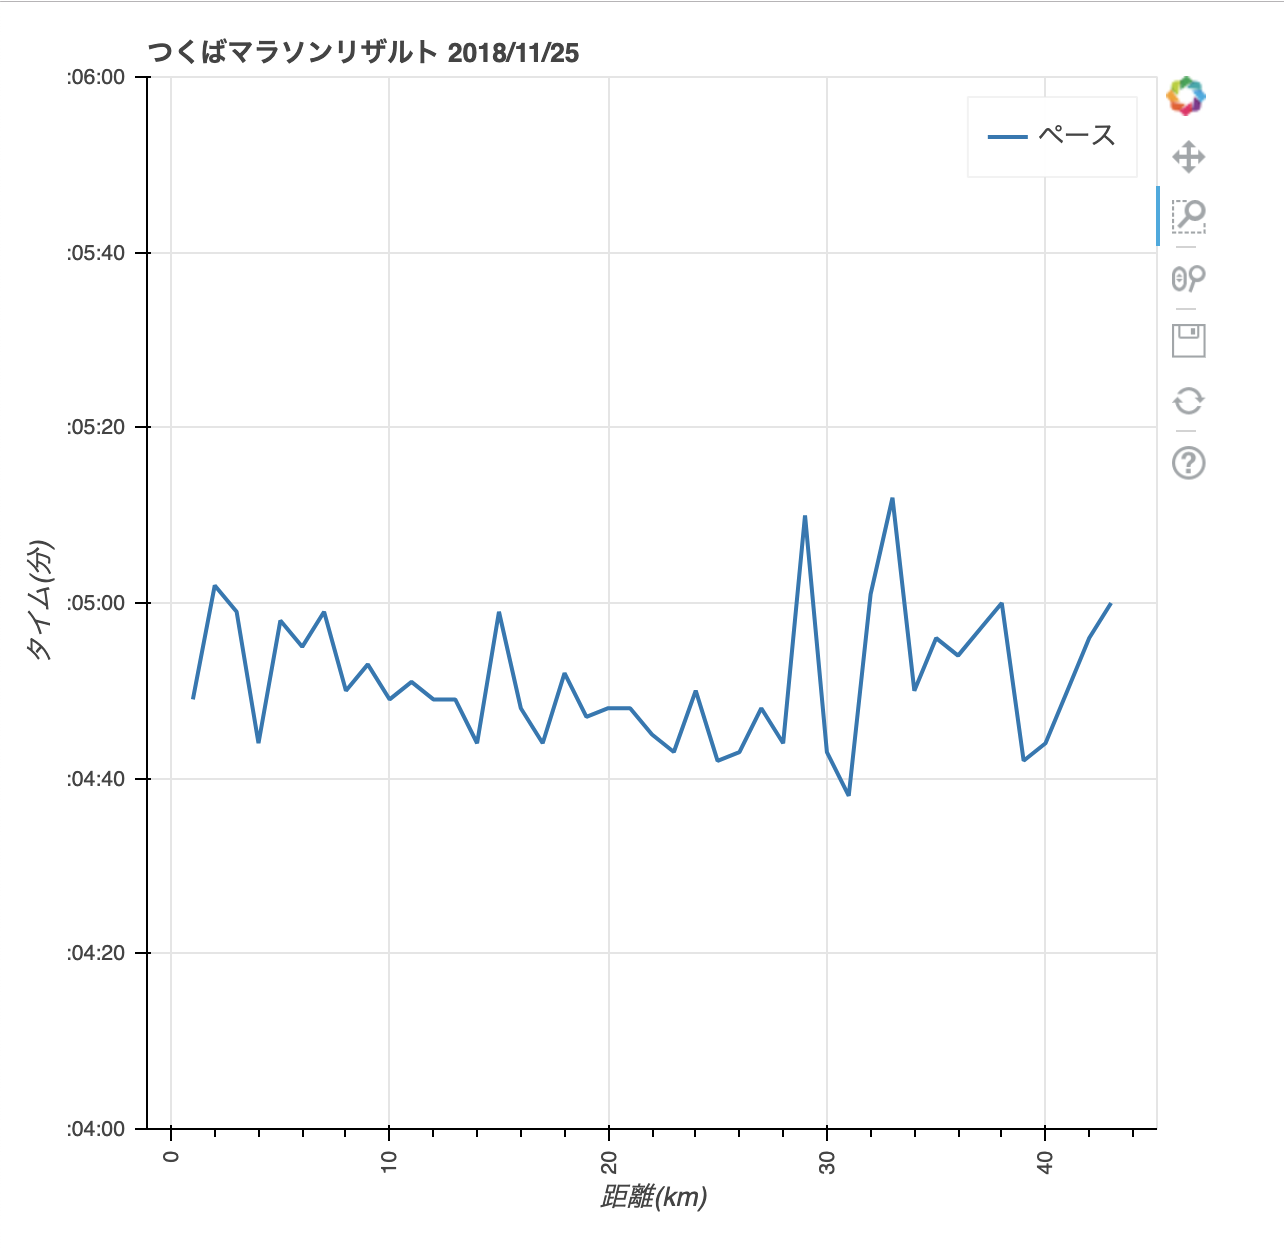
そこそこ一定のペースで走れていますが、後半で少しばらつきました。
やっぱり30キロを越えてくると疲れが出てしまいますね。。
遅くなった分を取り戻そうとしてペースが上がり、その後また下がってしまっています。
出力されたグラフは以下のようにインタラクティブに操作できます。

おわりに
PythonのBokehで可視化を試してみました。
手軽にいい感じのグラフができて、ドラッグしたり拡大縮小したり直感的に操作できました。
マラソンについてですが、長年の目標だったサブ3.5を達成してから燃え尽きてしまい、最近はあまり走っていません。
今年も秋はフルマラソンに参加するので、暑い時期が過ぎたら走ろうかなと。
毎年マラソンの時期はスノーボードしたくてうずうずしています![]()
参考文献
・インストール
https://bokeh.pydata.org/en/latest/docs/installation.html
・クイックスタートガイド
https://bokeh.pydata.org/en/latest/docs/user_guide/quickstart.html
・Bokehについての記事
https://qiita.com/yuji38kwmt/items/4edf1d87568a860fc3b8#bokeh