はじめに
この記事は朝日新聞社 Advent Calendar 2023の15日目の記事です。
題名の通り、みんなが(知っているのかどうかを筆者が)知らないPythonプロファイラ Scalene について紹介します。
プロファイラとは
プロファイラはコードのパフォーマンスの計測・分析のためのツールで、パフォーマンス改善やバグの発見などに役立ちます。関数レベルで計測できるもの、行レベルで計測できるものなど様々ありますが、筆者がよく使っていたのは下記のツールでした。
line_profiler
行レベルで実行時間や実行回数を計測できるツールです。
memory_profiler
こちらはメモリ使用量の計測のためのツールです。line_profiler同様、行レベルで計測できます。
上記については下記などが参考になります。
Scaleneでできること
それでは本題のScaleneについて紹介します。
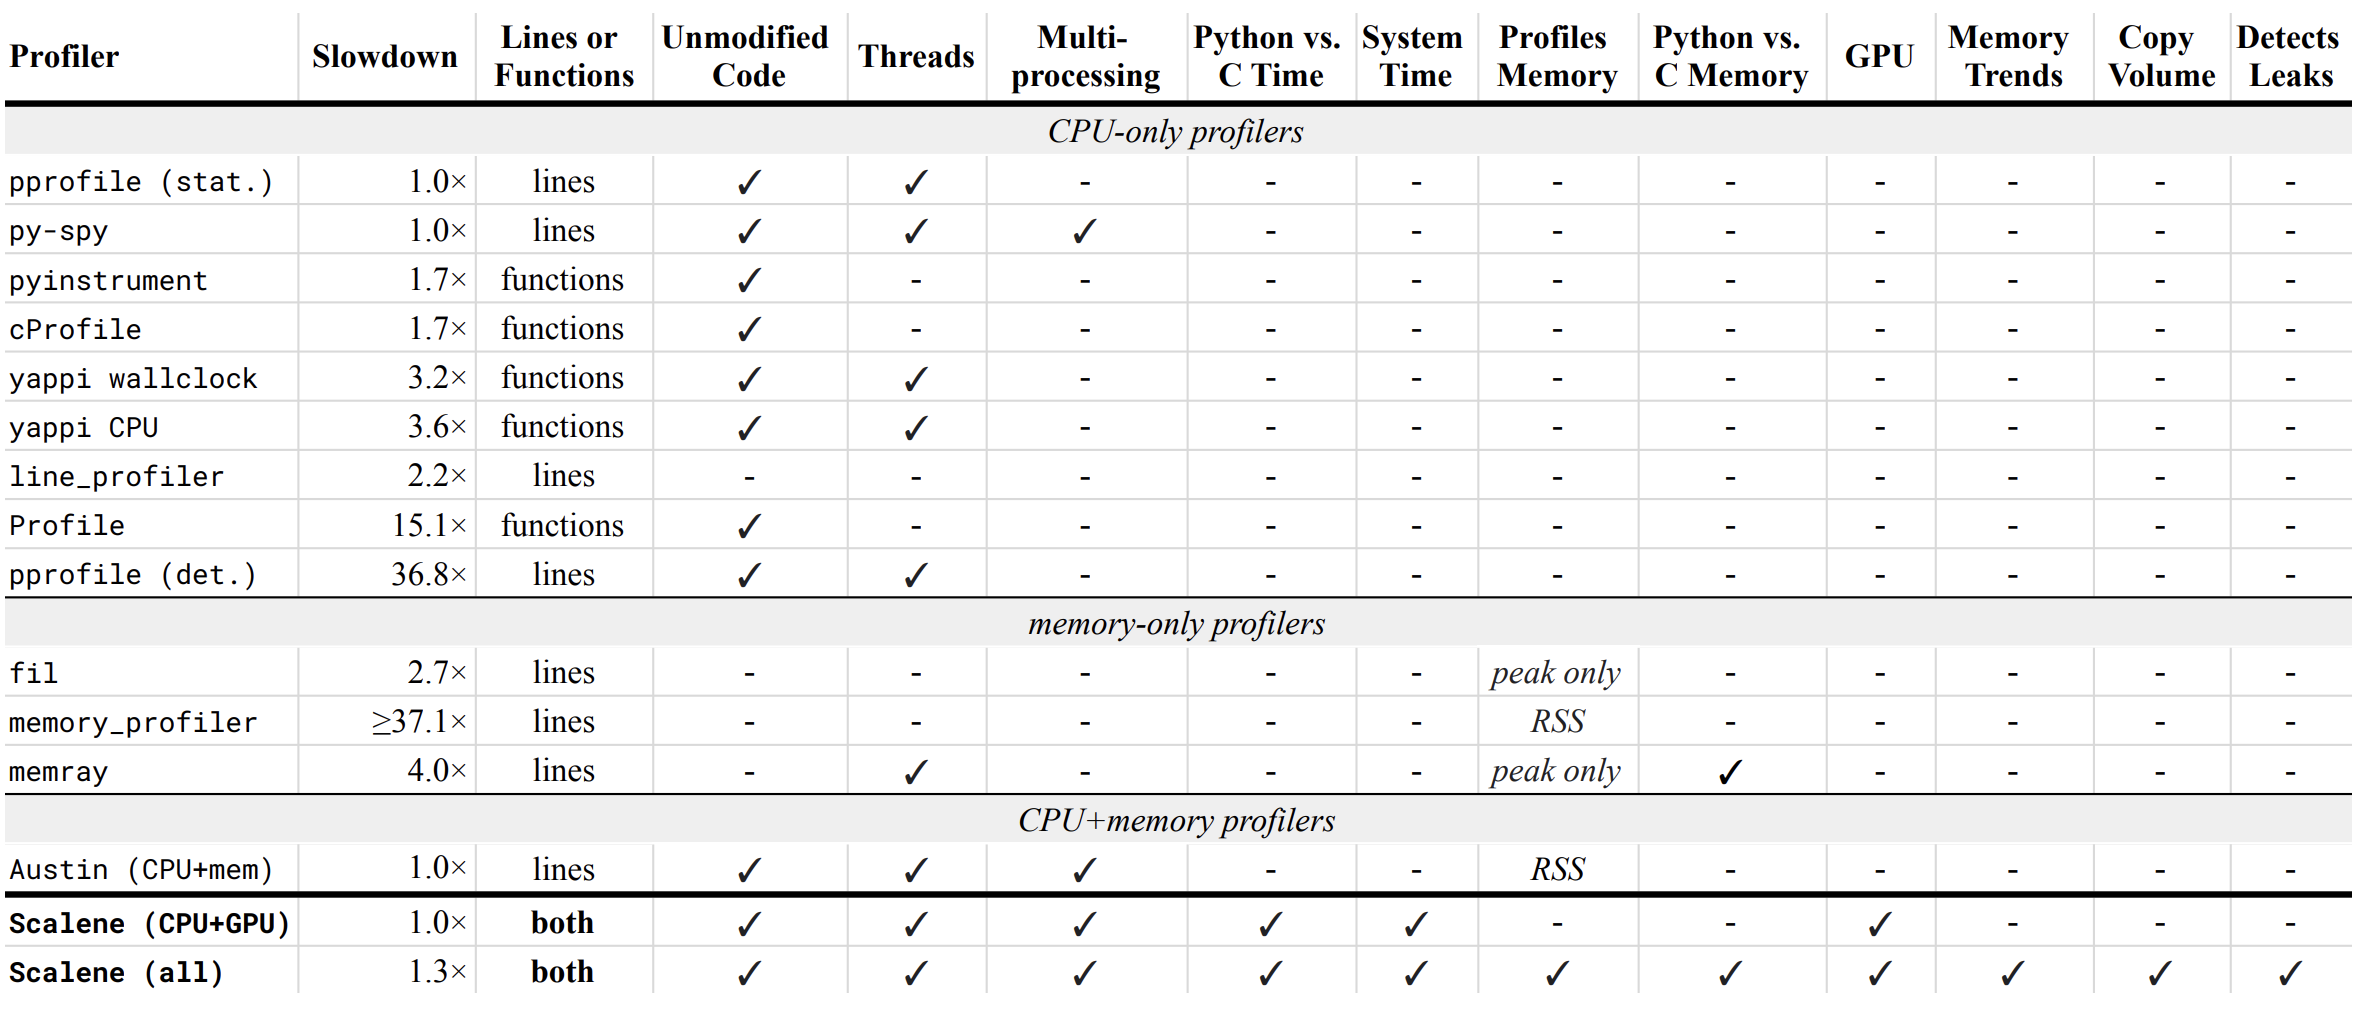
ScaleneはPython用の高性能なCPU/GPU/メモリプロファイラで、他のPythonプロファイラよりも高機能で高速なツールです。
メモリに加えてGPUの計測、システム時間(スリープやI/O)の計測などにも対応しており、オンリーワンのツールであることがわかります。
(なのですが、日本語の記事は見たことがない...)
https://github.com/plasma-umass/scalene?tab=readme-ov-file#performance-and-features
後で紹介しますが、出力はGUIで確認できたり、JSON/HTMLファイルに書き出したりと便利に使えます。
また、OpenAIのGPT-3.5/GPT-4を使ったコードの最適化提案機能もあります。要チェックですね。
使ってみる
pipでインストールします。
pip install scalene
※バージョンは検証時最新の1.5.31.1です。
今回は簡単に下記のコードで検証します。
# test.py
def sample_function():
    total = []
    for i in range(10 ** 8):
        total.append(i)
    return total

sample_function()
実行方法
コマンドラインで実行
scalene [options] your_program.py
オプションとして出力方法・項目などを指定します。
オプション一覧はこちら
-h, --help            show this help message and exit
--version             prints the version number for this release of Scalene and exits
--column-width COLUMN_WIDTH
                      Column width for profile output (default: 132)
--outfile OUTFILE     file to hold profiler output (default: stdout)
--html                output as HTML (default: web)
--json                output as JSON (default: web)
--cli                 forces use of the command-line
--stacks              collect stack traces
--web                 opens a web tab to view the profile (saved as 'profile.html')
--no-browser          doesn't open a web tab; just saves the profile ('profile.html')
--viewer              opens the Scalene web UI and exits.
--reduced-profile     generate a reduced profile, with non-zero lines only (default: False)
--profile-interval PROFILE_INTERVAL
                      output profiles every so many seconds (default: inf)
--cpu                 profile CPU time (default:  True )
--cpu-only            profile CPU time (deprecated: use --cpu )
--gpu                 profile GPU time and memory (default: False )
--memory              profile memory (default: True )
--profile-all         profile all executed code, not just the target program (default: only the target program)
--profile-only PROFILE_ONLY
                      profile only code in filenames that contain the given strings, separated by commas (default: no restrictions)
--profile-exclude PROFILE_EXCLUDE
                      do not profile code in filenames that contain the given strings, separated by commas (default: no restrictions)
--use-virtual-time    measure only CPU time, not time spent in I/O or blocking (default: False)
--cpu-percent-threshold CPU_PERCENT_THRESHOLD
                      only report profiles with at least this percent of CPU time (default: 1%)
--cpu-sampling-rate CPU_SAMPLING_RATE
                      CPU sampling rate (default: every 0.01s)
--allocation-sampling-window ALLOCATION_SAMPLING_WINDOW
                      Allocation sampling window size, in bytes (default: 10485767 bytes)
--malloc-threshold MALLOC_THRESHOLD
                      only report profiles with at least this many allocations (default: 100)
--program-path PROGRAM_PATH
                      The directory containing the code to profile (default: the path to the profiled program)
--memory-leak-detector
                      EXPERIMENTAL: report likely memory leaks (default: True)
--on                  start with profiling on (default)
--off                 start with profiling off
デフォルトでは実行時にブラウザが開き、GUIで結果が表示されます。
※ssh接続先で実行する場合、ブラウザに遷移することなく標準出力に出力されました。
コードの実行時間が短すぎるとScaleneによるプロファイリングは動かず、下記のエラーが表示されます。
Scalene: Program did not run for long enough to profile.
Jupyterで実行
Jupyterではマジックコマンドを使って実行します。
%load_ext scalene

# Line mode
%scrun [options] statement

# Cell mode
%%scalene [options]
your code here
Jupyterでの実行時にはメモリ計測はできません...。
Scalene extension successfully loaded. Note: Scalene currently only supports CPU+GPU profiling inside Jupyter notebooks. For full Scalene profiling, use the command line version.
ちなみにデコレータを使う方法やコード内に直接定義する方法もあります(詳しくはこちら)。
GUIで確認
下記を実行すると...
scalene test.py
結果はこんな感じ👇

(結果はprofile.htmlとして保存されており、そのHTMLが開かれているようです。)
各項目にカーソルを合わせると詳細な数字が確認でき、各列名をクリックすることで自由にソートもできます。
またここでは示されていませんが、動作環境にNVIDIA GPUがインストールされている場合、GPUの実行時間も計測できます。
さらに、上部のadvanced optionsからLLMによる最適化提案機能を設定できます。

OpenAIのAPIキーを入力し、モデルをGPT-3.5とGPT-4から選択します(残高がないとエラーするので注意)。
そしてコードに表示されている💥や⚡をクリックすると、こんな感じで書き換え案が提示されます🎉

また、Jupyterでもこのように結果が表示されますが、メモリ使用量などは取得できないのでコマンドラインから実行するのが吉です。

CLIで確認
下記を実行すると...
scalene --cli test.py
結果はこんな感じ👇

手軽に見たい場合はこれで十分ですね。
ファイルに出力
HTML
scalene --cli --html --outfile output.html test.py
--cliオプションを指定しないとブラウザで開かれてしまいます。
HTMLファイルはデフォルトでも生成されているので、出力ファイル名を指定したいときに使うとよさそうです。
JSON
scalene --cli --json --outfile output.json test.py
データをこねこねしたいときはJSONファイルに出力しましょう。
--cliオプションを指定しないとブラウザで開かれてしまうだけでなく、JSON形式で保存されなくなってしまうのでMUSTです。
出力されるJSON(一部省略)
{
    "alloc_samples": 938,
    "args": [
        "test.py"
    ],
    "elapsed_time_sec": 9.31862497329712,
    "filename": "hogehoge",
    "files": {
        "hogehoge/test.py": {
            "functions": [
                {
                    "line": "Scalene.sample_function",
                    "lineno": 1,
                    "memory_samples": [...],
                    "n_avg_mb": 2890.0064544677734,
                    "n_copy_mb_s": 0.0,
                    "n_core_utilization": 0.10783966435646258,
                    "n_cpu_percent_c": 28.423653243865136,
                    "n_cpu_percent_python": 57.8480782413048,
                    "n_gpu_avg_memory_mb": 0.0,
                    "n_gpu_peak_memory_mb": 0.0,
                    "n_gpu_percent": 0,
                    "n_growth_mb": 2890.0064544677734,
                    "n_malloc_mb": 3813.505753517151,
                    "n_mallocs": 1,
                    "n_peak_mb": 2890.0064544677734,
                    "n_python_fraction": 0.9999966878476239,
                    "n_sys_percent": 13.728268514829912,
                    "n_usage_fraction": 1.0
                }
            ],
            "imports": [],
            "leaks": {},
            "lines": [
                {
                    "end_outermost_loop": 5,
                    "end_region_line": 5,
                    "line": "def sample_function():\n",
                    "lineno": 1,
                    "memory_samples": [],
                    "n_avg_mb": 0.0,
                    "n_copy_mb_s": 0.0,
                    "n_core_utilization": 0.0,
                    "n_cpu_percent_c": 0.0,
                    "n_cpu_percent_python": 0.0,
                    "n_gpu_avg_memory_mb": 0.0,
                    "n_gpu_peak_memory_mb": 0.0,
                    "n_gpu_percent": 0,
                    "n_growth_mb": 0.0,
                    "n_malloc_mb": 0.0,
                    "n_mallocs": 0,
                    "n_peak_mb": 0.0,
                    "n_python_fraction": 0,
                    "n_sys_percent": 0.0,
                    "n_usage_fraction": 0.0,
                    "start_outermost_loop": 1,
                    "start_region_line": 1
                },
                ...
            ],
            "percent_cpu_time": 100.0
        }
    },
    "gpu": false,
    "growth_rate": 0.08109565504538821,
    "max_footprint_fname": "hogehoge/test.py",
    "max_footprint_lineno": 3,
    "max_footprint_mb": 3843.3808002471924,
    "memory": true,
    "program": "hogehoge/test.py",
    "samples": [...],
    "stacks": []
}
おわりに
以上Scaleneの紹介でした。
本記事が少しでも皆さんの目に留まれば、みんなが(知っているのかどうかを筆者が)知らないことはなくなりそうです。