要 旨
Colabを使用してPython3において日経平均株価の推移を可視化する方法について記述します。
実施要領
必要なライブラリのインストール等
!pip install japanize_matplotlib
import numpy as np
import pandas as pd
import matplotlib.pyplot as plt
import japanize_matplotlib
%matplotlib inline
%config InlineBackend.figure_format = 'retina'
日経平均株価の取得
from pandas_datareader import data as web
from pandas import Series, DataFrame
import datetime

nikkei_df = web.DataReader("NIKKEI225", "fred", start=datetime.date(1900, 1, 1))
nikkei_df = nikkei_df.dropna()
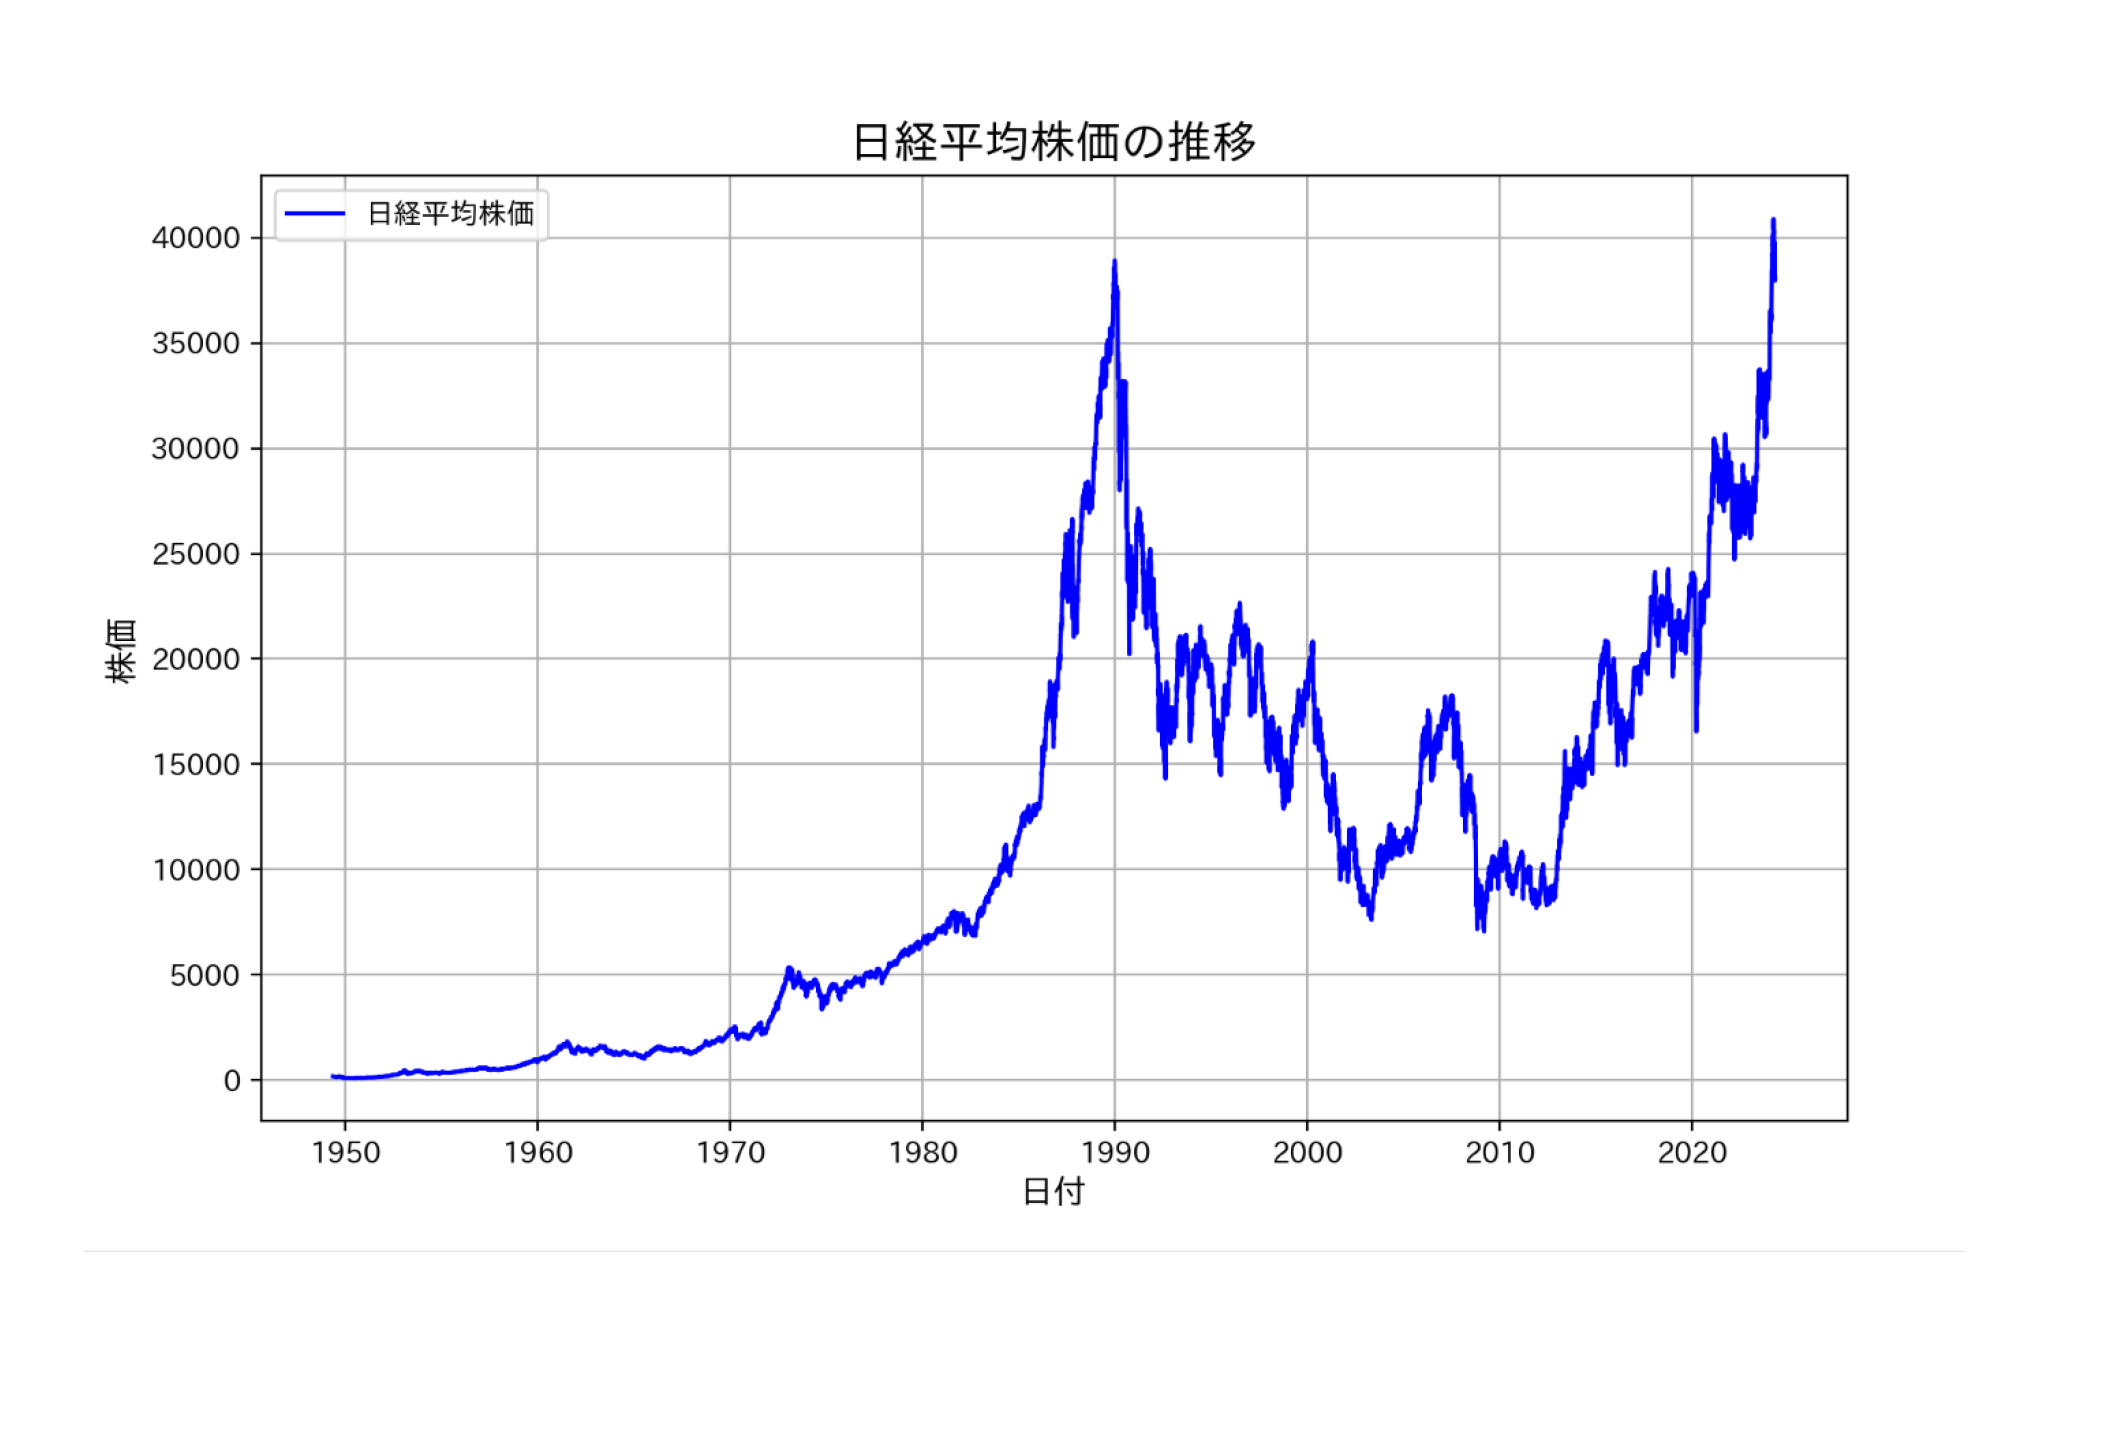
日経平均株価の可視化
plt.figure(figsize=(10, 6))
plt.plot(nikkei_df.index, nikkei_df['NIKKEI225'], label='日経平均株価', color='b')
plt.title('日経平均株価の推移', fontsize=16)
plt.xlabel('日付', fontsize=12)
plt.ylabel('株価', fontsize=12)
plt.grid(True)
plt.legend()
plt.show()
実行例
結 言
今回は、Colabを使用してPython3において日経平均株価の推移を可視化する方法について記述しました。