2015年最後のElastic Search勉強会でBeatsを知り、
今回もまた良い仕事してくれそうなelasticに期待できたので、
手元で動かしてみた。
基本的には公式のインストールの流れ通りで構築できる。
https://www.elastic.co/guide/en/beats/libbeat/current/index.html
【環境】
サーバ(Elastic search,kibana,logstash/CensOS7)
クライアント(packet beat,file beat,top beat/CentOS7 chefが動いているサーバ)
【構築して気づいた点】
・elastic searchは/optから/etcに場所が移った気がする
・logstachは/optの下に作られる
・packet beat,topbeat,file beatは/etcの下に作られる
ElasticSearchインストール・設定
# yum install java-1.7.0-openjdk
# curl -L -O #https://download.elastic.co/elasticsearch/elasticsearch/elasticsearch-2.1.1.rpm
# rpm -i elasticsearch-2.1.1.rpm
# systemctl daemon-reload
# systemctl enable elasticsearch.service
# systemctl start elasticsearch.service
# systemctl status elasticsearch.service
jsonで値が取れるか確認
# curl http://127.0.0.1:9200
```
```lang:elasticsearch.yml
network.host: 192.168.22.70 コメントアウト
http.port: 9200 コメントアウト
```
```
# systemctl stop elasticsearch
# systemctl status elasticsearch
# systemctl start elasticsearch
# systemctl status elasticsearch
# curl http://192.168.22.70:9200
{
"name" : "Malekith the Accursed",
"cluster_name" : "elasticsearch",
"version" : {
"number" : "2.1.1",
"build_hash" : "40e2c53a6b6c2972b3d13846e450e66f4375bd71",
"build_timestamp" : "2015-12-15T13:05:55Z",
"build_snapshot" : false,
"lucene_version" : "5.3.1"
},
"tagline" : "You Know, for Search"
}
```
Logstashインストール・設定
```
# curl -L -O #https://download.elastic.co/logstash/logstash/packages/centos/logstash-2.1.1-1.noarch.rpm
# rpm -i logstash-2.1.1-1.noarch.rpm
# rpm -qa | grep log
# cd /opt/logstash/
# ls
# ./bin/plugin install logstash-input-beats
```
```lang:config.json
input {
beats {
port => 5044
}
}
output {
elasticsearch {
hosts => "192.168.22.70:9200"
sniffing => true
manage_template => false
index => "%{[@metadata][beat]}-%{+YYYY.MM.dd}"
document_type => "%{[@metadata][type]}"
}
}
```
```
# systemctl enable logstash
# systemctl start logstash
# systemctl status logstash
# systemctl start logstash.service
# systemctl status logstash.service
```
Kibanaインストール・設定
```
# curl -L -O https://download.elastic.co/kibana/kibana/kibana-4.3.1-linux-x64.tar.gz
# tar xzvf kibana-4.3.1-linux-x64.tar.gz
# cd kibana-4.3.1-linux-x64/
# ./bin/kibana &
http://127.0.0.1:5601確認
beats用ダッシュボードを適用
# curl -L -O http://download.elastic.co/beats/dashboards/beats-dashboards-1.0.1.tar.gz
# tar xzvf beats-dashboards-1.0.1.tar.gz
# cd beats-dashboards-1.0.1/
# ls
# ./load.sh
# cd kibana-4.3.1-linux-x64
# cp kibana.yml kibana.yml.org
```
```lang:kibana.yml
server.port: 5601 コメントを取る
server.host: "192.168.22.70" コメント取る
elasticsearch.url: "http://192.168.22.70:9200"
pid.file: /var/run/kibana.pid コメントとる
logging.verbose: true 一度確認でコメントを外して後でfalseにする
```
クライアント側(packet beat,file beat,top beat)
それぞれ、ymlファイルではElastic searchを利用するように指定。(コメントアウト箇所)
■packet beatのインストール
```
# yum install libpcap
# curl -L -O https://download.elastic.co/beats/packetbeat/packetbeat-1.0.1-x86_64.rpm
# rpm -vi packetbeat-1.0.1-x86_64.rpm
# rpm -qa | grep packet
# cp packetbeat.yml packetbeat.yml.org
```
```lang:packetbeat.yml
以下の該当箇所をコメントアウト、記載変更
ports: [80, 8080, 8081, 5000, 8002]
hosts: ["192.168.22.70:9200"]
```
```
# curl -XPUT 'http://192.168.22.70:9200/_template/packetbeat' -d@/etc/packetbeat/packetbeat.template.json
# systemctl start packetbeat
# systemctl status packetbeat
# curl -XGET 'http://192.168.22.70:9200/packetbeat-*/_search?pretty'
{
"took" : 31,
"timed_out" : false,
"_shards" : {
"total" : 15,
"successful" : 15,
"failed" : 0
},
"hits" : {
"total" : 285387,
"max_score" : 1.0,
"hits" : [ {
"_index" : "packetbeat-2016.01.04",
"_type" : "pgsql",
"_id" : "AVILHywD_QULozThr4Lw",
"_score" : 1.0,
"_source":{"@timestamp":"2016-01-04T05:32:18.239Z","beat":{"hostname":"chef01","name":"chef01"},"bytes_in":35,"bytes_out":59,"client_ip":"127.0.0.1","client_port":32847,"client_proc":"","client_server":"chef01","count":1,"direction":"out","ip":"127.0.0.1","method":"SELECT","pgsql":{"error_code":"","error_message":"","error_severity":"","iserror":false,"num_fields":1,"num_rows":1},"port":5432,"proc":"","query":"SELECT 'pong' as ping LIMIT 1","responsetime":2,"server":"chef01","status":"OK","type":"pgsql"}
}, 以下略
}
# systemctl start topbeat
# systemctl status topbeat
```
■filebeatのインストール
```
# curl -L -O https://download.elastic.co/beats/filebeat/filebeat-1.0.1-x86_64.rpm
# rpm -vi filebeat-1.0.1-x86_64.rpm
# cp filebeat.yml filebeat.yml.org
```
```lang:filebeat.yml
- /var/log/messages 指定
hosts: ["192.168.22.70:9200"] 指定
```
```
# curl -XPUT 'http://192.168.22.70:9200/_template/filebeat?pretty' -d@/etc/filebeat/filebeat.template.json
# systemctl start filebeat
# systemctl status filebeat
```
■結果
値を取得してkibanaで表示できた。
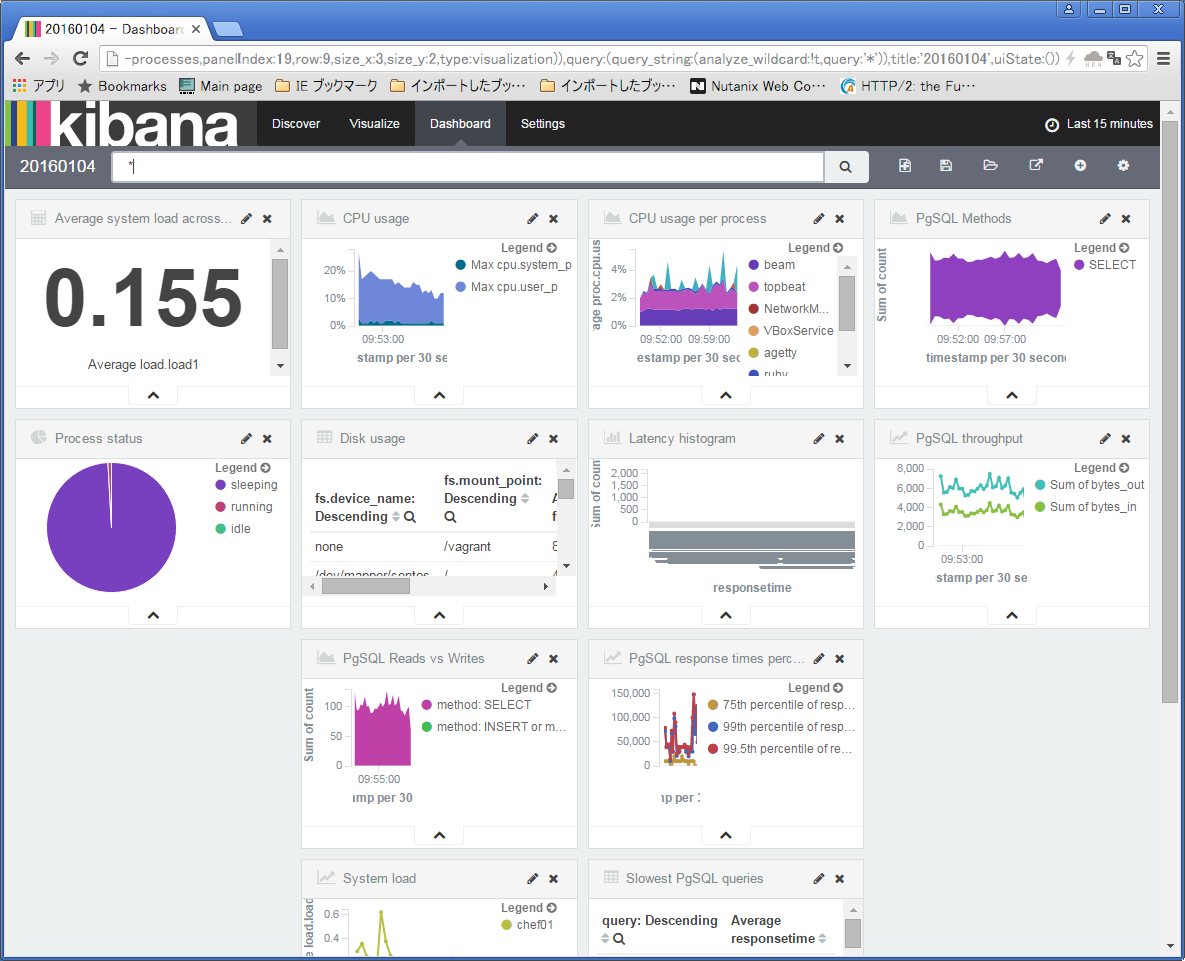
■今後
いったん、ここまで。対応しているプロダクトは少ないが主要なメトリクスはあるので、もう少し触ってみる。