ご覧いただきありがとうございます。
Google Colaboratoryにアカウントをお持ちの方は、上の「Open in Colab」という青いボタンを押せば直接notebookをColabで開けます。ぜひ動かしてみてください。
過去の記事も含め、全てのコードをGithubで公開しています。
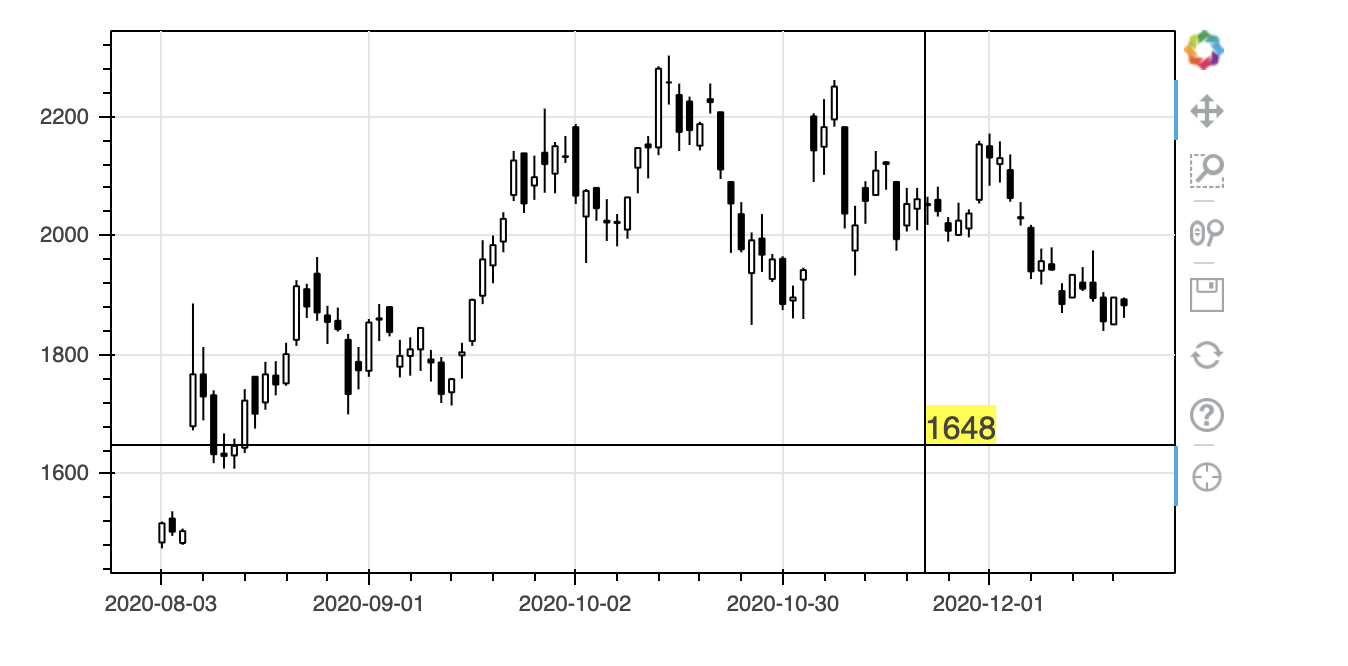
以前の記事でインタラクティブなローソク足をBokehで作成しました。その際、値を吹き出しで表示する機能は邪魔なので除いてしまいました。しかし、十字線が表示されるとはいえ、目視で値を読み取るのはちょっと苦労します。そこでよくあるのは十字線に連動してその値を表示するGUIですが、この機能はBokehには標準機能として用意されていません。本記事ではBokehの機能拡張を利用してこれを実現します。
まずはデータを取得します。
import pandas_datareader.data as web
df = web.DataReader("3040.JP", "stooq").dropna().sort_index()
次に、ローソク足を作成する関数を定義します。
from bokeh.plotting import figure
from bokeh.models import ColumnDataSource
import pandas as pd

def candlestick(df, plot_width=600, plot_height=300):
    df = df.reset_index()
    source = ColumnDataSource(df)
    inc = ColumnDataSource(df[df.Close >= df.Open])
    dec = ColumnDataSource(df[df.Open > df.Close])
    w = (df.index[1] - df.index[0]) / 2  # X軸の1メモリの半分

    fig = figure(plot_width=plot_width, plot_height=plot_height)
    fig.segment('index', 'High', 'index', 'Low', source=source, color="black")
    fig.vbar('index', w, 'Open', 'Close', source=inc, line_color="black", fill_color="white")
    fig.vbar('index', w, 'Open', 'Close', source=dec, line_color="black", fill_color="black")
    fig.xaxis.major_label_overrides = {
        i: pd.to_datetime(date).strftime('%Y-%m-%d') for i, date in enumerate(source.data['Date'])
    }
    fig.xaxis.bounds = (0, df.index[-1]) # X軸の範囲を明示的に指定
    fig.outline_line_color = 'black'
    return fig
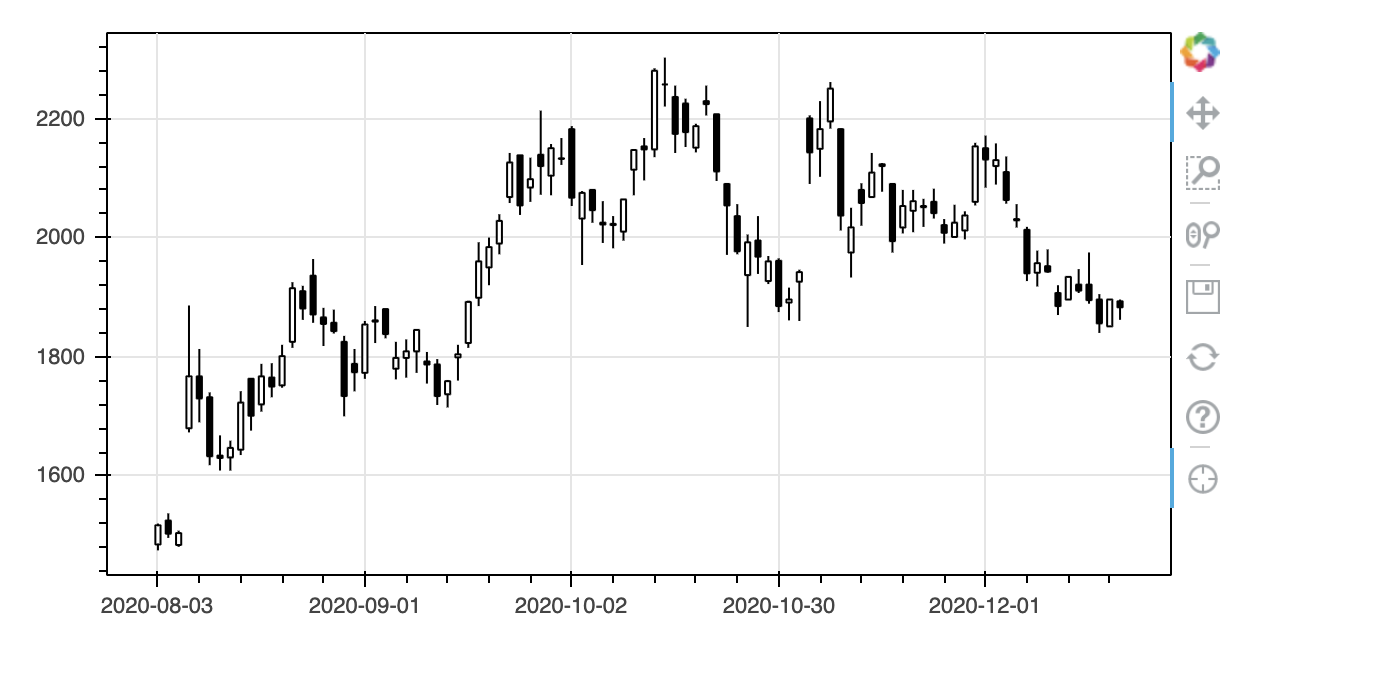
ローソク足の描画は以下になります。
from bokeh.plotting import show, output_notebook
from bokeh.models import CrosshairTool

fig = candlestick(df['2020-8-1':])
fig.add_tools(CrosshairTool())
output_notebook()  # 出力先をノートブックに設定
show(fig)
※ Qiitaでは出力結果を記事内に埋め込めないので、イメージ画像と出力されたファイル例へのリンクで代替します。ぜひColabで実際に動かしてみてください。
BokehではイベントにJavaScriptのコードを結び付けることができ、これを利用して機能を拡張します。イベントにコードを結びつける例はここにあります。この例を参考に図中のマウスポインターの位置を取得して表示させているのが以下です。
from bokeh.models import CustomJS, Div
from bokeh import events
from bokeh.layouts import row

div = Div(width=400, height=fig.plot_height, height_policy="fixed")

def display_event(div, attributes=[], style = 'float:left;clear:left;font_size=13px'):
    "Build a suitable CustomJS to display the current event in the div model."
    return CustomJS(args=dict(div=div), code="""
        var attrs = %s; var args = [];
        for (var i = 0; i<attrs.length; i++) {
            args.push(attrs[i] + '=' + Number(cb_obj[attrs[i]]).toFixed(2));
        }
        var line = "<span style=%r><b>" + cb_obj.event_name + "</b>(" + args.join(", ") + ")</span>\\n";
        var text = div.text.concat(line);
        var lines = text.split("\\n")
        if (lines.length > 35)
            lines.shift();
        div.text = lines.join("\\n");
    """ % (attributes, style))

point_attributes = ['x', 'y', 'sx', 'sy']
fig.js_on_event(events.MouseMove, display_event(div, attributes=point_attributes))

output_notebook()  # 出力先をノートブックに設定
show(row(fig, div))
Pythonの世界からJavaScriptを呼んじゃってます。Bokeh恐るべしです。
上記を見るとJavaScriptにx, y, sx, syという値が渡せることが分かります。x, yは各座標軸上の座標、sx, syは左上を原点としたスクリーン上の座標のようです。これを利用して、十字線の中心座標を画面上に動的に表示させましょう。
基本的な戦略は、Pythonの世界で作成して追加したGUIの部品をJavaScriptの世界に持ち込んで、操作するというものです。以下のようにLabelの部品を追加します。
from bokeh.models.annotations import Label
fig = candlestick(df['2020-8-1':])
label = Label(text="Label", x=1, y=2000, background_fill_color='yellow')
fig.add_layout(label)
output_notebook()
show(fig)
JavaScriptの世界には引数を介して持ち込みます。CustomJSのcodeの中ではcb_objという変数があって、 {origin:f, sx:550, sy:60, x:62.34, y:2109.90}という形をしています。そこで、ラベルの表示にy軸の座標を整数化したものを表示するには以下のようにします。
def display_event(label):
    return CustomJS(args=dict(label=label), code="""
        label.text = Number(cb_obj['y']).toFixed(0)
    """)

fig = candlestick(df['2020-8-1':])
label = Label(text="Label", x=1, y=2000, background_fill_color='yellow')
fig.add_layout(label)
fig.add_tools(CrosshairTool())
fig.js_on_event(events.MouseMove, display_event(label=label))
output_notebook()
show(fig)
マウスポインターの動きに追従してy軸の値がラベルの中に表示されますね。ラベルにはx,yという属性があって表示位置を指定できるので、マウスポインターの位置にラベルが表示されるようにするには以下のようにします。
def display_event(label):
    return CustomJS(args=dict(label=label), code="""
        label.text = Number(cb_obj['y']).toFixed(0)
        label.x = cb_obj['x']
        label.y = cb_obj['y']
    """)

fig = candlestick(df['2020-8-1':])
label = Label(background_fill_color='yellow')
fig.add_layout(label)
fig.add_tools(CrosshairTool())
fig.js_on_event(events.MouseMove, display_event(label=label))
output_notebook()
show(fig)
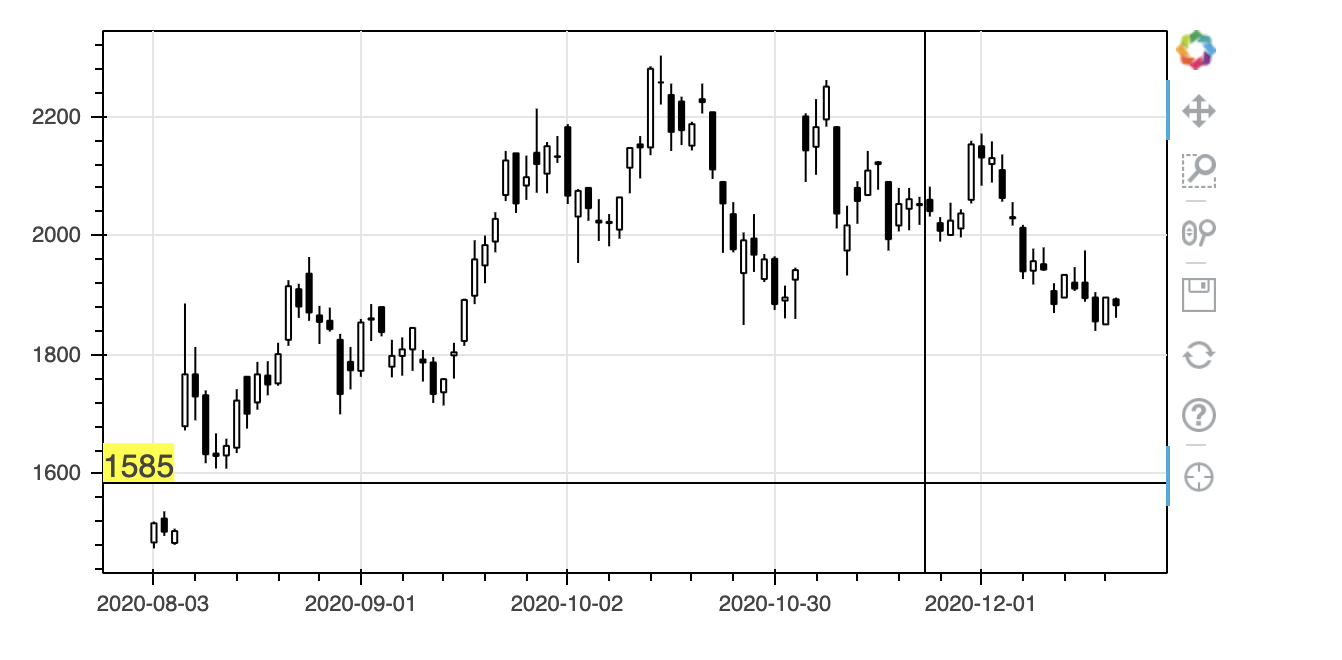
うまくいきました。それではここでラベルの表示位置をy軸のそばにするため、label.xを0にしてみます。
def display_event(label):
    return CustomJS(args=dict(label=label), code="""
        label.text = Number(cb_obj['y']).toFixed(0)
        label.x = 0
        label.y = cb_obj['y']
    """)

fig = candlestick(df['2020-8-1':])
label = Label(background_fill_color='yellow')
fig.add_layout(label)
fig.add_tools(CrosshairTool())
fig.js_on_event(events.MouseMove, display_event(label=label))
output_notebook()
show(fig)
一見、うまくいっているように見えます。しかし、図をドラッグして左右に動かすとダメなことがわかります。図の左端ではなく、先頭のデータの位置に表示されています。これはlabel.xがスクリーン座標ではなくデータ位置だからです。
Labelの定義でx_units='screen'を指定すればこれを回避できます。具体的には以下のようにします。
def display_event(label):
    return CustomJS(args=dict(label=label), code="""
        label.text = Number(cb_obj['y']).toFixed(0)
        label.x = 0
        label.y = cb_obj['y']
    """)

fig = candlestick(df['2020-8-1':])
label = Label(background_fill_color='yellow', x_units='screen')
fig.add_layout(label)
fig.add_tools(CrosshairTool())
fig.js_on_event(events.MouseMove, display_event(label=label))
output_notebook()
show(fig)
Labelには色々とオプションがあるので、見え方を調整してみます。その際、図表の外側に表示するためにはrender_modeを'css'にする必要があります。
def display_event(label):
    return CustomJS(args=dict(label=label), code="""
        label.text = Number(cb_obj['y']).toFixed(0)
        label.x = 0
        label.y = cb_obj['y']
    """)

fig = candlestick(df['2020-8-1':])
label = Label(x_units='screen', x_offset=-40, y_offset=-8, render_mode='css',
              border_line_color='black', background_fill_color='white')
fig.add_layout(label)
fig.add_tools(CrosshairTool())
fig.js_on_event(events.MouseMove, display_event(label=label))
output_notebook()
show(fig)
それでは今度は日付を表示するようにしてみましょう。
def display_event(label):
    return CustomJS(args=dict(label=label), code="""
        label.text = String(cb_obj['x'])
        label.x = cb_obj['x']
        label.y = cb_obj['y']
    """)

fig = candlestick(df['2020-8-1':])
label = Label(background_fill_color='yellow')
fig.add_layout(label)
fig.add_tools(CrosshairTool())
fig.js_on_event(events.MouseMove, display_event(label=label))
output_notebook()
show(fig)
失敗です。x軸は土日を詰めるために日付そのものではなくデータ位置になっているのでした。データ位置と日付の対応をとるためには元データを渡す必要がありますが、うまくいくのでしょうか。
def display_event(source, label):
    return CustomJS(args=dict(source=source, label=label), code="""
        var date = new Date(source.data['Date'][Number(cb_obj['x']).toFixed(0)])
        label.text = date.toISOString().substr(0, 10)
        label.x = cb_obj['x']
        label.y = cb_obj['y']
    """)

target = df['2020-8-1':]
fig = candlestick(target)
label = Label(background_fill_color='yellow')
fig.add_layout(label)
fig.add_tools(CrosshairTool())
fig.js_on_event(events.MouseMove, display_event(source=ColumnDataSource(target), label=label))
output_notebook()
show(fig)
簡単にできてしまいました。Bokeh恐るべし。実はdisplay_eventのsourceに最初は
targetそのものを指定したのですが、JSONに変換できないというエラーになりました。
TypeError: Object of type 'DataFrame' is not JSON serializable
逆に、JSON serializableなものなら渡せるということです。よくできてますね。
実は、まだ一つ不満があります。図をドラッグさせてデータがない部分にマウスカーソルを動かすと、ラベルが張り付いて動かなくなるのです。どうやら日付を抽出するコードで範囲エラーが起こっているようです。エラーが起こったらラベルを消すようにしてみましょう。
def display_event(source, label):
    return CustomJS(args=dict(source=source, label=label), code="""
        try {
            label.visible = true
            var date = new Date(source.data['Date'][Number(cb_obj['x']).toFixed(0)])
            label.text = date.toISOString().substr(0, 10)
            label.x = cb_obj['x']
            label.y = cb_obj['y']
        } catch(e) {
            label.visible = false
        }
    """)

target = df['2020-8-1':]
fig = candlestick(target)
label = Label(background_fill_color='yellow')
fig.add_layout(label)
fig.add_tools(CrosshairTool())
fig.js_on_event(events.MouseMove, display_event(source=ColumnDataSource(target), label=label))
output_notebook()
show(fig)
範囲外でうまくラベルが消えるようになりました。
以上を合わせてx軸とy軸を両方とも表示するには以下になります。ついでにマウスカーソルが図から外れた時にラベルが残らないようにevents.MouseLeaveにも関数を割り当てています。
from bokeh.plotting import figure, show, output_notebook
from bokeh.models import ColumnDataSource, Range1d, LinearAxis, NumeralTickFormatter
from bokeh.models import CustomJS, CrosshairTool
from bokeh.models.annotations import Label
from bokeh import events
import pandas as pd

def display_event(source, xlabel, ylabel):
    return CustomJS(args=dict(source=source, xlabel=xlabel, ylabel=ylabel), code="""
        try {
            xlabel.visible = true
            var date = new Date(source.data['Date'][Number(cb_obj['x']).toFixed(0)])
            xlabel.text = date.toISOString().substr(0, 10)
            xlabel.x = cb_obj['x']
            xlabel.y = 0
        } catch(e) {
            xlabel.visible = false
        }
        ylabel.visible = true
        ylabel.x = 0
        ylabel.y = cb_obj['y']
        ylabel.text = Number(cb_obj['y']).toFixed(0)
    """)

def leave_event(xlabel, ylabel):
    return CustomJS(args=dict(xlabel=xlabel, ylabel=ylabel), code="""
        xlabel.visible = false
        ylabel.visible = false
    """)

target = df['2020-8-1':]
fig = candlestick(target)
xlabel = Label(y_units='screen', x_offset=-40, y_offset=-20, render_mode='css',
               border_line_color='black', background_fill_color='white', visible=False)
ylabel = Label(x_units='screen', x_offset=-40, y_offset=-8, render_mode='css',
               border_line_color='black', background_fill_color='white', visible=False)
fig.add_layout(xlabel)
fig.add_layout(ylabel)
fig.add_tools(CrosshairTool())
fig.js_on_event(events.MouseMove, display_event(source=ColumnDataSource(target), xlabel=xlabel, ylabel=ylabel))
fig.js_on_event(events.MouseLeave, leave_event(xlabel=xlabel, ylabel=ylabel))
output_notebook()
show(fig)
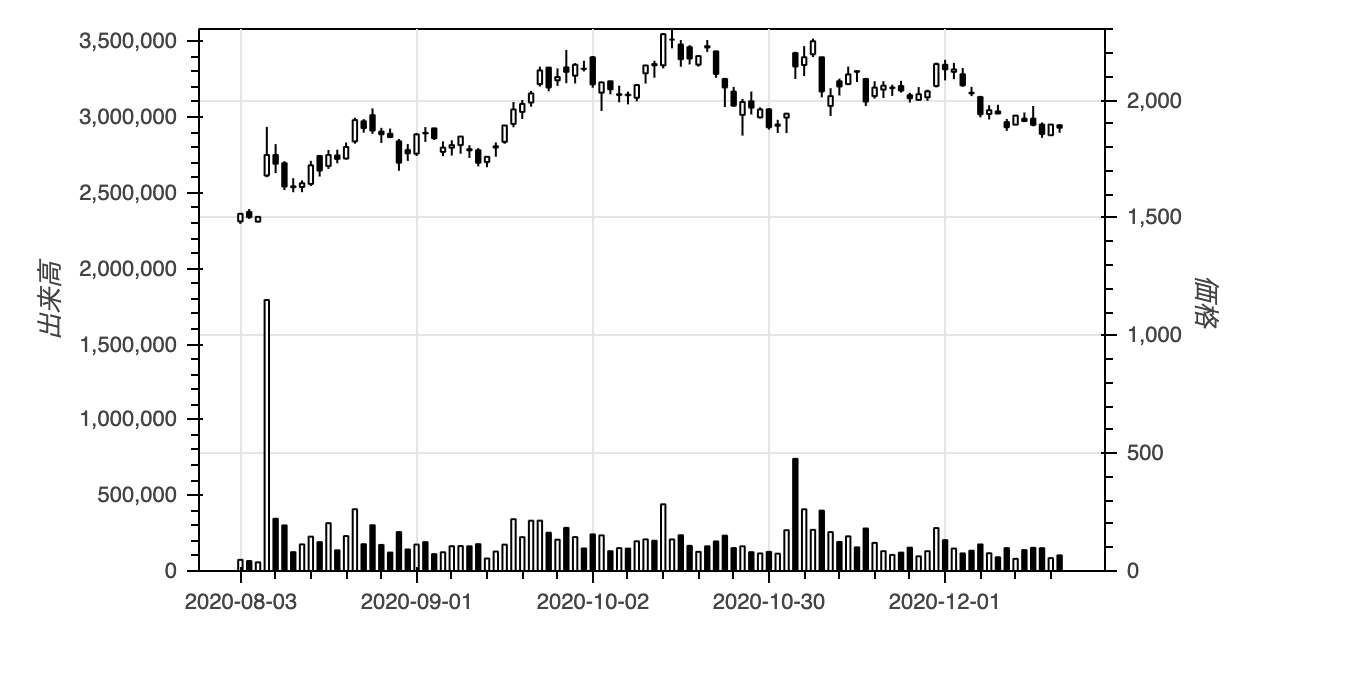
続いて次のような2軸のグラフの場合に、右側に値を表示することを考えます。
from bokeh.plotting import figure, show, output_notebook
from bokeh.models import ColumnDataSource, Range1d, LinearAxis, NumeralTickFormatter
import pandas as pd

def candlestickWithVolume(df, plot_width=600, plot_height=300, x_range=None):
    df = df.reset_index()
    source = ColumnDataSource(df)
    inc = ColumnDataSource(df[df.Close >= df.Open])
    dec = ColumnDataSource(df[df.Open > df.Close])
    w = (df.index[1] - df.index[0]) / 2  # X軸の1メモリの半分

    # ローソク足を作成
    fig = figure(plot_width=plot_width, plot_height=plot_height, x_range=x_range, y_range=(0, max(df.High)),
                 y_axis_location='right', toolbar_location=None)
    fig.segment('index', 'High', 'index', 'Low', source=source, color="black")
    fig.vbar('index', w, 'Open', 'Close', source=inc, line_color="black", fill_color="white")
    fig.vbar('index', w, 'Open', 'Close', source=dec, line_color="black", fill_color="black")
    fig.xaxis.major_label_overrides = {
        i: pd.to_datetime(date).strftime('%Y-%m-%d') for i, date in enumerate(source.data['Date'])
    }
    fig.xaxis.bounds = (0, df.index[-1]) # X軸の範囲を明示的に指定
    fig.yaxis.axis_label = '価格'
    fig.outline_line_color = 'black'

    # 出来高をローソク足と同じグラフに表示
    fig.extra_y_ranges = {"volume": Range1d(start=0, end=max(df.Volume) * 2)}
    fig.add_layout(LinearAxis(y_range_name="volume", axis_label="出来高"), 'left')
    fig.vbar('index', w, 'Volume', source=inc, line_color="black", fill_color="white", y_range_name="volume")
    fig.vbar('index', w, 'Volume', source=dec, line_color="black", fill_color="black", y_range_name="volume")
    fig.yaxis.formatter = NumeralTickFormatter(format="0,0")

    return fig

fig = candlestickWithVolume(df['2020-8-1':])

output_notebook()
show(fig)
右側にラベルを表示する時に困るのはそのx座標をどうするかです。左側なら0と指定しておけばよいですが、右側では図の横幅が必要となります。しかも、固定値ではなく図のサイズに応じて。いろいろ探ってみたところ、JavaSriptでのcb_objに'origin'という属性があり、ここから図のDOMオブジェクトにアクセスできることがわかりました。
次に困ったのは出来高のy座標です。cb_obj['y']はy_rangeの値で、extra_y_rangeの値にアクセスする方法がありません。そこで、予めy軸上での価格と出来高の比率を求め、それを渡して価格から出来高を求めることで解決しました。
from bokeh.plotting import figure, show, output_notebook
from bokeh.models import ColumnDataSource, Range1d, LinearAxis, NumeralTickFormatter
from bokeh.models import CustomJS, CrosshairTool
from bokeh.models.annotations import Label
from bokeh import events
import pandas as pd

def display_event(source, xlabel, vlabel, plabel, pv_ratio):
    return CustomJS(args=dict(source=source, xlabel=xlabel, vlabel=vlabel, plabel=plabel, pv_ratio=pv_ratio), code="""
        try {
            xlabel.visible = true
            var date = new Date(source.data['Date'][Number(cb_obj['x']).toFixed(0)])
            xlabel.text = date.toISOString().substr(0, 10)
            xlabel.x = cb_obj['x']
            xlabel.y = 0
        } catch(e) {
            xlabel.visible = false
        }
        vlabel.visible = true
        vlabel.x = 0
        vlabel.y = cb_obj['y']
        vlabel.text = Math.round(cb_obj['y'] * pv_ratio).toLocaleString()
        plabel.visible = true
        plabel.x = cb_obj['origin'].inner_width
        plabel.y = cb_obj['y']
        plabel.text = Math.round(cb_obj['y']).toLocaleString()
    """)

def leave_event(xlabel, vlabel, plabel):
    return CustomJS(args=dict(xlabel=xlabel, vlabel=vlabel, plabel=plabel), code="""
        xlabel.visible = false
        vlabel.visible = false
        plabel.visible = false
    """)

target = df['2020-8-1':]
fig = candlestickWithVolume(target)
xlabel = Label(y_units='screen', x_offset=-40, y_offset=-20, render_mode='css',
               border_line_color='black', background_fill_color='white', visible=False)
vlabel = Label(x_units='screen', x_offset=-76, y_offset=-8, render_mode='css',
               border_line_color='black', background_fill_color='white', visible=False)
plabel = Label(x_units='screen', x_offset=4, y_offset=-8, render_mode='css',
               border_line_color='black', background_fill_color='white', visible=False)
fig.add_layout(xlabel)
fig.add_layout(vlabel)
fig.add_layout(plabel)
pv_ratio = max(target.Volume) * 2 / max(target.High)
fig.add_tools(CrosshairTool())
fig.js_on_event(events.MouseMove,
                display_event(source=ColumnDataSource(target), xlabel=xlabel, vlabel=vlabel, plabel=plabel, pv_ratio=pv_ratio))
fig.js_on_event(events.MouseLeave, leave_event(xlabel=xlabel, vlabel=vlabel, plabel=plabel))
output_notebook()
show(fig)
最後に以前の記事で作成した範囲指定付きローソク足に適用します。
from bokeh.models import RangeTool
from bokeh.layouts import column
from bokeh.plotting import output_file

df_reset = df.reset_index()
fig = candlestickWithVolume(df, x_range=(df_reset.index[-100], df_reset.index[-1]))
source = ColumnDataSource(df_reset)
# # 図のタイトルを設定
fig.title.text = 'Soliton'
fig.title.align = 'center'
fig.title.text_font_size = '24pt'
# ラベルを準備
xlabel = Label(y_units='screen', x_offset=-40, y_offset=-20, render_mode='css',
               border_line_color='black', background_fill_color='white', visible=False)
vlabel = Label(x_units='screen', x_offset=-76, y_offset=-8, render_mode='css',
               border_line_color='black', background_fill_color='white', visible=False)
plabel = Label(x_units='screen', x_offset=4, y_offset=-8, render_mode='css',
               border_line_color='black', background_fill_color='white', visible=False)
# ラベルを配置
fig.add_layout(xlabel)
fig.add_layout(vlabel)
fig.add_layout(plabel)
# 出来高と価格の比を計算
pv_ratio = max(df.Volume) * 2 / max(df.High)
# 十字表示を設定
fig.add_tools(CrosshairTool())
# イベントを設定
fig.js_on_event(events.MouseMove,
                display_event(source=source, xlabel=xlabel, vlabel=vlabel, plabel=plabel, pv_ratio=pv_ratio))
fig.js_on_event(events.MouseLeave, leave_event(xlabel=xlabel, vlabel=vlabel, plabel=plabel))

# 範囲ツールを設定
range_tool = RangeTool(x_range=fig.x_range)
range_tool.overlay.fill_color = "navy"
range_tool.overlay.fill_alpha = 0.2

# 範囲選択用の図を作成
select = figure(plot_height=130, y_range=fig.y_range, y_axis_location='right',
                tools="", toolbar_location=None, background_fill_color="#efefef")
select.line('index', 'Close', source=source)  # 範囲選択用の図には終値を表示
select.extra_y_ranges = {"volume": Range1d(start=0, end=max(df.Volume) * 2)}
select.add_layout(LinearAxis(y_range_name="volume"), 'left')
select.vbar('index', 0.5, 'Volume', source=source, line_color="black", fill_color="black", y_range_name="volume")
select.yaxis.formatter = NumeralTickFormatter(format="0,0")
select.xaxis.major_label_overrides = {  # X軸の表示の対応を指定
    i: pd.to_datetime(date).strftime('%Y-%m-%d') for i, date in enumerate(df.reset_index()['Date'])
}
select.add_tools(range_tool)

output_notebook()  # 出力先をノートブックに設定
output_file('soliton.html') # ファイルにも出力
show(column(fig, select, sizing_mode='stretch_width'))  # 図を表示
以上です。


