はじめに
本記事はPSF測光手順の説明についての記事です。
「Tomo-e Gozen可視観測の測光解析のメモ1:解析全体」記事の「測光方法」の項目まで進めた上で、この記事の手順に繋がります。
PSF測光
バックグラウンドを引く前の画像に対し、星々に対し2次元ガウス分布+バックグラウンド成分でフィットを行いPSFを推定し測光します。
def fit_2d_gaussian_with_bg(phot_img, err_img, np_x, np_y, crop_size=23):
    """
    Fit a 2D Gaussian to a star in the image.

    Parameters:
    -----------
    phot_img : numpy.ndarray
        Photometric image.

    err_img : numpy.ndarray
        Error image.

    np_x : float
        X-coordinate of the star, with origin at 0 (numpy coordinates).

    np_y : float
        Y-coordinate of the star, with origin at 0 (numpy coordinates).

    crop_size : int, optional
        Size of the cropped region around the star (default is 23).
        For even sizes, a +1 size is applied to ensure the pixel center
        is uniquely determined and stable.

    Returns:
    --------
    popt : array
        Optimal values for the Gaussian parameters.

    pcov : 2D array
        Covariance matrix of the fit.
    """
    def gauss_2d_with_bg(coords, amplitude, bg_offset, sigma_x, sigma_y, x0, y0):
        """
        Calculate the 2D Gaussian function value for given coordinates.
        """
        x, y = coords
        return amplitude * np.exp(-(((x - x0) ** 2) / (2 * sigma_x ** 2) + ((y - y0) ** 2) / (2 * sigma_y ** 2))) + bg_offset

    # 星周辺の画像の切り取り範囲の指定
    int_np_x, int_np_y = int(np_x), int(np_y)
    half_crop_size = crop_size // 2
    # half_crop_size + 1とするのは、中心座標をピクセルの中心になるように指定したいため
    y_slice = slice(int_np_y - half_crop_size, int_np_y + half_crop_size + 1)
    x_slice = slice(int_np_x - half_crop_size, int_np_x + half_crop_size + 1)

    crop_phot_values = phot_img[y_slice, x_slice].ravel()
    crop_err_values = err_img[y_slice, x_slice].ravel()

    y_indices, x_indices = np.indices((y_slice.stop - y_slice.start, x_slice.stop - x_slice.start))
    y_indices = y_indices + y_slice.start
    x_indices = x_indices + x_slice.start
    coords = np.vstack((x_indices.ravel(), y_indices.ravel()))

    # NaNを除外(phot_img <= 0の時、ポアソン誤差が計算できないため、crop_err_values=NaNと予め設定)
    valid_mask = ~np.isnan(crop_err_values)
    coords = coords[:, valid_mask]
    crop_phot_values = crop_phot_values[valid_mask]
    crop_err_values = crop_err_values[valid_mask]

    p0 = [np.max(crop_phot_values), 0, 2, 2, np_x, np_y]
    bounds = ([0, 0, 0, 0, np_x - 3, np_y - 3], [np.inf, np.inf, np.inf, np.inf, np_x + 3, np_y + 3])

    try:
        popt, pcov = curve_fit(gauss_2d_with_bg, coords, crop_phot_values, sigma=crop_err_values, absolute_sigma=True, p0=p0, bounds=bounds)
        return popt, pcov
    except RuntimeError:
        popt, pcov = None, None

        print(f"{inspect.currentframe().f_code.co_name} func:")
        print(f"\tFailure to fit: the star coord of ({np_x:.3f}, {np_y:.3f}) will be removed.")
        print()

        return popt, pcov

def fit_stars_with_bg(df, phot_img, err_img):
    """
    Fit 2D Gaussians to all stars in the DataFrame.

    Parameters:
    -----------
    df : pandas.DataFrame
        DataFrame containing the stars with their px_x and px_y coordinates.

    phot_img : numpy.ndarray
        Photometric image.

    err_img : numpy.ndarray
        Error image.

    Returns:
    --------
    filtered_df : pandas.DataFrame
        DataFrame with stars successfully fitted.

    popts : numpy.ndarray
        Optimal values for the Gaussian parameters for each star.

    pcovs : numpy.ndarray
        Covariance matrices of the fits for each star.
    """
    popts = np.zeros((len(df), 6))
    pcovs = np.zeros((len(df), 6, 6))
    success_fit_flags = np.ones(len(df), dtype=bool)

    np_xs = df['px_x'].to_numpy() - 1
    np_ys = df['px_y'].to_numpy() - 1
    for idx, (np_x, np_y) in enumerate(zip(np_xs, np_ys)):
        popt, pcov = fit_2d_gaussian_with_bg(phot_img, err_img, np_x, np_y)
        if popt is not None:
            popts[idx] = popt
            pcovs[idx] = pcov
        else:
            success_fit_flags[idx] = False

    filtered_df = df[success_fit_flags]
    popts = popts[success_fit_flags]
    pcovs = pcovs[success_fit_flags]

    if len(df) != len(filtered_df):
        print(f"{inspect.currentframe().f_code.co_name} func:")
        print(f"\tSome stars failed to fit and were removed from dataframe:")
        print(f"\t\t{len(df)} -----> {len(filtered_df)} stars")
        print()

    return filtered_df, popts, pcovs

def calc_error_img(phot_nobg_img, phot_bg_std):
    """
    Calculate the error image based on photometric image and background standard deviation.

    Parameters:
    -----------
    phot_nobg_img : numpy.ndarray
        Photometric image.

    phot_bg_std : float
        Background standard deviation.

    Returns:
    --------
    err_img : numpy.ndarray
        Error image with Poisson errors and background noise combined.
    """
    # ポアソン誤差の計算
    with np.errstate(invalid='ignore'):
        # ゼロあるいは負の値に対してnp.where()で場合分けしても警告が出るため、with文で回避)
        poisson_errs = np.sqrt(np.where(phot_nobg_img > 0, phot_nobg_img, np.nan))
    err_img = np.sqrt(poisson_errs**2 + phot_bg_std**2)
    err_img[phot_nobg_img <= 0] = np.nan  # この行の一行前ですでにNaNとなるはずだが念の為フィルタリング
    return err_img

def calc_psf_photometry(popts, pcovs):
    """
    Perform PSF photometry and calculate photometric errors.

    Parameters:
    -----------
    popts : array
        Optimal values for the Gaussian parameters obtained from fitting.

    pcovs : 2D array
        Covariance matrix of the fit parameters.

    Returns:
    --------
    photometric_counts : float
        Calculated photometric counts based on the Gaussian fit.

    photometric_errs : float
        Calculated photometric errors using error propagation.
    """
    amplitude, amplitude_err = popts[:, 0], np.sqrt(pcovs[:, 0, 0])
    sigma_x, sigma_x_err = popts[:, 2], np.sqrt(pcovs[:, 2, 2])
    sigma_y, sigma_y_err = popts[:, 3], np.sqrt(pcovs[:, 3, 3])

    photometric_counts = 2 * np.pi * sigma_x * sigma_y * amplitude

    # 測光誤差を誤差伝搬の法則で計算
    photometric_errs = np.sqrt(
        (2 * np.pi * sigma_x * sigma_y * amplitude_err) ** 2 +
        (2 * np.pi * sigma_y * amplitude * sigma_x_err) ** 2 +
        (2 * np.pi * sigma_x * amplitude * sigma_y_err) ** 2
    )

    return photometric_counts, photometric_errs

def print_stats(label, values_x, values_y):
    print(f"{label}:")
    print("          x-coord                  y-coord")
    print(f"{'median':>10} = {np.median(values_x):>8.3f}    {'median':>10} = {np.median(values_y):>8.3f}")
    print(f"{'mean':>10} = {np.mean(values_x):>8.3f}    {'mean':>10} = {np.mean(values_y):>8.3f}")
    print(f"{'std':>10} = {np.std(values_x):>8.3f}    {'std':>10} = {np.std(values_y):>8.3f}")
    print(f"{'min':>10} = {np.min(values_x):>8.3f}    {'min':>10} = {np.min(values_y):>8.3f}")
    print(f"{'max':>10} = {np.max(values_x):>8.3f}    {'max':>10} = {np.max(values_y):>8.3f}")
    print()


# PSF測光
phot_dfs = pd.DataFrame()
tgt_dfs = pd.DataFrame()

for frame_idx in range(NAXIS3):
    print(f"----- start aperture photometry frame index of {frame_idx} -----")
    img_nobg = cube_imgs_nobg[frame_idx]
    bg_img = bg_imgs[frame_idx]

    # 2Dガウスフィット+バックグラウンドモデルに使う誤差の計算
    phot_nobg_img = GAIN * img_nobg
    phot_bg_img = GAIN * bg_img
    phot_img = phot_nobg_img + phot_bg_img
    phot_bg_mean, _, phot_bg_std = sigma_clipped_stats(phot_bg_img)
    err_img = calc_error_img(phot_nobg_img, phot_bg_std)

    phot_df, phot_stars_popts, phot_stars_pcovs = fit_stars_with_bg(candidate_phot_df, phot_img, err_img)
    tgt_df, tgt_stars_popts, tgt_stars_pcovs = fit_stars_with_bg(src_tgt_df, phot_img, err_img)

    print(f"sep module bg mean: {phot_bg_mean:.3f} ± {phot_bg_std:.3f}")
    print("fitting bg:", phot_stars_popts[:, 1])

    # 測光を実行
    phot_counts, phot_errs = calc_psf_photometry(phot_stars_popts, phot_stars_pcovs)
    tgt_phot_counts, tgt_phot_errs = calc_psf_photometry(tgt_stars_popts, tgt_stars_pcovs)

    # 測光結果をdataframeに保存
    # (copy()を作成する理由はpandasのdateframeのフィルタリング時の SettingWithCopyWarning を避けるため)
    phot_df = phot_df.copy()
    phot_df.loc[:, 'frame_idx'] = frame_idx
    phot_df.loc[:, 'phot_count'] = phot_counts
    phot_df.loc[:, 'phot_error'] = phot_errs

    tgt_df = tgt_df.copy()
    tgt_df.loc[:, 'frame_idx'] = frame_idx
    tgt_df.loc[:, 'phot_count'] = tgt_phot_counts
    tgt_df.loc[:, 'phot_error'] = tgt_phot_errs

    phot_dfs = pd.concat([phot_dfs, phot_df], ignore_index=True)
    tgt_dfs = pd.concat([tgt_dfs, tgt_df], ignore_index=True)
-
fit_stars_with_bg()で2次元ガウス分布+背景成分によるフィットを行います。フィットが失敗した場合は、その天体は除去されます。フィッティングには、f(A,C,\sigma_x, \sigma_y, x_0, y_0)=A \exp\left(-\left(\frac{(x - x_0)^2}{2 \sigma_x^2} + \frac{(y - y_0)^2}{2 \sigma_y^2}\right)\right) + Cscipy.optimize.curve_fit()関数を使用していますが、SciPyはNumpyベースで設計されているため、Numpyデータに変換してから使うようにしてください。この問題については、こちらの記事をご参照ください。 -
calc_psf_photometry()でフィッティング結果から測光値を計算します。測光値$F$はとして計算します。F=\int_{-\infty}^{\infty} \int_{-\infty}^{\infty} f(A,C,\sigma_x, \sigma_y, x_0, y_0) \, dx \, dy = 2\pi\sigma_x\sigma_y A
誤差については、誤差伝搬の法則からを用います。ここでは、変数間を独立として近似的に計算しています。\Delta F = 2\pi \sqrt{\sigma_x^2\sigma_y^2 (\Delta A)^2 + \sigma_y^2 A^2 (\Delta \sigma_x)^2 + \sigma_x^2 A^2 (\Delta \sigma_y)^2}
(より詳細には変数間の従属性(共分散)を計算に含める必要があります。その具体的な方法は、こちらの記事を参照ください。)
ターゲット星の測光
ターゲット星の測光の概要を簡単に示します。
- ターゲット星以外の星々を使って、Gaia g magがゼロの時のカウント値を計算します。その際、外れ値(近くに星があるケースや変光星の可能性)の影響を抑えるため、ある閾値よりも外れたプロットを除外して再度フィッティングします。
- フィッティングで得られたパラメータを用いて、ターゲット星を測光します。
def linear_func(A, x):
    """
    Linear function for fitting.
    """
    return -0.4 * x + A

def fit_gmag_vs_logcount(df):
    """
    Fit a linear model to the g-band magnitudes vs. logarithm of photometric counts.

    Parameters:
    -----------
    df : pandas.DataFrame
        DataFrame containing columns 'phot_g_mean_mag', 'phot_g_mean_mag_error',
        'phot_logcount', and 'phot_logcount_error'.

    Returns:
    --------
    gzero_logcount : float
        Logarithm of photometric count corresponding to zero g-band magnitude.
        (Intercept of the fitted linear model.)


    gzero_logcount_err : float
        Standard error of the logarithm of photometric count at zero g-band magnitude.
        (Standard error of the intercept.)
    """
    gmags = df['phot_g_mean_mag'].to_numpy()
    gmags_errs = df['phot_g_mean_mag_error'].to_numpy()
    phot_logcounts = df['phot_logcount'].to_numpy()
    phot_logcounts_errs = df['phot_logcount_error'].to_numpy()

    mydata = odr.RealData(gmags, phot_logcounts, sx=gmags_errs, sy=phot_logcounts_errs)
    mymodel = odr.Model(linear_func)
    myodr = odr.ODR(mydata, mymodel, beta0=[10])
    myoutput = myodr.run()

    gzero_logcount = myoutput.beta[0]
    gzero_logcount_err = myoutput.sd_beta[0]

    return gzero_logcount, gzero_logcount_err

def calc_residuals(gmags, phot_logcounts, gzero_logcount):
    """
    Calculate residuals and related statistics for the fitted model.

    Parameters:
    -----------
    gmags : numpy.ndarray
        Array of g-band magnitudes.

    phot_logcounts : numpy.ndarray
        Array of logarithm of photometric counts.

    gzero_logcount : float
        Logarithm of photometric count corresponding to zero g-band magnitude.

    Returns:
    --------
    residuals : numpy.ndarray
        Array of residuals between observed and predicted photometric log counts.

    residuals_std : float
        Standard deviation of the residuals.

    r_squared : float
        R-squared value of the fit.
    """
    phot_logcounts_preds = linear_func(gzero_logcount, gmags)
    residuals = phot_logcounts - phot_logcounts_preds
    r_squared = r2_score(phot_logcounts, phot_logcounts_preds)
    residuals_std = np.std(residuals, ddof=1)

    return residuals, residuals_std, r_squared

def filter_outliers_by_residuals(df, gzero_logcount, residuals_threshold_sigma=3):
    """
    Filter out outliers based on residuals from the fitted model.

    Parameters:
    -----------
    df : pandas.DataFrame
        DataFrame containing star data with columns 'phot_g_mean_mag', 'phot_logcount',
        and 'phot_logcount_error'.

    gzero_logcount : float
        Logarithm of photometric count corresponding to zero g-band magnitude.

    residuals_threshold_sigma : float, optional
        Threshold in terms of standard deviations for filtering outliers (default is 3).

    Returns:
    --------
    filtered_df : pandas.DataFrame
        DataFrame with outliers removed based on residuals threshold.
    """
    gmags = df['phot_g_mean_mag'].to_numpy()
    phot_logcounts = df['phot_logcount'].to_numpy()
    phot_logcounts_errs = df['phot_logcount_error'].to_numpy()

    # 残差の計算
    residuals, residuals_std, _ = calc_residuals(gmags, phot_logcounts, gzero_logcount)

    # フィッティングの外れ値は変光星の可能性があるため取り除く
    residuals_mask = np.abs(residuals) < residuals_threshold_sigma*residuals_std
    filtered_df = df[residuals_mask]

    if len(df) != len(filtered_df):
        print(f"{inspect.currentframe().f_code.co_name} func:")
        print(f"\tSome stars had outliers based on a residuals threshold of "
              f"{residuals_threshold_sigma} sigma and were removed:")
        print(f"\t\t{len(df)} -----> {len(filtered_df)} stars")
        print()

    return filtered_df

def add_logcounts_and_errors_column(df):
    """
    Add logarithmic counts and their errors to the DataFrame.

    Parameters:
    -----------
    df : pandas.DataFrame
        DataFrame containing columns 'phot_count' and 'phot_error'.

    Returns:
    --------
    df : pandas.DataFrame
        DataFrame with added columns 'phot_logcount' and 'phot_logcount_error'.
    """
    phot_counts = df['phot_count'].to_numpy()
    phot_errs = df['phot_error'].to_numpy()

    phot_logcounts = np.log10(phot_counts)
    phot_logcounts_errs = phot_errs / (phot_counts * np.log(10))

    df.loc[:, 'phot_logcount'] = phot_logcounts
    df.loc[:, 'phot_logcount_error'] = phot_logcounts_errs

    return df

def remove_invalid_logcounts(df, logcount_threshold=2, logcount_err_threshold=1e-10):
    """
    Remove rows with invalid logarithmic counts or errors from the DataFrame.

    Parameters:
    -----------
    df : pandas.DataFrame
        DataFrame containing columns 'phot_logcount' and 'phot_logcount_error'.
    logcount_threshold : float, optional
        Threshold below which logcounts are considered invalid (default is 1).
    logcount_err_threshold : float, optional
        Threshold below which logcount errors are considered invalid (default is 1e-10).

    Returns:
    --------
    filtered_df : pandas.DataFrame
        DataFrame with rows containing NaN, infinite values, or values close to zero in
        'phot_logcount' or 'phot_logcount_error' removed.
    """
    phot_logcounts = df['phot_logcount'].to_numpy()
    phot_logcounts_errs = df['phot_logcount_error'].to_numpy()

    # NaNおよび無限大の値、または指定した閾値未満の値を取り除く
    # 統計が非常に悪い場合誤差が乱れる場合あり。
    # まれにlog(count)誤差がゼロがあり、fitで発散を避けるためフィルタリングする。
    finite_mask = (
        np.isfinite(phot_logcounts) & np.isfinite(phot_logcounts_errs) &
        (phot_logcounts > logcount_threshold) &
        (phot_logcounts_errs > logcount_err_threshold)
    )
    filtered_df = df[finite_mask]

    if len(df) != len(filtered_df):
        print(f"{inspect.currentframe().f_code.co_name} func:")
        print(f"\tSome stars had zero, negative, or near-zero counts or errors and were removed from the photometric stars:")
        print(f"\t\t{len(df)} -----> {len(filtered_df)} stars")
        print()

    return filtered_df

def calc_relative_photometry_using_zeromag(df, gzero_logcount, gzero_logcount_err):
    """
    Calculate relative photometry using zero magnitude reference.

    Parameters:
    -----------
    df : pandas.DataFrame
        DataFrame containing columns 'phot_count' and 'phot_error'.

    gzero_logcount : float
        Logarithm of photometric count corresponding to zero g-band magnitude.

    gzero_logcount_err : float
        Standard error of the logarithm of photometric count at zero g-band magnitude.

    Returns:
    --------
    tgt_gmags : numpy.ndarray
        Array of calculated g-band magnitudes.

    tgt_gmag_errs : numpy.ndarray
        Array of errors for the calculated g-band magnitudes.
    """
    tgt_phot_counts = df['phot_count'].to_numpy()
    tgt_phot_errs = df['phot_error'].to_numpy()

    tgt_gmags = -2.5 * (np.log10(tgt_phot_counts) - gzero_logcount)
    tgt_gmag_errs = 2.5 * np.sqrt((tgt_phot_errs / (tgt_phot_counts * np.log(10)))**2 + gzero_logcount_err**2)

    return tgt_gmags, tgt_gmag_errs

def plot_photometry(ax, df, gzero_logcount, gzero_logcount_err, title):
    gmags = df['phot_g_mean_mag'].to_numpy()
    gmags_errs = df['phot_g_mean_mag_error'].to_numpy()
    phot_logcounts = df['phot_logcount'].to_numpy()
    phot_logcounts_errs = df['phot_logcount_error'].to_numpy()

    # 残差の計算
    residuals, residuals_std, r_squared = calc_residuals(gmags, phot_logcounts, gzero_logcount)

    # フィット結果の関数
    phot_logcounts_preds = linear_func(gzero_logcount, gmags)

    ax.errorbar(gmags, phot_logcounts, xerr=gmags_errs, yerr=phot_logcounts_errs, fmt='o', c='k', ms=3, label=f'data (num={len(phot_logcounts)})')
    ax.plot(gmags, phot_logcounts_preds, c='r', label=rf'y=-0.4x+({gzero_logcount:.2f}$\pm${gzero_logcount_err:.2e}) ($R^2$={r_squared:.2f})')
    ax.fill_between(gmags, phot_logcounts_preds - 3*residuals_std, phot_logcounts_preds + 3*residuals_std, color='r', alpha=0.15, label=f'3 sigma residual interval')
    ax.set_title(title)
    ax.set_xlabel('g magnitude')
    ax.set_ylabel('log (counts)')
    ax.grid()
    ax.legend()


# gゼロマグニチュードの計算
for frame_idx in range(NAXIS3):
    print(f"---------- Start the fit of gmag vs logcount for frame index of {frame_idx} ----------")
    # magとlogcountの取得
    phot_df = phot_dfs[phot_dfs['frame_idx'] == frame_idx].copy()
    phot_df = add_logcounts_and_errors_column(phot_df)

    # フィッティングに有効なlogcountの取得
    # logでスケーリングする時、ゼロ付近のカウント値によるNaNおよび無限大の値が出る可能性に注意
    phot_df = remove_invalid_logcounts(phot_df)

    # 初回フィッティング
    gzero_logcount, gzero_logcount_err = fit_gmag_vs_logcount(phot_df)

    # フィッティングの残差に基づく測光星の選定
    df_inlen = len(phot_df)
    phot_df = filter_outliers_by_residuals(phot_df, gzero_logcount)
    df_outlen = len(phot_df)

    # 再フィット
    if df_inlen == df_outlen:
        re_gzero_logcount = gzero_logcount
        re_gzero_logcount_err = gzero_logcount_err
        print("No re-fitting is done as there are no outliers.")
        print()

        print(f"Fit results:")
        print(f"\tgmag zero logcount = {gzero_logcount:.4f} ± {gzero_logcount_err:.4f}")
        print()
        print()

    else:
        re_gzero_logcount, re_gzero_logcount_err = fit_gmag_vs_logcount(phot_df)
        print(f"Initial fit results:")
        print(f"\tgmag zero logcount = {gzero_logcount:.4f} ± {gzero_logcount_err:.4f}")
        print()

        print(f"Re-fit results:")
        print(f"\tgmag zero logcount = {re_gzero_logcount:.4f} ± {re_gzero_logcount_err:.4f}")
        print()
        print()

    # フィッティング結果を表示するオプション
    show_plot = True

    if show_plot:
        # 表示しすぎ防止のオプション
        show_interval = 60

        if frame_idx % show_interval == 0:
            fig, ax = plt.subplots()
            plot_photometry(
                ax, phot_df, re_gzero_logcount, re_gzero_logcount_err,
                f'PSF Photometry: G Magnitude vs Log(Counts)\n(Frame_idx={frame_idx})'
            )

            # plt.savefig(f'gmag_vs_logcount_{frame_idx}.png')

            plt.show()


    # ターゲット星の測光およびgzeroの結果をDataFrameへの保存
    tgt_df = tgt_dfs[tgt_dfs['frame_idx'] == frame_idx].copy()
    tgt_gmags, tgt_gmag_errs = calc_relative_photometry_using_zeromag(tgt_df, re_gzero_logcount, re_gzero_logcount_err)
    tgt_df.loc[:, 'gmag'] = tgt_gmags
    tgt_df.loc[:, 'gmag_error'] = tgt_gmag_errs
    tgt_df.loc[:, 'gzero_logcount'] = re_gzero_logcount
    tgt_df.loc[:, 'gzero_logcount_error'] = re_gzero_logcount_err

    tgt_dfs = tgt_dfs[tgt_dfs['frame_idx'] != frame_idx]
    tgt_dfs = pd.concat([tgt_dfs, tgt_df])
コードの説明
コードの詳細な説明は、アパーチャー測光に関する別記事で解説しているため、ここでは割愛します。
gバンドマグニチュード vs log(カウント)のグラフとフィットの様子
ここで、フィッティングが正しく動いているかを確認するために、一定間隔おきにフレームを抜き出しグラフに表示します。一つ前のコードで、show_plot = Trueとすると、show_interval置きにフィットした結果が表示されます。
出力結果(show_plot = True、show_interval = 60)
1フレーム目
|
60フレーム目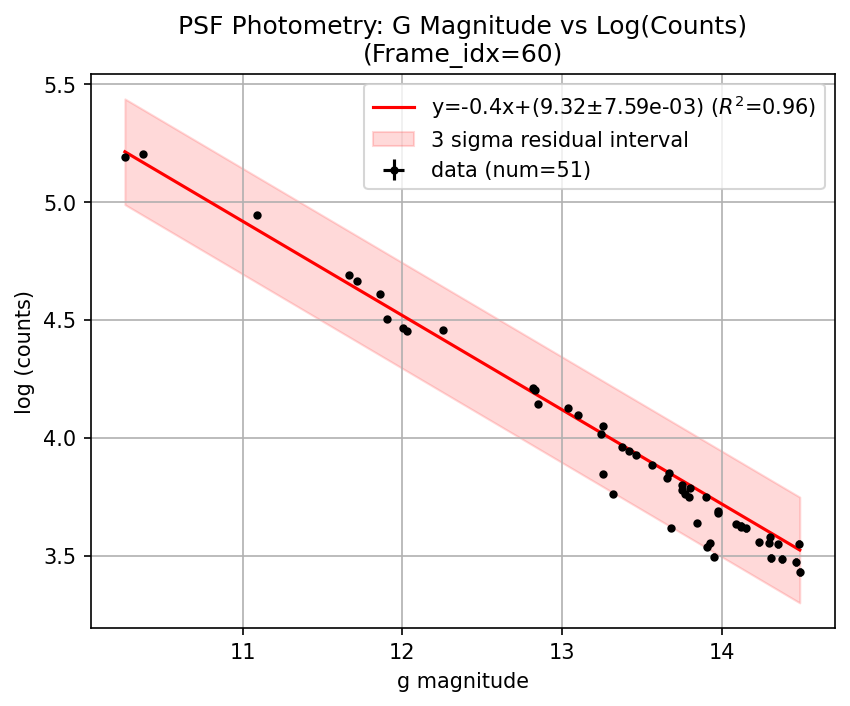
|
120フレーム目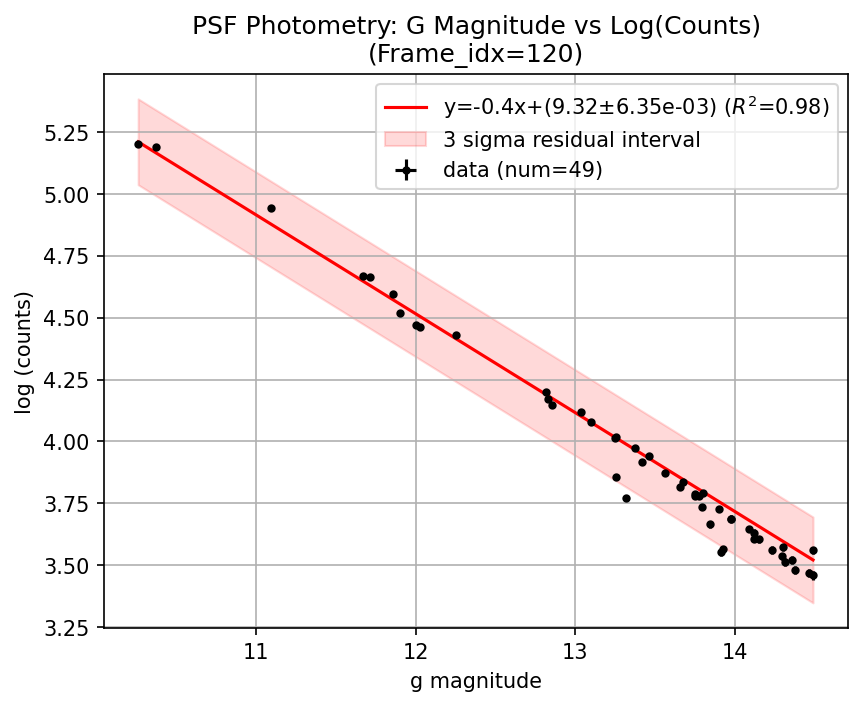
|
180フレーム目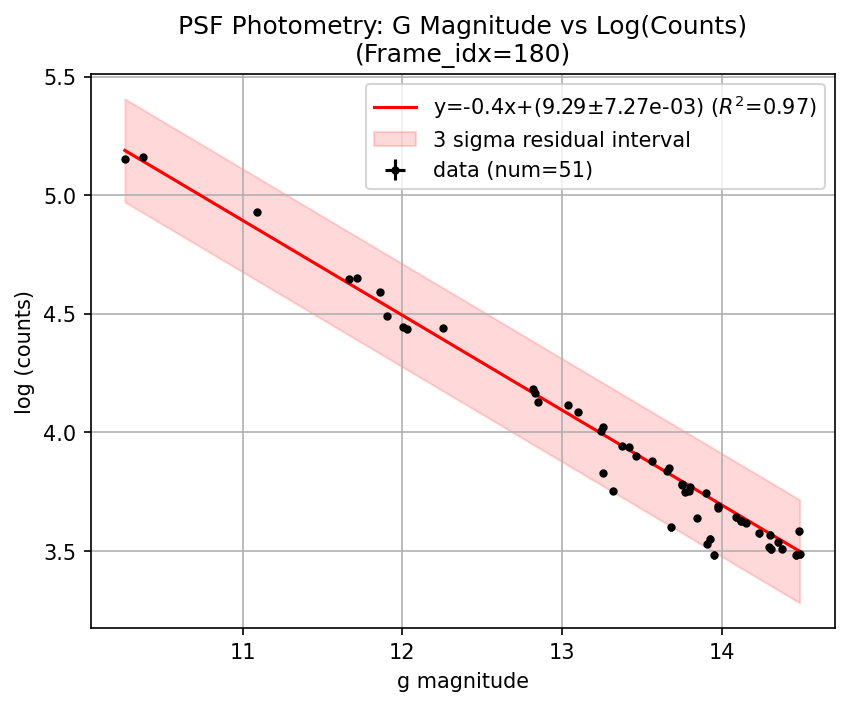
|
上図は60フレーム置きの結果を示しています。フレームごとで多少測光に受かる星や推定パラメータが異なることがわかります。このようにして測光の校正を行い、ターゲット星の光子数から等級を計算します。
補足
PSFフィットでのバックグラウンドとsepモジュールのバックグラウンドの比較
2次元ガウス分布+バックグラウンドでフィットした際のバックグラウンドとsepモジュールによるバックグラウンドの分布を比較することで測光精度を検討することができます。
下図に、それぞれ推定されたバックグラウンドの分布を示しています。
| sepモジュールとPSFフィットで推定するバックグラウンドの違い |
|---|
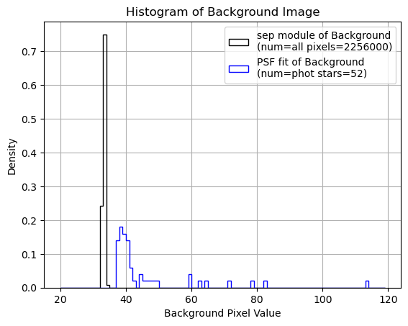 |
sepモジュールはすべての画素値の分布を、PSFフィットでは測光に使用した星の分布を表しています。
両者の分布を比較すると、sepモジュールの方がバックグラウンドの推定値が小さいことがわかります。
この原因として、本解析は短時間測光(2 fps)のため、S/Nが小さくバックグラウンドが過剰に見積もられている可能性があります。また、PSF測光では周辺に多くの星がある場合、パラメータ推定時の領域サイズにも依存します。
そこで、以下にPSFフィット時の領域サイズを変えた際の結果を示します。
| PSF推定サイズにおけるバックグラウンドの違い |
|---|
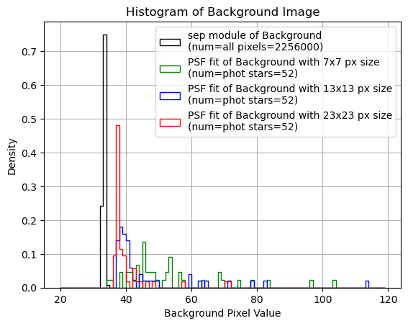 |
このように十分な領域をとらないケースでは、バックグラウンドの分布が異なることがわかります。(本解析では13x13ピクセルを使用していますが、この分布の散らばり度合いなどを参考にし、もう少し大きいサイズを使う方が適切かもしれません。)