はじめに
数日前、facebook researchからHiPlotという、
新しいデータ描画ライブラリが発表されました。
gitのReadMeが簡素だったので、どうかな?と思ったのですが、
実際に使ってみると将来性を感じたので共有します。
特徴
HiPlotはデータの相関やパターンを発見することに特化した描画ツールです。
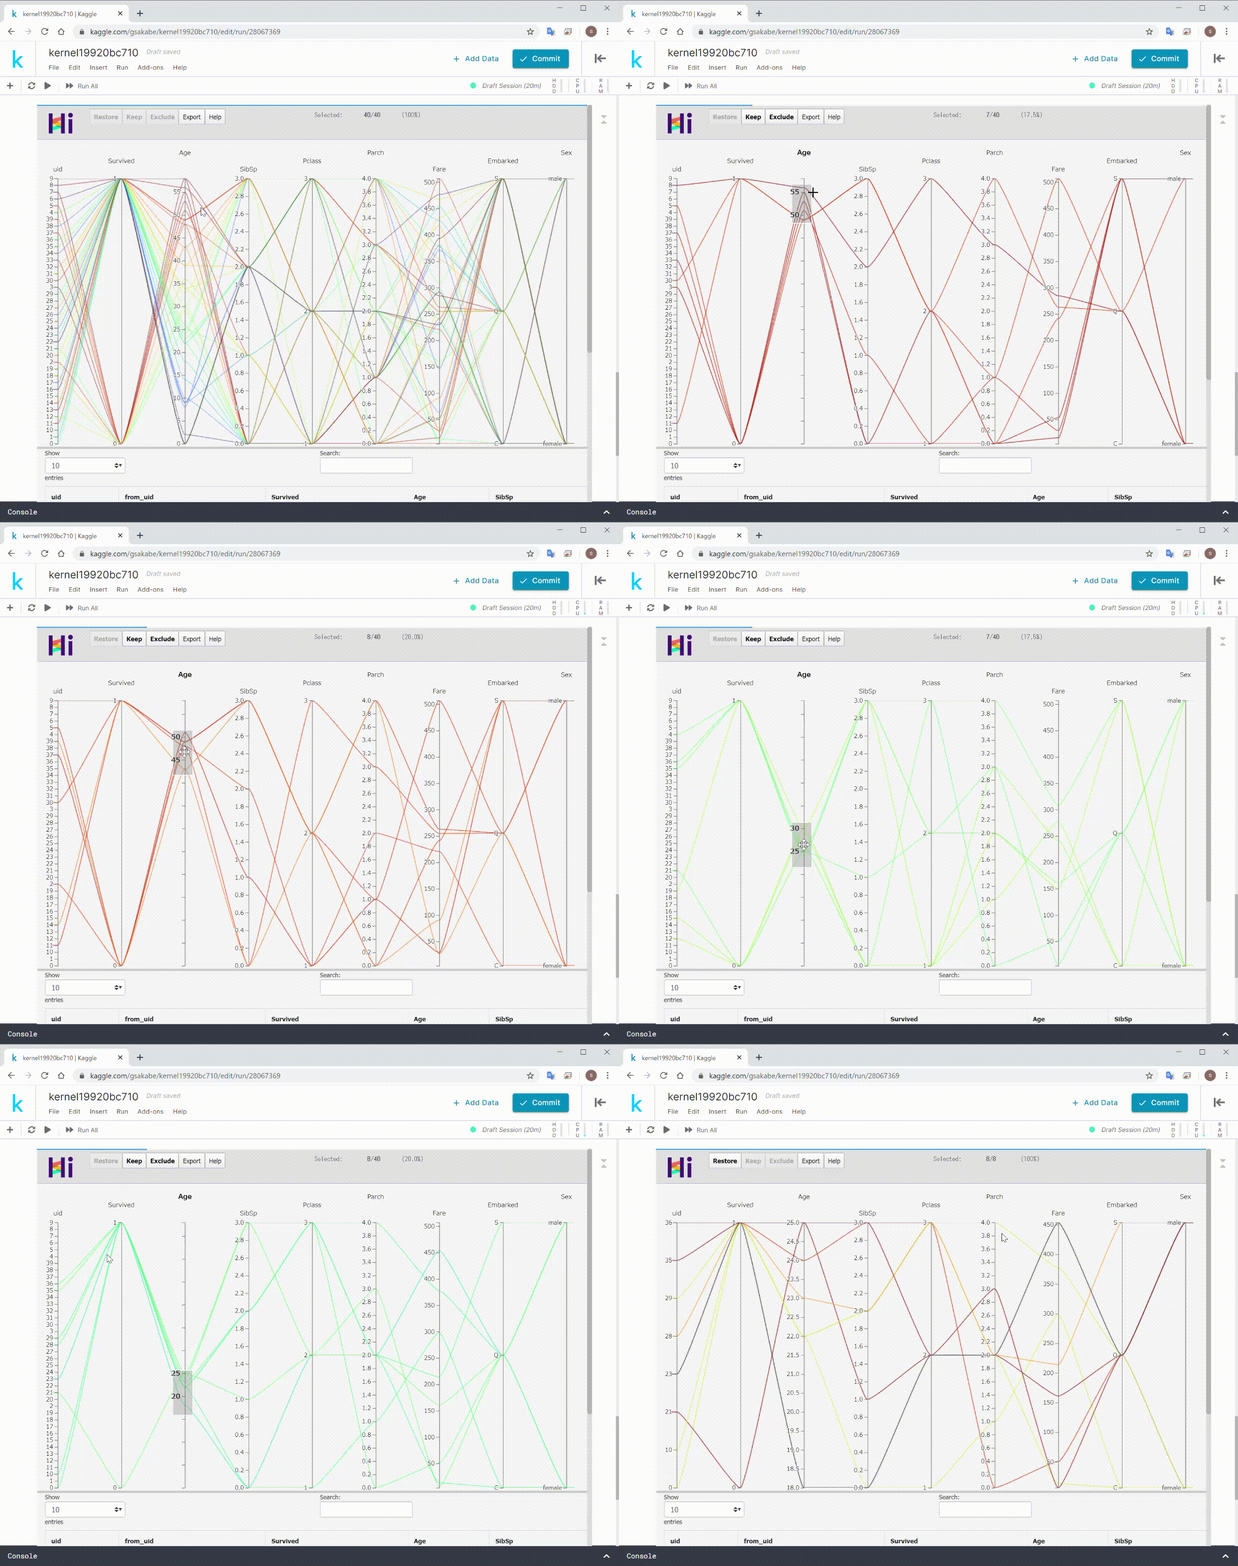
よくわからないと思うので、次の動画を見てください。
このように、データを描画するだけでなく、
インタラクティブにデータの選択、フィルタリング、除外をすることができます。
公式ドキュメントに動かせるサンプルがあるので触ってみてください。
使い方
pipからインストールできます。
pip install hiplot
使い方は、辞書型のデータか、CSVのファイルパスをHiPlotに渡すだけです。
import pandas as pd
import hiplot as hip

# pandas → 辞書 → HiPlot
train = pd.read_csv('../input/titanic/train.csv')

# orient='records'で渡す必要があります。
import_dict = train.to_dict(orient='records')
dict_hip = hip.Experiment.from_iterable(import_dict)
dict_hip.display()

# csvから直接
csv_hip = hip.Experiment.from_csv('../input/titanic/train.csv')
csv_hip.display()
また、作成したグラフは、htmlとして保存することができます。
dict_hip.to_html()
良い点
直観的で使いやすいので、初期のデータ解析だけでなく、
学習時のハイパーパラメータのチューニングなど、いろいろな面で使えると思います。
また、非常に軽量なので、ストレスなく使用できるという点も評価できます。
微妙な点
出たばかりなためか、まだ機能が出そろって無い印象です。
一つ前の動作に戻る、という機能がないのでちょっと面倒です。
終わりに
まだ、出たばかりのツールなので、機能的に不足な印象はありますが、
有用なツールかなと思います。
kaggleでEDAする際は、まずこのライブラリに突っ込んでみてはどうでしょうか。
