この記事はSplunk Advent Calendar 2019、14日目の記事です。
はじめに
saeoshiです。2回目ですw
意外とみんな知らないSAIを使って、Universalforwarderとagent(collectd)を1ライナーでインストールして
簡単にサーバリソースを可視化するぞ!
SAIって・・・?
Splunk App for Infrastructure っていうApp。
Linux/Windows/K8S/Openshift/AWSのリソースを簡単に可視化できて、かつMetrics storeを使うので検索も早いすぐれもの。
Setupめんどくさくね?って思われるけど、実はおちゃのこSAISAIです(錯乱
SplunkにSAIをインストール
https://splunkbase.splunk.com/app/3975/
https://splunkbase.splunk.com/app/4217/
からappをダウンロードして、GUIでUpしましょう。
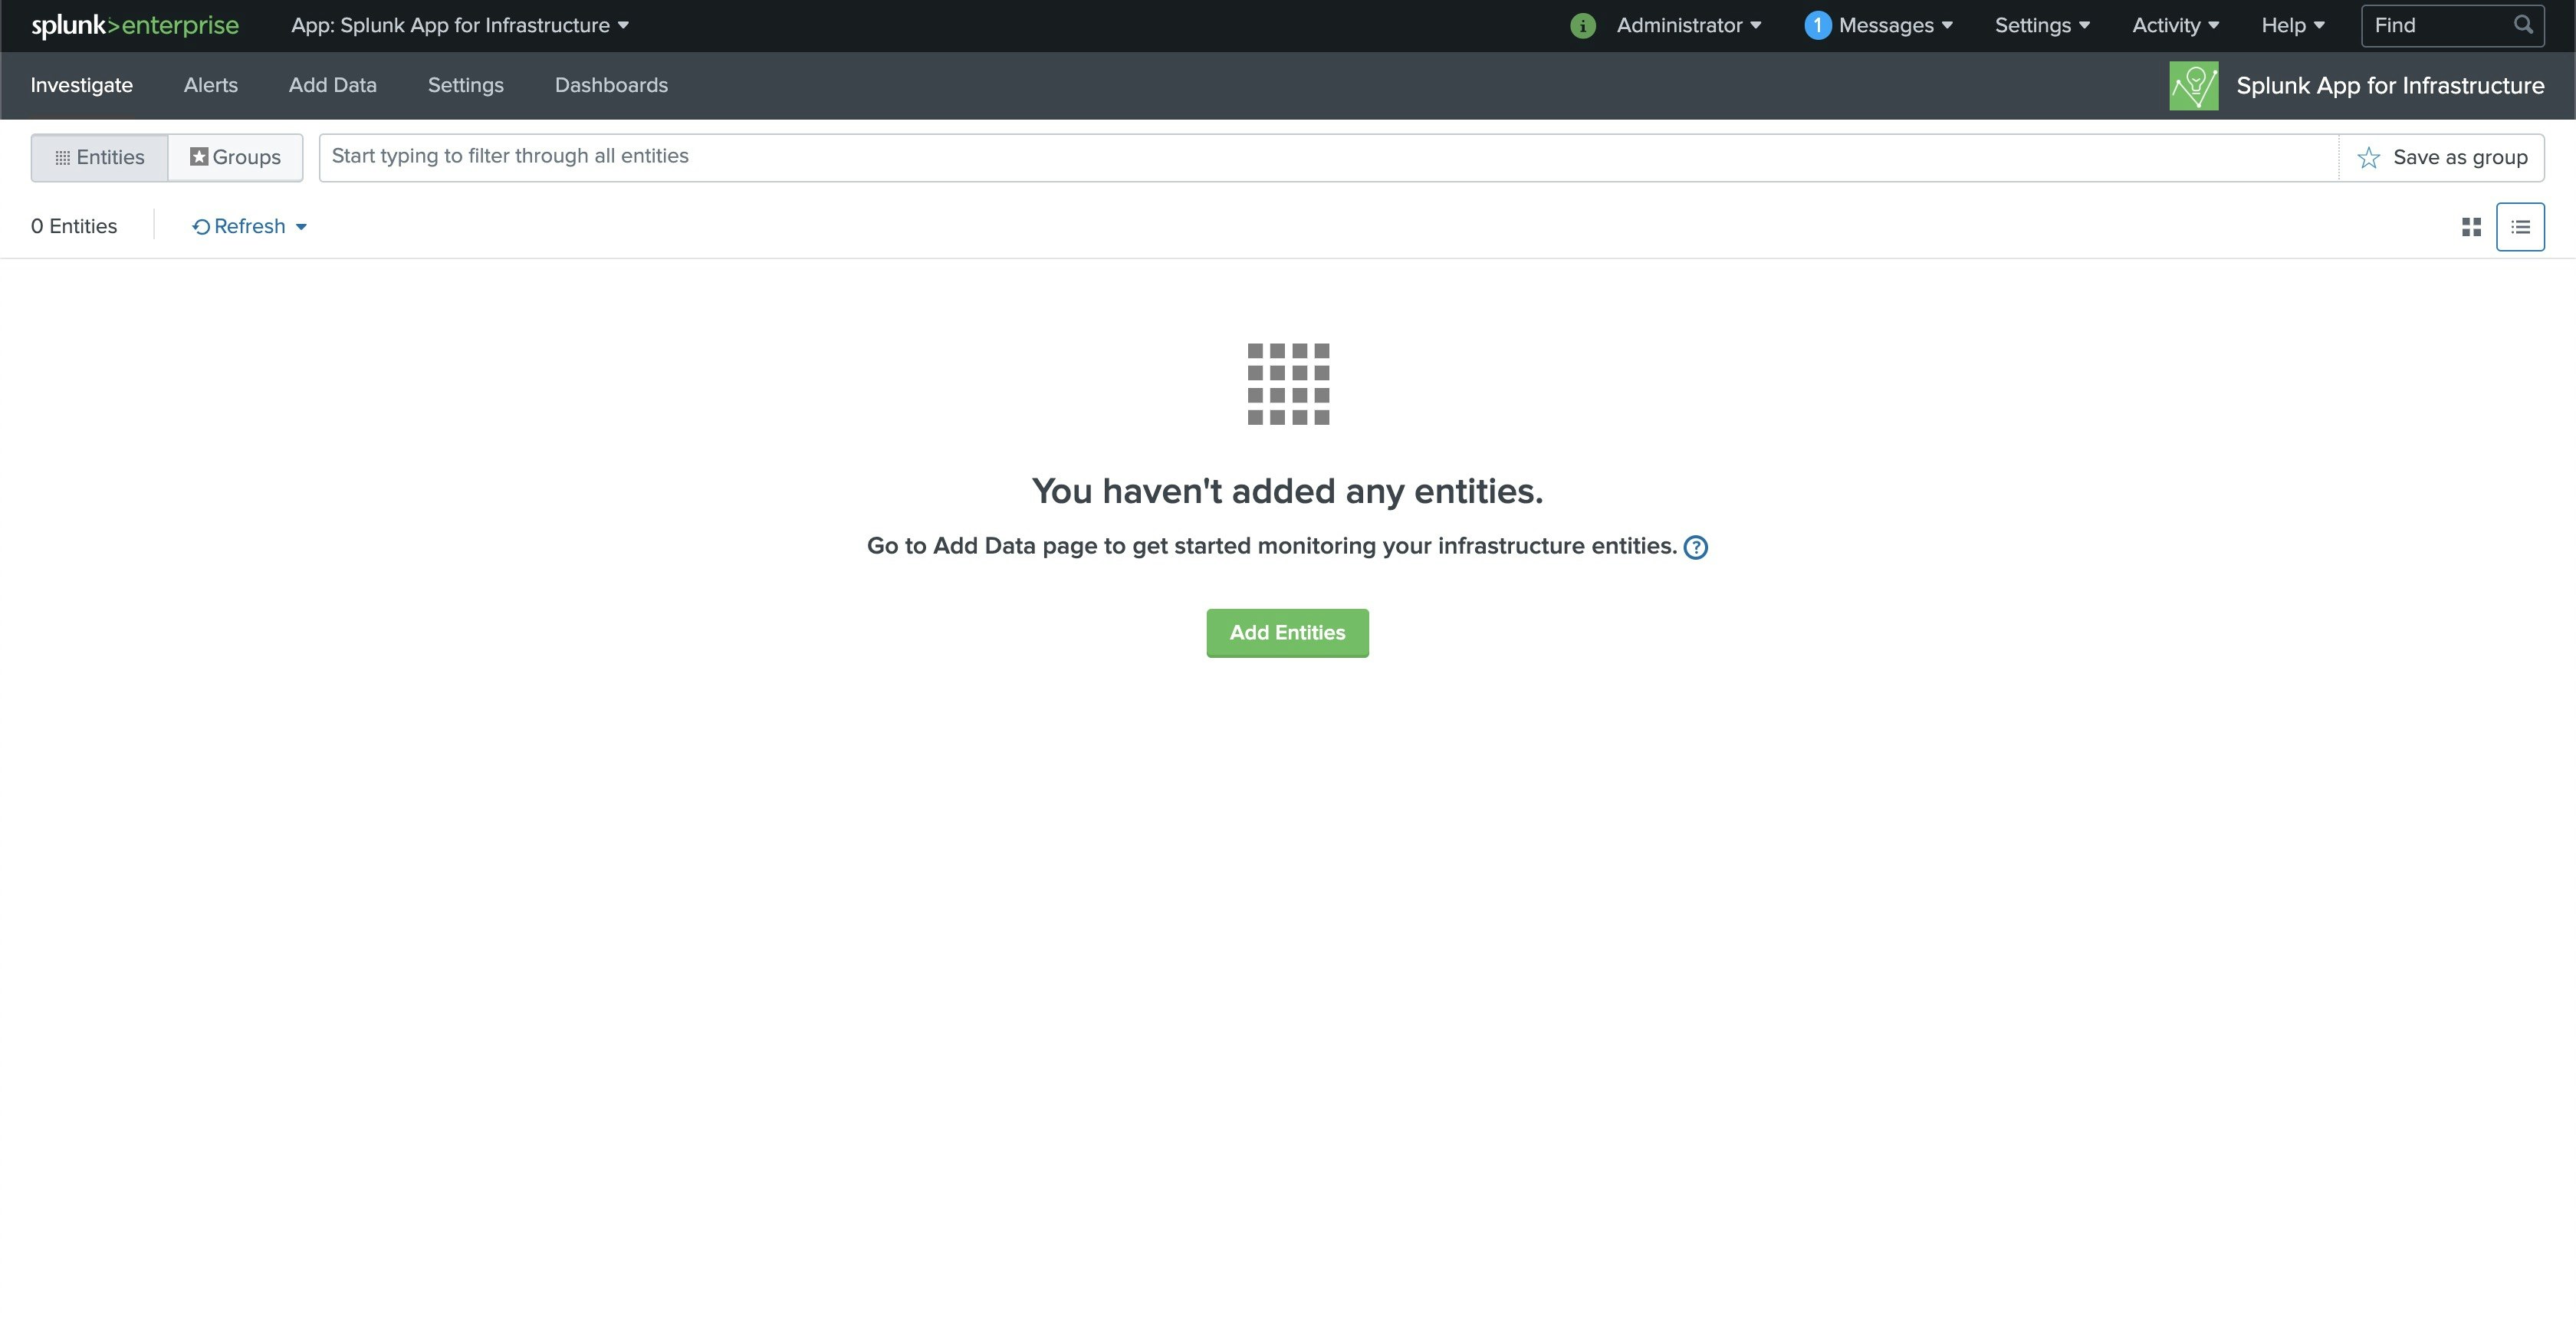
インストールが終わるとこんな画面。
HECの設定をつくる
Metricsを集めるとIndexerに送信するのに、HECが必要なので、Settingしてあげる。
Setting → Data inputsから、HECの設定。
New Tokenを選択して、いい感じに設定。
注意点としては、Metrics Storeを使うので、indexにem_metricsを指定。

もう一回、Data inputの画面に移動して、Global Tokenをenable。

Receive portをOnにしておく。
Settingから、Forwarding and recivingから、Configure reciveingを選択して、9997ポートをenableしておく。
ワンライナーを生成する
SAIのAppに移動して、Add DataからLinuxを選択して、必要項目を埋める!
Monitoring Machineは、SAIが入ってるhostね。

入力が完了すると、下のほうにワンライナーが生成されるんでコピー。
export SPLUNK_URL=172.31.22.100 && export HEC_PORT=8088 && export RECEIVER_PORT=9997 && export INSTALL_LOCATION=/opt/ && export HEC_TOKEN=2ab72fc9-69b9-4644-8879-b1fe679d11b8 && export SAI_ENABLE_DOCKER= && export DIMENSIONS= METRIC_TYPES=cpu,uptime,df,disk,interface,load,memory,processmon METRIC_OPTS=cpu.by_cpu LOG_SOURCES=/etc/collectd/collectd.log%collectd,\$SPLUNK_HOME/var/log/splunk/*.log*%uf,/var/log/syslog%syslog,/var/log/daemon.log%syslog,/var/log/auth.log%syslog AUTHENTICATED_INSTALL=No && wget --no-check-certificate http://172.31.22.100:8000/static/app/splunk_app_infrastructure/unix_agent/unix-agent.tgz && tar -xzf unix-agent.tgz || gunzip -c unix-agent.tgz | tar xvf - && cd unix-agent && bash install_uf.sh && bash install_agent.sh && cd .. && rm -rf unix-agent && rm -rf unix-agent.tgz
クライアント側で実行する
UFとAgentを入れたいサーバにログインして、↑でコピーしたワンライナーを貼り付けると、ufとcollectdが
インストールされる。
root@ip-172-31-20-242:~/unix-agent# export SPLUNK_URL=172.31.22.100 && export HEC_PORT=8088 && export RECEIVER_PORT=9997 && export INSTALL_LOCATION=/opt/  && export HEC_TOKEN=2ab72fc9-69b9-4644-8879-b1fe679d11b8 && export SAI_ENABLE_DOCK$
R=  && export DIMENSIONS= METRIC_TYPES=cpu,uptime,df,disk,interface,load,memory,processmon METRIC_OPTS=cpu.by_cpu LOG_SOURCES=/etc/collectd/collectd.log%collectd,\$SPLUNK_HOME/var/log/splunk/*.log*%uf,/var/log/syslog%syslog,/var/log/daem$
n.log%syslog,/var/log/auth.log%syslog AUTHENTICATED_INSTALL=No && wget --no-check-certificate http://172.31.22.100:8000/static/app/splunk_app_infrastructure/unix_agent/unix-agent.tgz && tar -xzf unix-agent.tgz || gunzip -c unix-agent.tgz
| tar xvf - && cd unix-agent && bash install_uf.sh && bash install_agent.sh && cd .. && rm -rf unix-agent && rm -rf unix-agent.tgz
--2019-12-12 02:17:16--  http://172.31.22.100:8000/static/app/splunk_app_infrastructure/unix_agent/unix-agent.tgz
Connecting to 172.31.22.100:8000... connected.
HTTP request sent, awaiting response... 303 See Other
Location: http://172.31.22.100:8000/en-US/static/app/splunk_app_infrastructure/unix_agent/unix-agent.tgz [following]
--2019-12-12 02:17:16--  http://172.31.22.100:8000/en-US/static/app/splunk_app_infrastructure/unix_agent/unix-agent.tgz
Reusing existing connection to 172.31.22.100:8000.
HTTP request sent, awaiting response... 200 OK
Length: 234122 (229K) [text/plain]
Saving to: 'unix-agent.tgz'

unix-agent.tgz                                              100%[=========================================================================================================================================>] 228.63K  --.-KB/s    in 0.002s


・
・
・
done.
done.

 Installing any missing dependency...

Reading package lists... Done
Building dependency tree
Reading state information... Done
0 upgraded, 0 newly installed, 0 to remove and 61 not upgraded.

 Step:Configure agent...

root@ip-172-31-20-242:~/unix-agent#
SAIの画面で確認
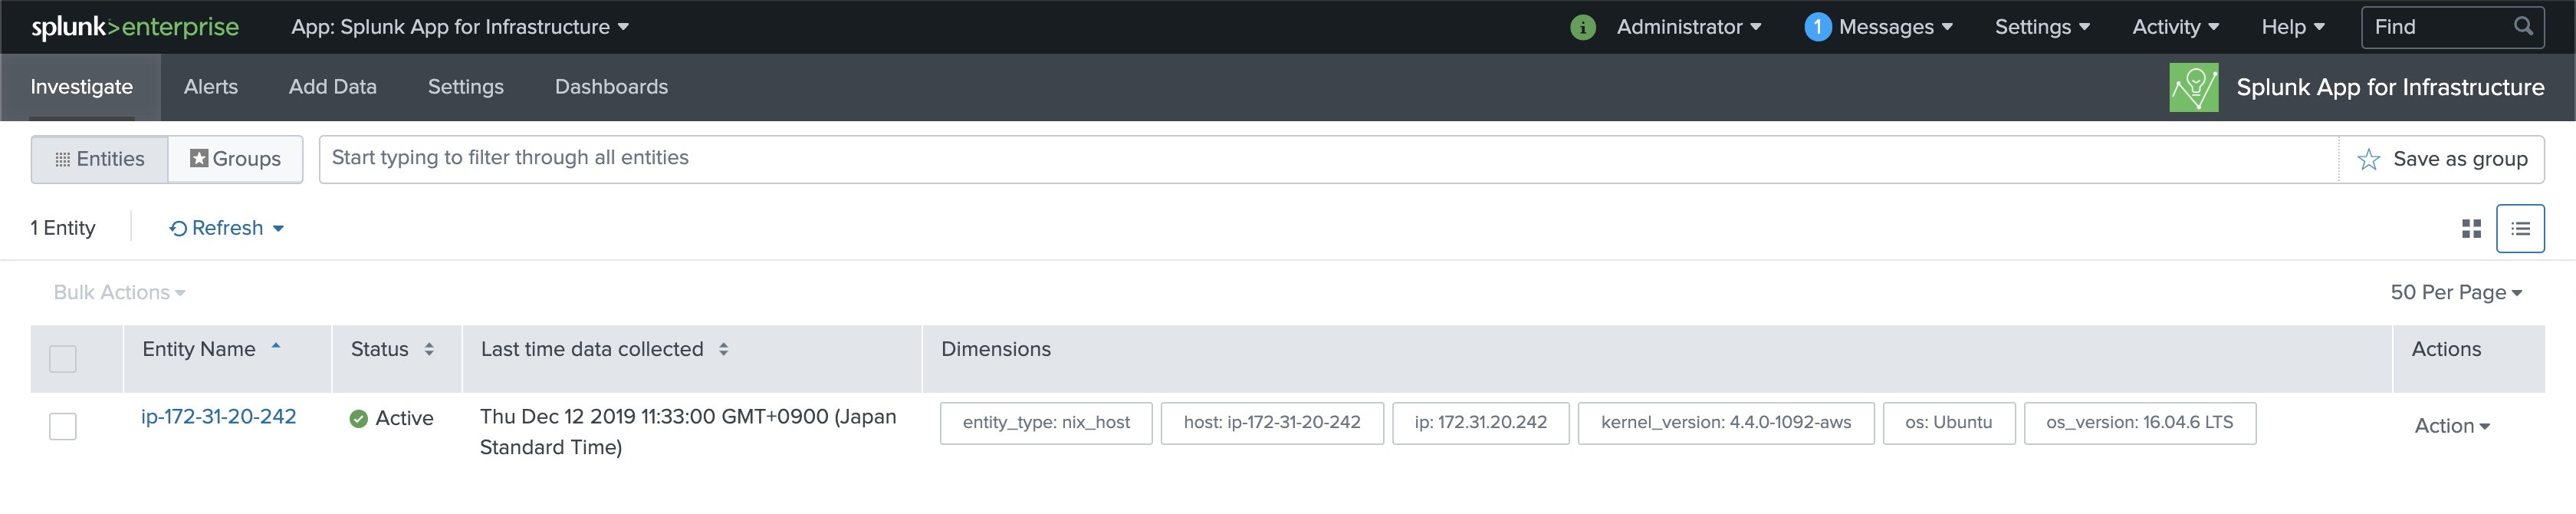
5分くらいすると、entityが登録された!ってこんな感じででてくる。

Metricsを見ていく
Investigateタブをみると、登録したhostがこんな感じで表示されてくる。
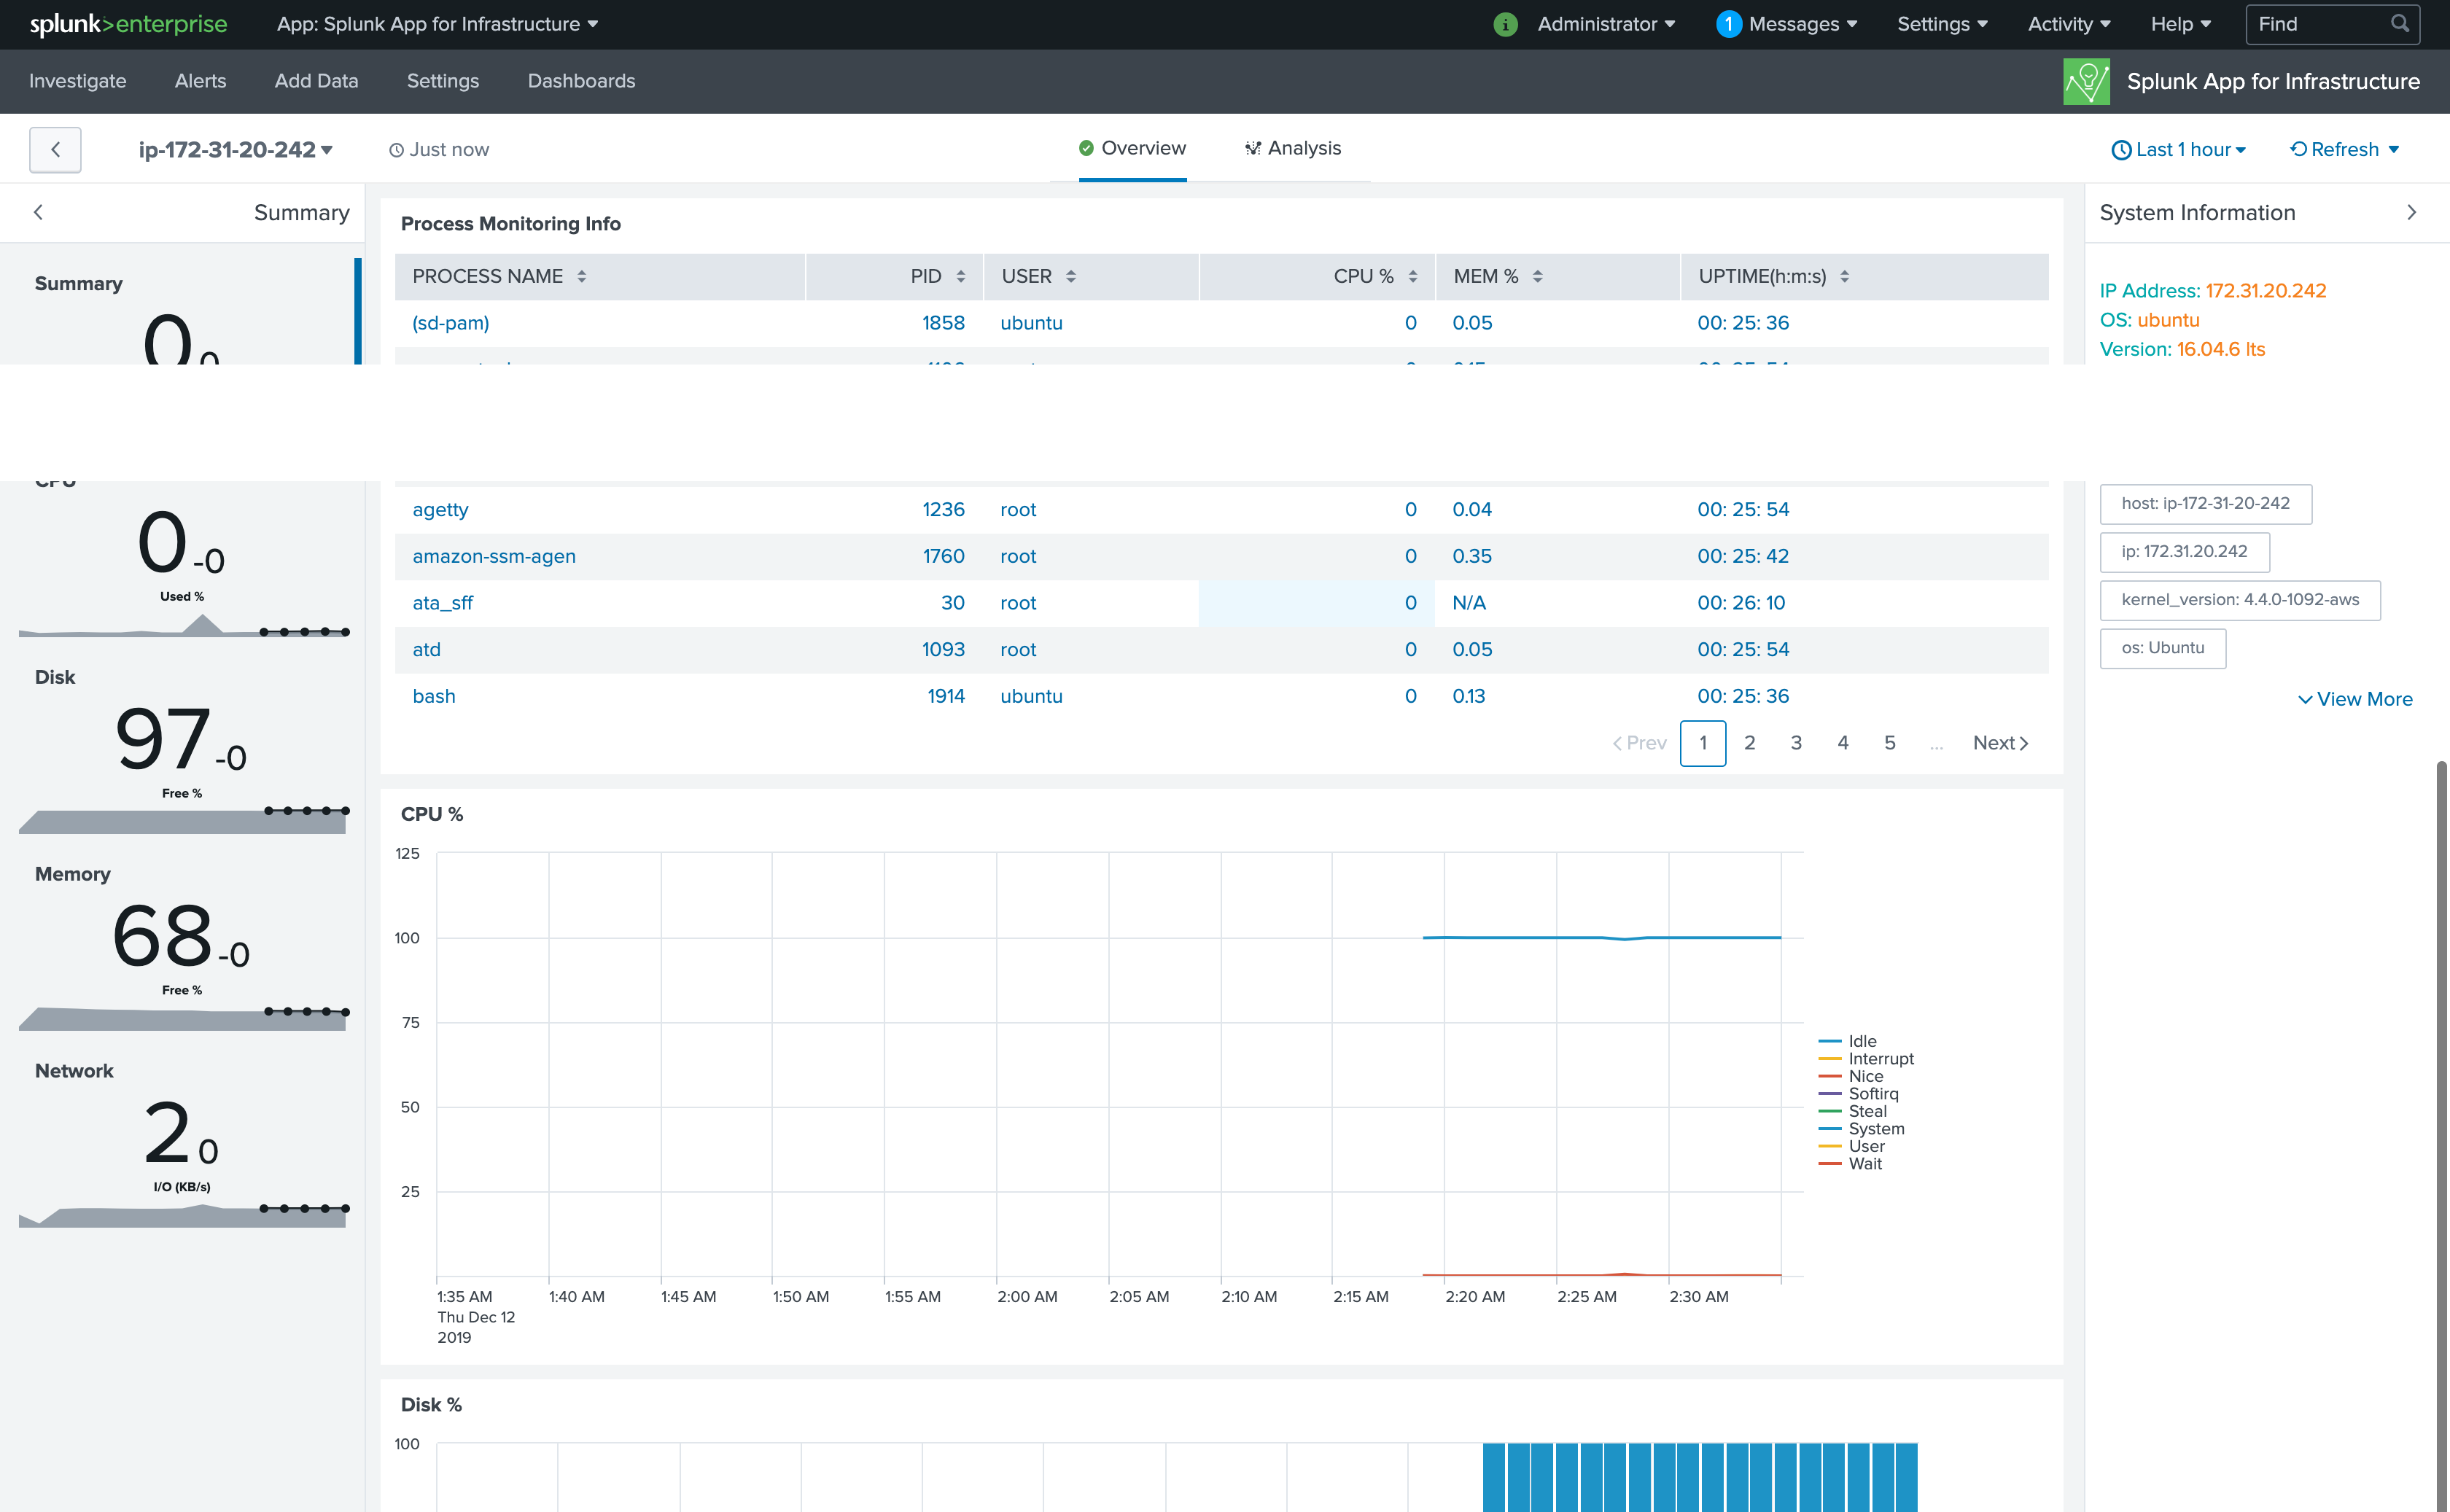
Entity NameのIPをクリックすると、対象hostのoverviewが表示される。
CPU、Memory、プロセスの状態なんかが出てくる。
Analyticsタブを開くと、それぞれのMetricsのDrilldownができる。

左側のMetricsタブで必要なMetricsを選択して、右側のAggregationでAvg,Sum/Split/timeshiftとか選択できる。


hostをグルーピングしてみる
investigateの画面で、表示されたhostたちをグルーピングしてみる。
今回はOSで絞って、ubuntuグループを作る。WEBサーバとかでグルーピングできるようになる!
上のバーにos: ubuntuと入力して、save as groupボタンを押す。

グループから対象グループを選択すると、こんな感じでgroupごとのリソースを可視化できる。

Alertもセットしてみる
表示されてるメトリクスの・・・ボタンをクリックすると、こんな感じでalertを作成するっていうダイアログがでるので
クリックしてみると

閾値・通知方法を設定するようにでてくるので、設定しておわり!簡単!

おわりに
こんな感じで簡単にMetricsを収集できるので、splunkでログ分析しつつ、metricsを見てっていうフローが使えるのではと思いました。
設定もcollectdベースなので、etc/collectdの設定を修正すればいけるっすね〜
そんな感じで!今年もお疲れっす!