Prometheus(プロメテウス)
背景
それっぽい監視グラフをマウス操作メインでみたい人向けの記事
監視設計などについて触れていない。
Prometheusとは
オープンソースのサービス監視システムと時系列データベース。所謂監視ツールです。
開発言語は Go。
Prometheus は一般的な監視ツールのように、データの収集、数値の表示、グラフの表示、アラートを出す機能があります。それだけでなく、Prometheus は独自のデータモデルを持ち、クエリ言語を使って時系列データの評価やグラフ化を行えます。
アーキテクチャ
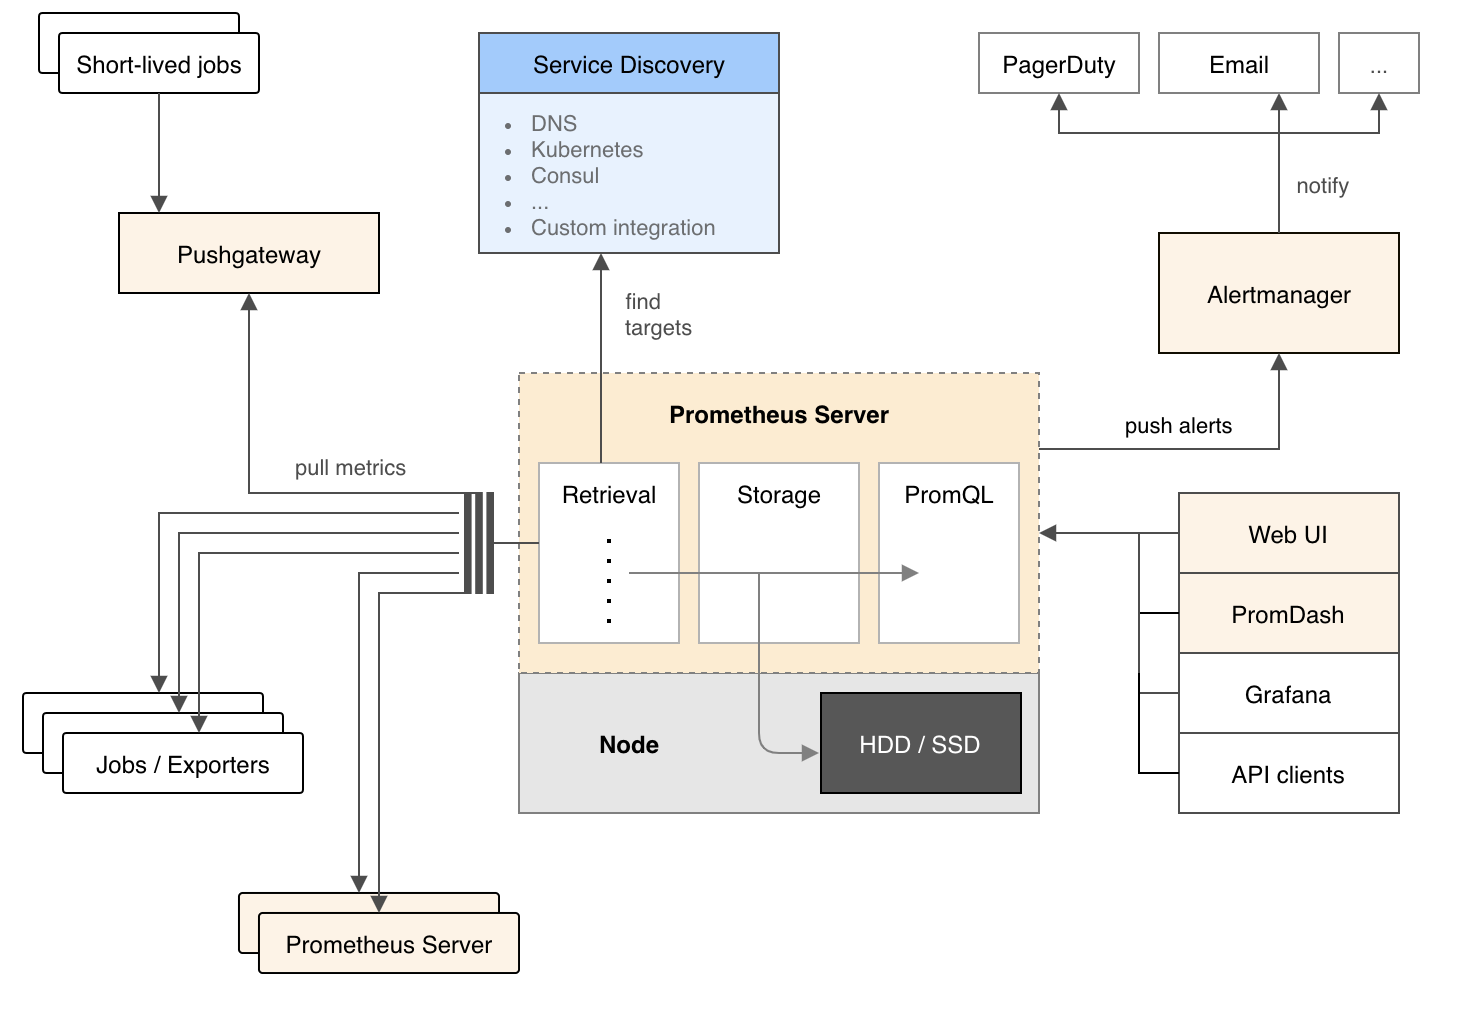
公式に詳しい図があります。
データは左から取得し、真ん中で処理、右側からのクエリに答えて時系列データを返します。といった流れです。
ユーザ通知は細かく設定可能でデータ量などで通知を行っています。
環境
とりあえず動作確認
プロメテウスのDockerイメージは公開されているのでそちらを使わせていただきます。
prom/prometheus
実行前にプロメテウス用のyamlを書きます。
以下は自分自身を監視対象としたyamlの例です。
内容は公式にあるものをそのまま利用しています。
https://prometheus.io/docs/prometheus/latest/getting_started/
global:
  scrape_interval:     15s # By default, scrape targets every 15 seconds.

  # Attach these labels to any time series or alerts when communicating with
  # external systems (federation, remote storage, Alertmanager).
  external_labels:
    monitor: 'codelab-monitor'

# A scrape configuration containing exactly one endpoint to scrape:
# Here it's Prometheus itself.
scrape_configs:
  # The job name is added as a label `job=<job_name>` to any timeseries scraped from this config.
  - job_name: 'prometheus'

    # Override the global default and scrape targets from this job every 5 seconds.
    scrape_interval: 5s

    static_configs:
      - targets: ['localhost:9090']
上記のymalをコンテナ内へ配置するようコンテナを起動
これだけでPrometheusの起動は完了です。
$ docker run -d -p 9090:9090 -v prometheus.yml:/etc/prometheus/prometheus.yml prom/prometheus
http://hostIP:9090 へアクセスするだけで動作を確認できる。

grafanaと連携
version: '2'
services:
  prometheus:
    image: prom/prometheus
    volumes:
      - ./prometheus.yml:/etc/prometheus/prometheus.yml
    ports:
      - '9090:9090'
  grafana:
    image: grafana/grafana
    ports:
      - "3000:3000"
上記を作成してdocker-compose up -dすれば起動する。
あとは```http://hostIP:3000`へアクセスすればGrafnaへ繋がる。
デフォルトのID/PWは admin/adminです。
初回ログイン時はパスワードの再設定を促されるので設定してください
ログイン成功画面
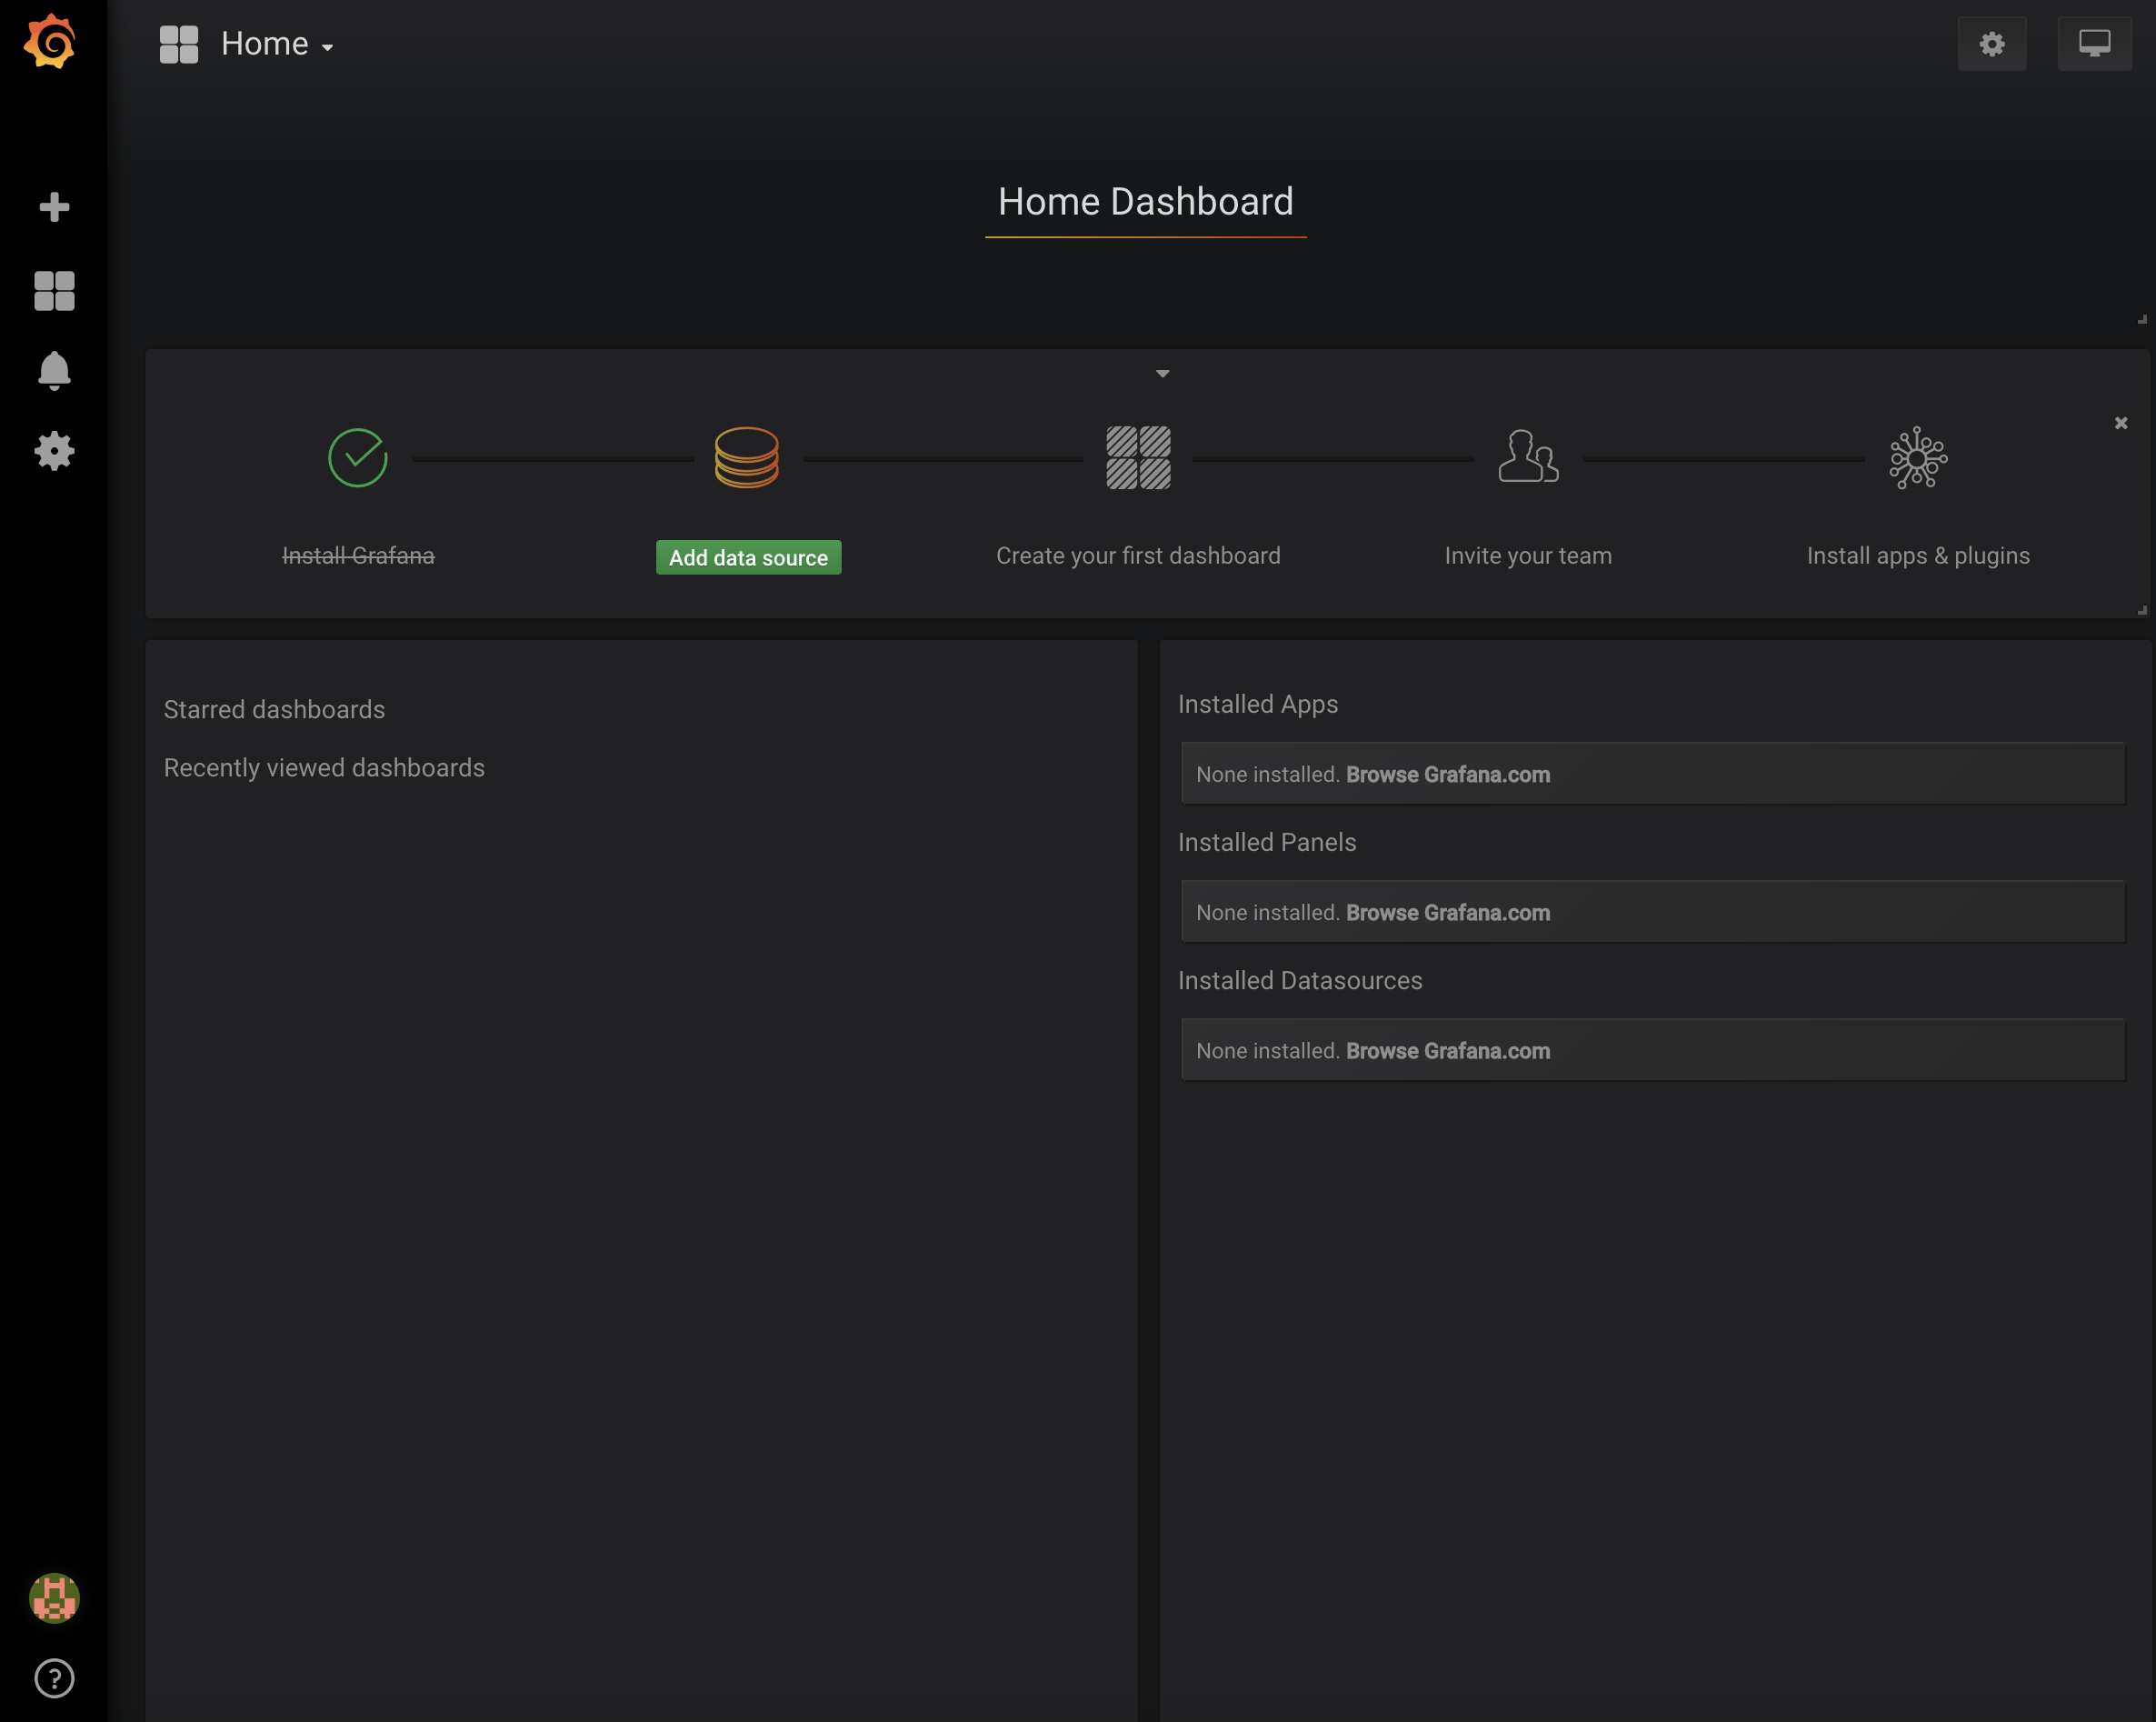
このままだと何もデータを見れません。
データリソースの追加を選択肢必要な情報を入力してください。
ポート番号はdocker-compose.ymlで設定したポート番号を選択してください。
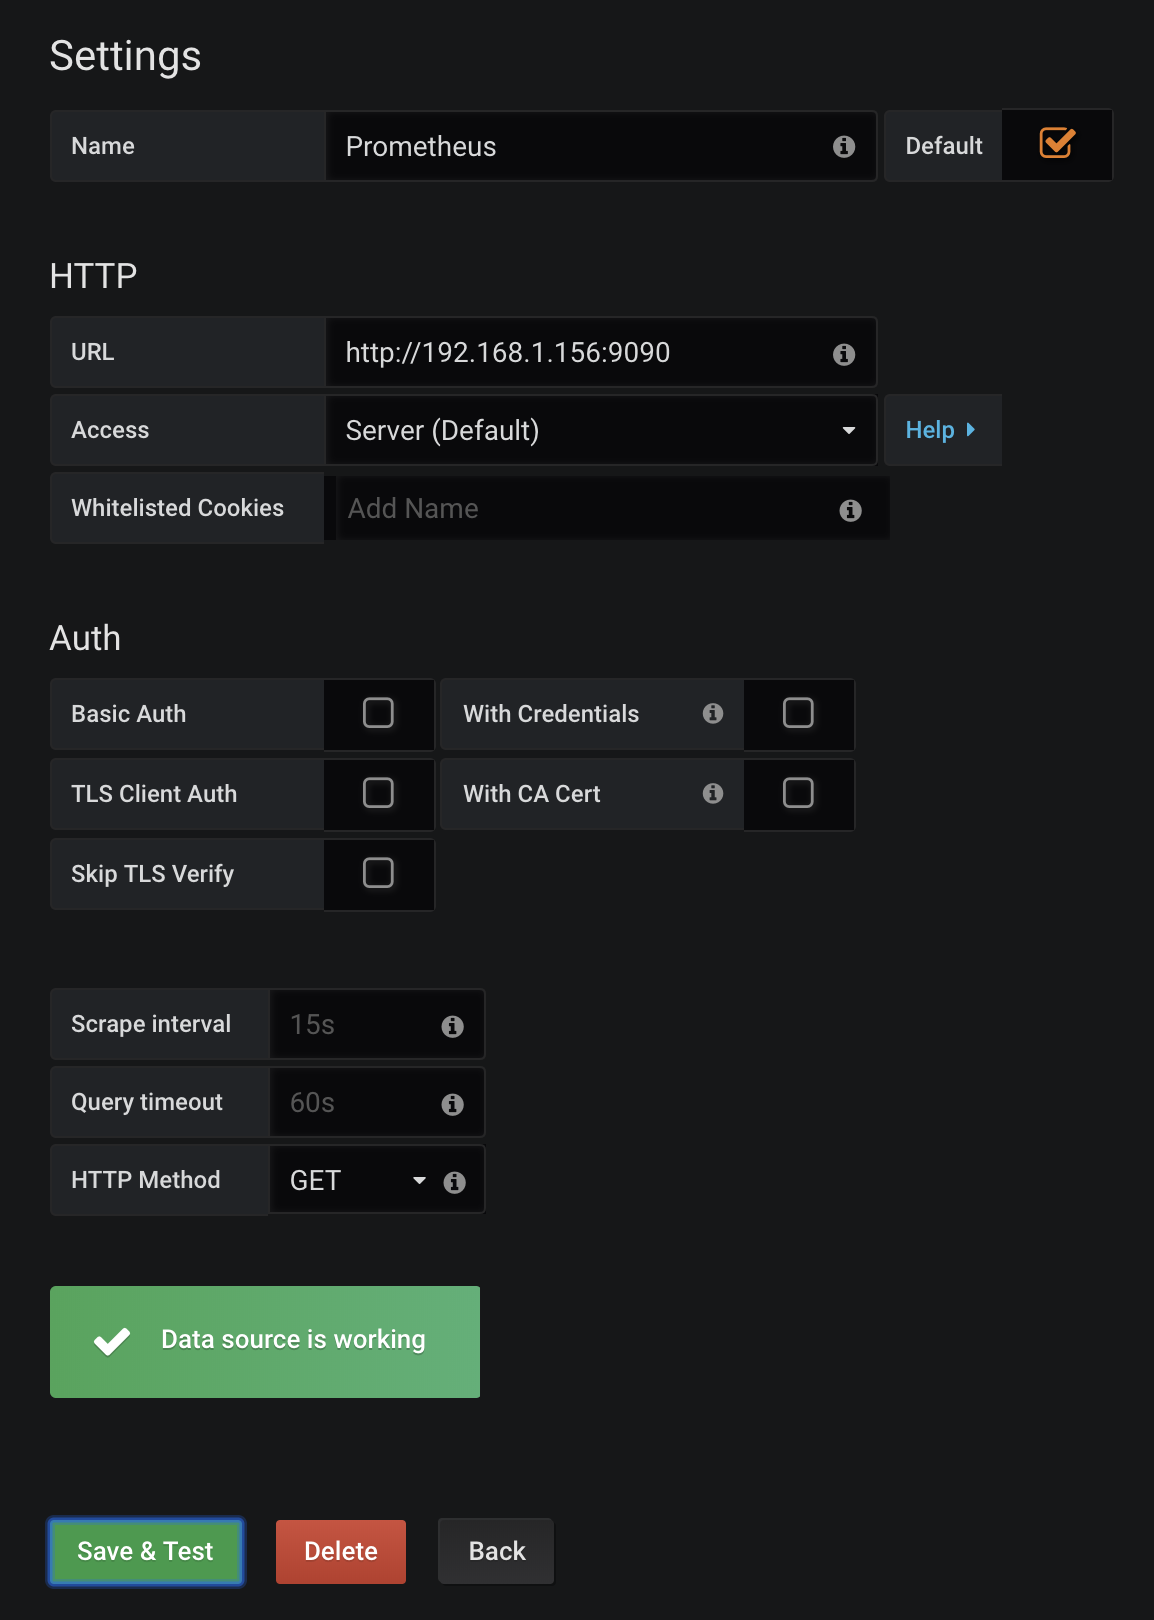
あとはクエリを書くだけでデータの可視化を楽しむことができます。
可視化では下記の記事がわかりやすくおすすめです。
Grafanaでかっけぇダッシュボード作るよ!(構築・設定編)
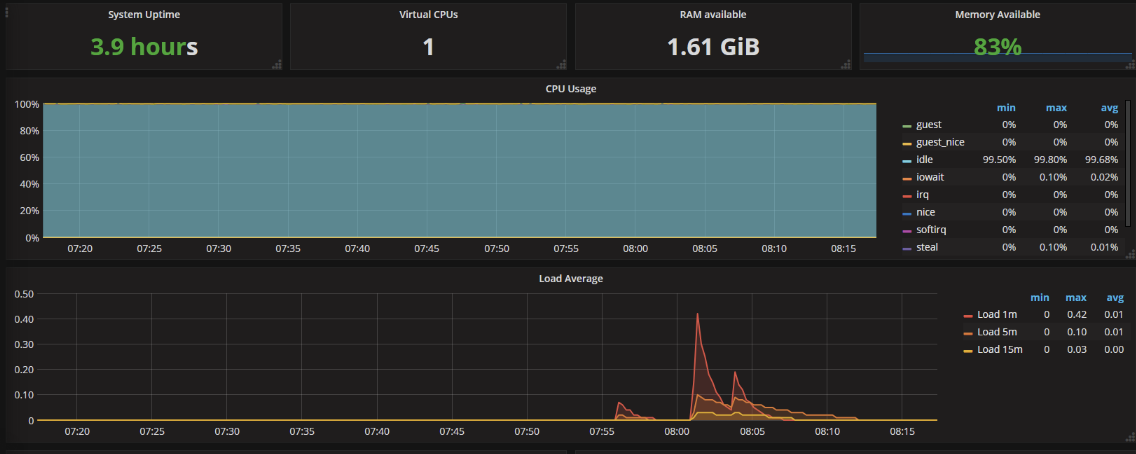
ここで色々使うと以下のようになります。
設定に関してもほとんどマウスでポチポチするだけでそれっぽい可視化ができる。
クエリについても単純でちょっとした下調べをすればすぐに書けると思う。(今回はネットにあるものをコピペしただけ)
まとめ
Promtheus自体を動かすのは非常に簡単だ。だがそこからデータの活用だったり収集/整形などはまた別に学習が必要そうだと感じた。top や dstat を使う方法でメトリクスを収集するのがほとんどであるがそれ以外の素晴らしい方法を一切知らなかったのでこれを機会に実務へ提案して取り入れて行きたい。
監視ツールとしての Zabbix や Sensu、Nagios、Munin 等とは監視の対象や目的が別路線ではあるのですでに運用で使っているものとは別の考え方が必要でそれぞれとは併用が必要そう。(完全移行の方法もあったりスルとしても使い慣れたって意味だと移行は躊躇う。。。)
監視設計については別途見ていく必要がある。
参考リンク
https://knowledge.sakura.ad.jp/12058/
http://blog.serverworks.co.jp/tech/2016/03/11/play-with-grafana-1/
https://qiita.com/sugitak/items/ff8f5ad845283c5915d2
https://www.slideshare.net/ssuser88ff5b/prometheus-79183671
