はじめに
Chrome User Experience Report は、Google が提供している UX やパフォーマンスを確認するためのツールです。
各指標を確認するためには、以下のツールを使います。
CrUX Dashboard
様々な関数を使って、データソースを作成し、そのデータを元にレポートを作成することができます。
多くの機能を提供している分、使い方が少し複雑ですが、より詳細に見やすいレポートを作成したいときには、便利に使えます。
使い方
-
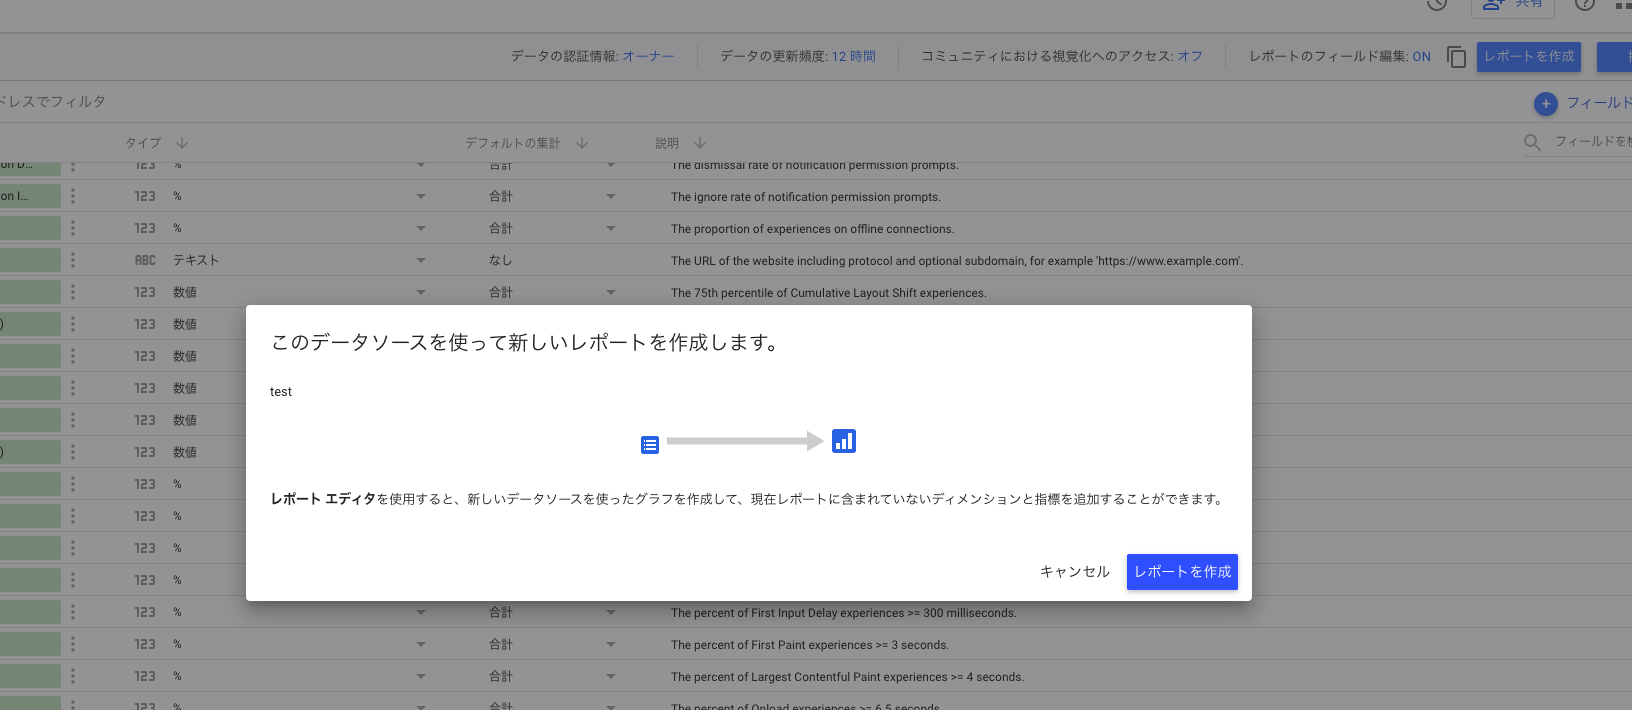
https://datastudio.google.com/u/0/datasources/create から「Chrome UX Report」を検索して、接続します。
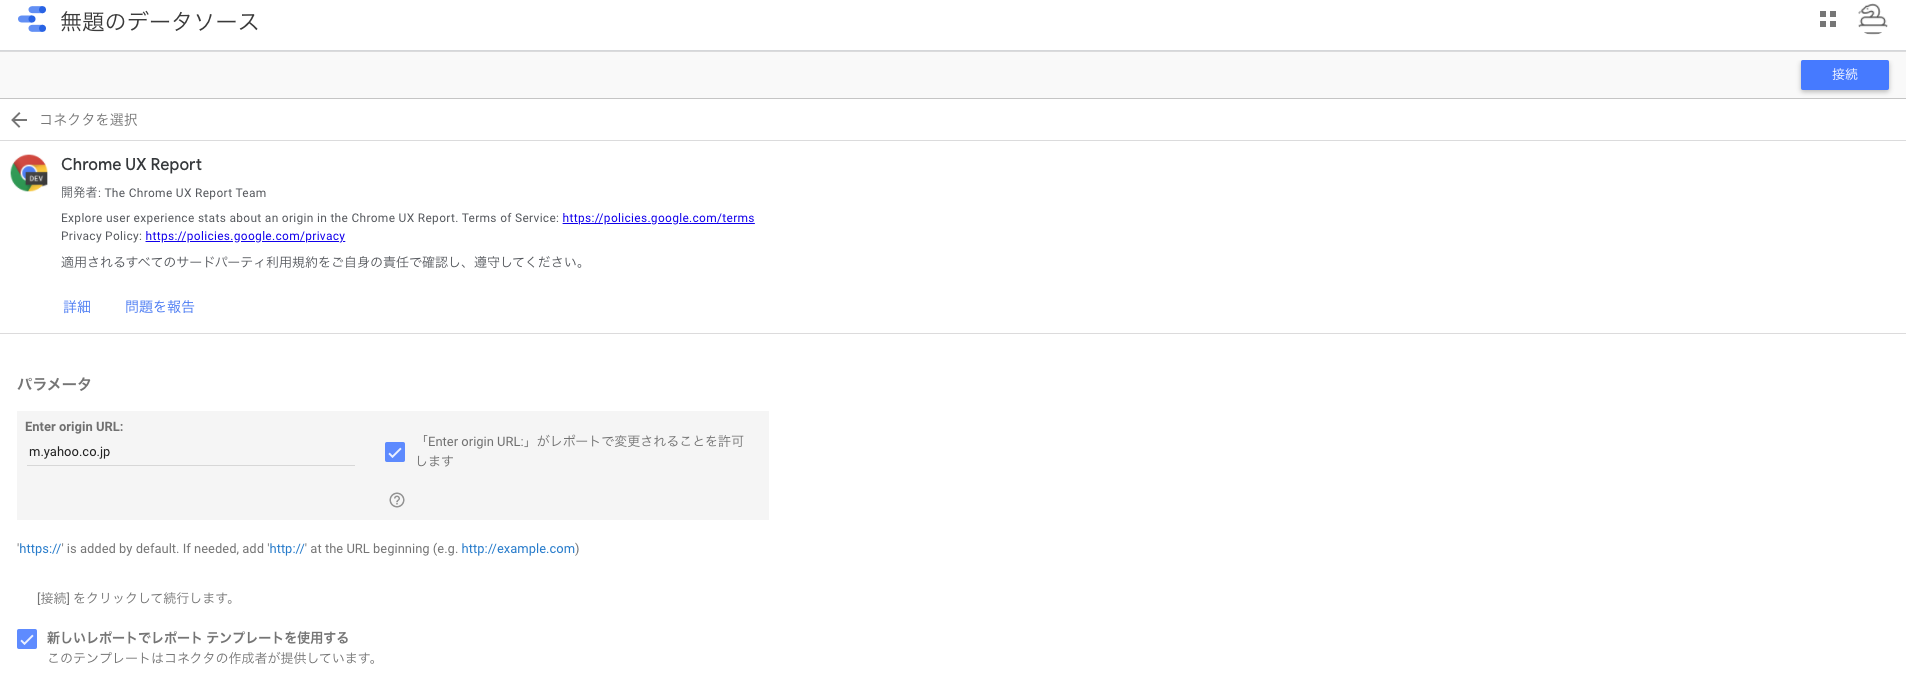
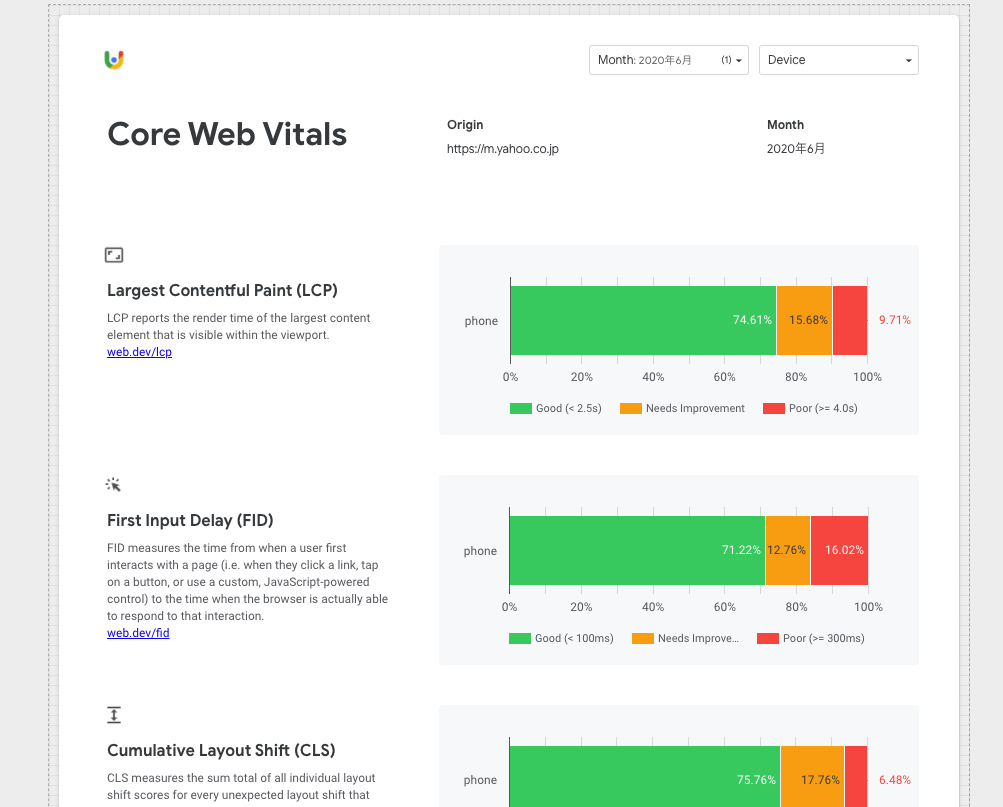
ここでは、初期設定のままのレポートを表示するところまでの手順を紹介しましたが、データソースは自分で自由にカスタマイズでき、レポートのレイアウトや表示するデータも自分で編集できるので、見たいデータだけレポートとして表示させると良いと思います。
Google BigQuery
SQL に馴染みのあるエンジニアであれば、手軽に使用することができます。
しかし、1ヶ月1TBまでのクエリデータでないと無料の枠から出るので、ご注意ください。
使い方
-
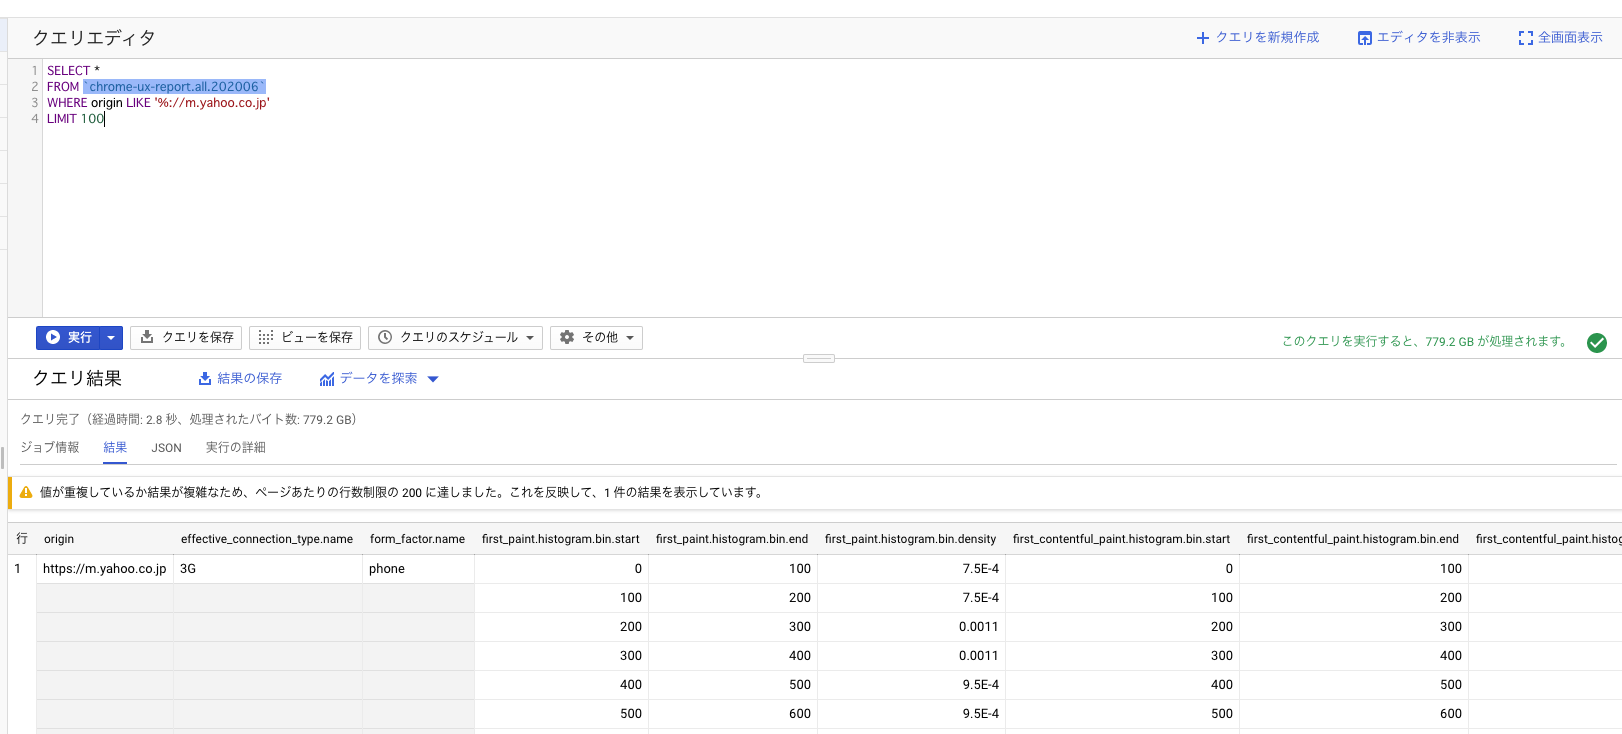
GCP のプロジェクトを作成した後、Google BigQuery で編集画面を開きます
-
SQL を使ってクエリを入力します
例SELECT * FROM `chrome-ux-report.all.202006` WHERE origin LIKE '%://m.yahoo.co.jp' LIMIT 100
主要なカラム
| カラム名 | 説明 |
|---|---|
| origin | アクセス先のオリジンURL |
| effective_connection_type.name | slow-2g, 2g, 3g, 4g, offline の接続回線の種類 |
| form_factor.name | phone、tablet desktop デバイスの種類 |
| first_contentful_paint.histogram.bin.start | First Contentful Paint の開始時間 |
| first_contentful_paint.histogram.bin.end | First Contentful Paint の終了時間 |
| first_contentful_paint.histogram.bin.density | 開始-終了が同一のデータの全体に対する割合 |
| largest_contentful_paint.histogram.bin.start | Largest Contentful Pain の開始時間 |
| largest_contentful_paint.histogram.bin.end | Largest Contentful Pain の終了時間 |
| largest_contentful_paint.histogram.bin.density | 開始-終了が同一のデータの全体に対する割合 |
| first_input.delay.histogram.bin.start | First Input Delay の開始時間 |
| first_input.delay.histogram.bin.end | First Input Delay の終了時間 |
| first_input.delay.histogram.bin.density | 開始-終了が同一のデータの全体に対する割合 |
| dom_content_loaded.histogram.bin.start | Dom Content Loaded の開始時間 |
| dom_content_loaded.histogram.bin.end | Dom Content Loaded の終了時間 |
| dom_content_loaded.histogram.bin.density | |
| first_paint.histogram.bin.start | First Paint の開始時間 |
| first_paint.histogram.bin.end | First Paint の終了時間 |
| first_paint.histogram.bin.density | 開始-終了が同一のデータの全体に対する割合 |
| onload.histogram.bin.start | OnLoad の開始時間 |
| onload.histogram.bin.end | OnLoad の終了時間 |
| onload.histogram.bin.density | 開始-終了が同一のデータの全体に対する割合 |
Largest Contentful Paint, First Input Delay については、 Core Web Vitals を見て、サイトを最適化しよう!を参照ください。
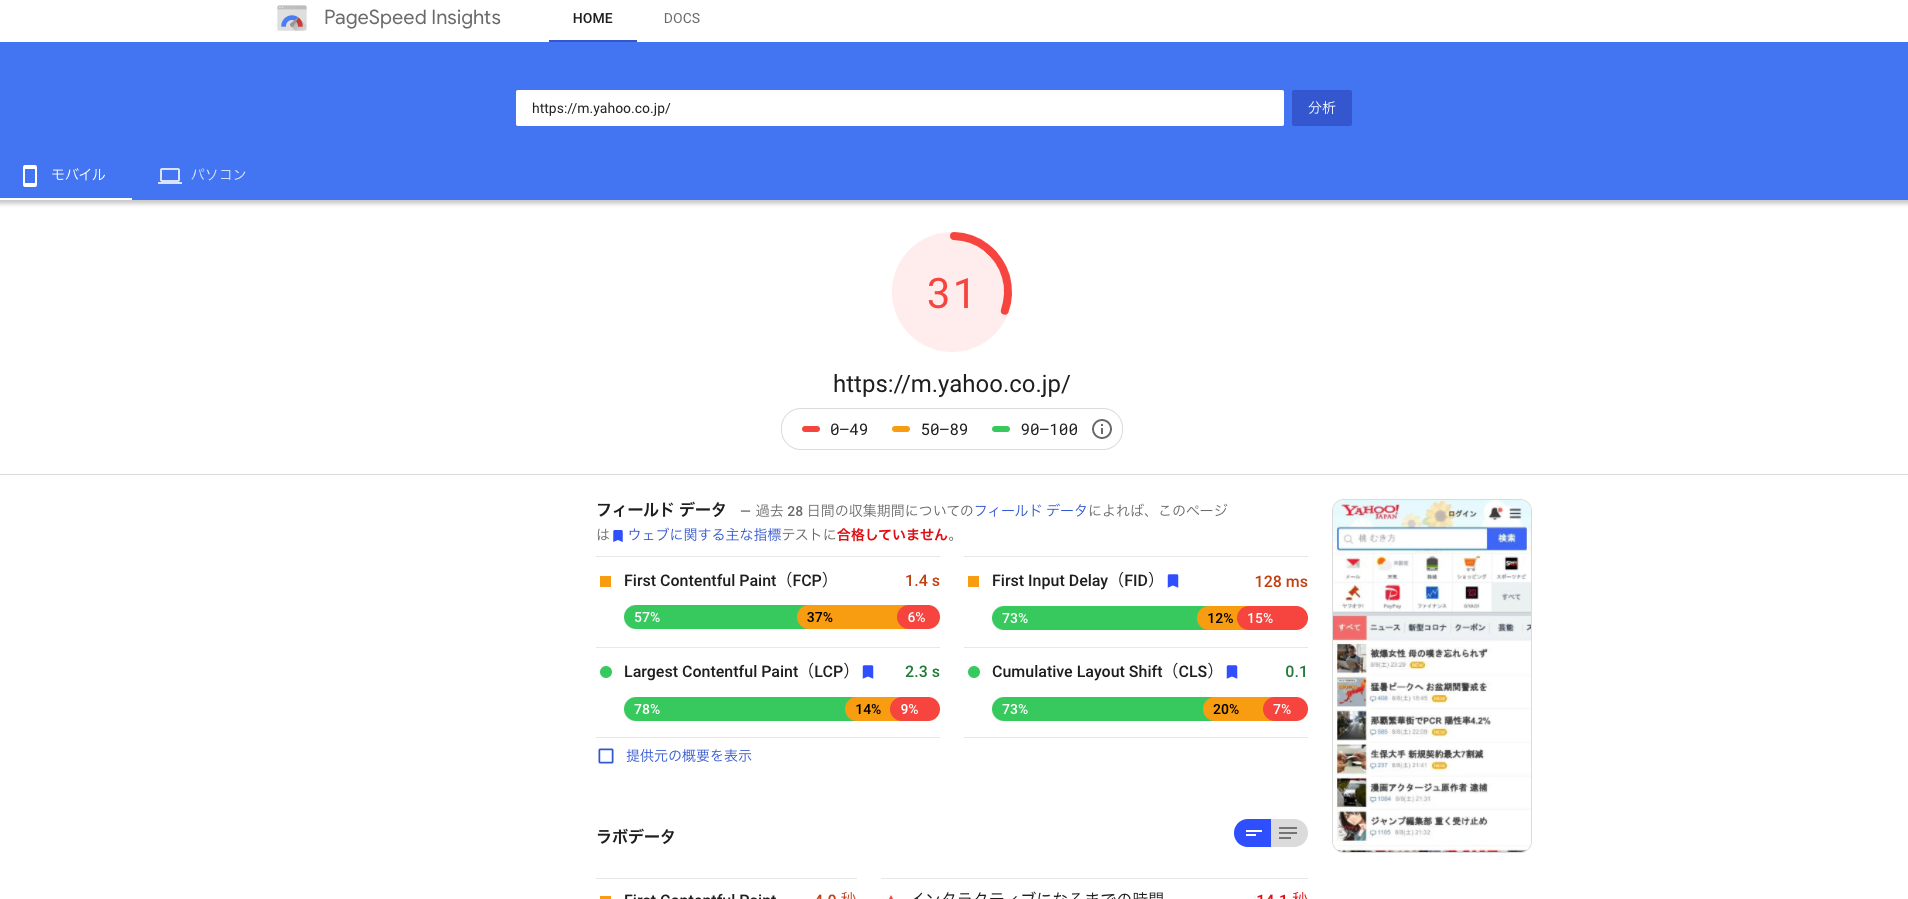
PageSpeed Insights
URL を入力して分析を押すだけなので、誰でも簡単に使うことができます。
また、分析した内容に対して、どのように対処するとスコアが改善するかも提示してくれるので、インターネット上に公開済みのサービスであれば、手軽に分析、改善していくことができます。
使い方
- PageSpeed Insights を開く
- URL を入力し、分析を実行
おわりに
Web サービスにおいて、UX は非常に重要な指標になります。ChUX を使って、より良いサイトを作っていきましょう。まず最初に使うものとしては、PageSpeed Insights が手軽でおすすめです。ぜひ、ご自身のページで分析してみて、どれくらいのスコアが出ているかをみてみましょう。また、今後、FID, LCP, CLS なども SEO に効いてくるので、この辺りの指標を改善しておくのも良いかと思います。
参考
https://note.com/makn/n/n640eccbf421f
https://developers.google.com/web/tools/chrome-user-experience-report/bigquery/getting-started?hl=ja
