はじめに
- こちらは私自身の機械学習やディープラーニングの勉強記録のアウトプットです。
- **deeplearningで柴犬の写真からうちの子かどうか判定(1)とdeeplearningで柴犬の写真からうちの子かどうか判定(2)データ増量・転移学習・ファインチューニング**に引き続き、Google Colaboratoryで deep learningの分析結果の重みを可視化します。
- 様々なエラーでつまずいた箇所などもなるべく記述し、なるべく誰でも再現がしやすいように記載します。
この記事の対象者・参考にした記事
- 対象者:以前と同じです。詳細は**こちら**。
- 参考にした記事
○kerasでvgg16とGrad-CAMの実装による異常検出および異常箇所の可視化
私について
- 2019年9月にJDLA Deep Learning for Engeneer 2019#2を取得。
- 2020年3月末までは公益法人の事務職。2020年4月からはデータエンジニアにキャリアチェンジ。
詳細は**こちら**。
前回(2)の分析の概要
- 分析対象の画像ファイル(jpg)を、愛犬(柴犬)の写真120枚、(愛犬以外の)柴犬の写真の写真を120枚、計240枚に増やし、それらを再度 deep learning で2分類しました。
- また、ImageNetのモデル(VGG16)で転移学習、ファインチューニングを行い、テストデータで検証した結果、分類精度は75%程度から95%程度まで向上しました。
今回(3)の手順概要
手順1 データコンバート、モデルの構築と学習
手順2 Grad-CAMの実装
-
@T_Taoさんのこちらの記事**(kerasでvgg16とGrad-CAMの実装による異常検出および異常箇所の可視化)**でGrad-CAMの実装が紹介されていました。
-
この記事で紹介されていたコードを私も実装し、前回に引き続き柴犬の写真データを使用して、Grad-CAMによる可視化をしてみたいと思います。deep learning が犬の写真のどの部分を特徴量と見て、2種の判別をしているのかを目で見える形で知るのは、とても興味深いです。
-
以下の実装は、基本的に参考にした記事のコードをそのまま書いていきます。また、前回の(2)の分析でセットアップしたGoogle Driveのデータをそのまま使用します。
手順1 データコンバート、モデルの構築と学習
(1) Google Driveのマウント
柴犬の画像が入っているフォルダからColabにデータを読み込めるよう、マウントします。
# Google Driveマウント
from google.colab import drive
drive.mount('/content/drive')
(2) 必要なライブラリをインポートします
次のコードでインポート。
# ライブラリのインポート
from __future__ import print_function
import keras
from keras.applications import VGG16
from keras.models import Sequential, load_model, model_from_json
from keras import models, optimizers, layers
from keras.optimizers import SGD
from keras.layers import Dense, Dropout, Activation, Flatten
from sklearn.model_selection import train_test_split
from PIL import Image
from keras.preprocessing import image as images
from keras.preprocessing.image import array_to_img, img_to_array, load_img
from keras import backend as K
import os
import numpy as np
import glob
import pandas as pd
import cv2
(3) データの前処理
前回まではkerasのImage Data Generatorを使用して画像データのコンバートをしていました。今回はImage Data Generatorを使用せず、次のコードを用いて画像ファイルをテンソルに変換します。
# cd '/content/drive/'My Drive/'Colab Notebooks'内の作業フォルダへ移動
%cd '/content/drive/'My Drive/Colab Notebooks/Self_Study/02_mydog_or_otherdogs/

num_classes = 2 # クラスの数
folder = ["mydog2", "otherdogs2"] # 写真データの格納されているフォルダ名
image_size = 312 # 入力画像の一片のサイズ
x = []
y = []

for index, name in enumerate(folder):
    dir = "./original_data/" + name
    files = glob.glob(dir + "/*.jpg")
    for i, file in enumerate(files):
        image = Image.open(file)
        image = image.convert("RGB")
        image = image.resize((image_size, image_size))
        data = np.asarray(image)
        x.append(data)
        y.append(index)
# リストをNumpy配列に変換する場合は、np.array、np.asarrayの2種類がある。
# Numpy配列のコピーを作る場合は、np.arrayを使う。
# 元のNumpy配列と同期され続けるコピーを作る場合は、np.asarrayを使う。

x = np.array(x)
y = np.array(y)
(4) 変換後のデータの確認
xとyにどのような形でデータが変換されて格納されているかを確認してみます。
# xの中身の確認
display(x)
画像データをコンバートしたxの中身は以下のようなリストに変換されています。
array([[[[114, 109, 116],
         [116, 111, 118],
         [104,  99, 105],
         ...,
         [ 37,  38,  30],
         [ 37,  38,  30],
         [ 36,  37,  29]],

        [[117, 112, 119],
         [120, 115, 121],
         [110, 105, 111],
         ...,
         [ 37,  38,  30],
         [ 37,  38,  30],
         [ 37,  38,  30]],

        [[118, 113, 120],
         [121, 116, 122],
         [114, 109, 115],
         ...,
         [ 37,  38,  30],
         [ 38,  39,  31],
         [ 38,  39,  31]],
(中略)

       ...,

        [[ 60,  56,  53],
         [ 60,  56,  53],
         [ 61,  57,  54],
         ...,
         [105,  97,  84],
         [105,  97,  84],
         [104,  96,  83]]]], dtype=uint8)

'\n[[[0, 0, 0],\n         [0, 0, 0],\n         [0, 0, 0],\n         ...,\n         [0, 0, 0],\n         [0, 0, 0],\n         [0, 0, 0]],\n'
y(ラベル)の中身を確認します。
# yの中身の確認
y
yは「0」と「1」の2種類のラベルで生成されています。
array([0, 0, 0, 0, 0, 0, 0, 0, 0, 0, 0, 0, 0, 0, 0, 0, 0, 0, 0, 0, 0, 0,
       0, 0, 0, 0, 0, 0, 0, 0, 0, 0, 0, 0, 0, 0, 0, 0, 0, 0, 0, 0, 0, 0,
       0, 0, 0, 0, 0, 0, 0, 0, 0, 0, 0, 0, 0, 0, 0, 0, 0, 0, 0, 0, 0, 0,
       0, 0, 0, 0, 0, 0, 0, 0, 0, 0, 0, 0, 0, 0, 0, 0, 0, 0, 0, 0, 0, 0,
       0, 0, 0, 0, 0, 0, 0, 0, 0, 0, 0, 0, 0, 0, 0, 0, 0, 0, 0, 0, 0, 0,
       0, 0, 0, 0, 0, 0, 0, 0, 0, 0, 1, 1, 1, 1, 1, 1, 1, 1, 1, 1, 1, 1,
       1, 1, 1, 1, 1, 1, 1, 1, 1, 1, 1, 1, 1, 1, 1, 1, 1, 1, 1, 1, 1, 1,
       1, 1, 1, 1, 1, 1, 1, 1, 1, 1, 1, 1, 1, 1, 1, 1, 1, 1, 1, 1, 1, 1,
       1, 1, 1, 1, 1, 1, 1, 1, 1, 1, 1, 1, 1, 1, 1, 1, 1, 1, 1, 1, 1, 1,
       1, 1, 1, 1, 1, 1, 1, 1, 1, 1, 1, 1, 1, 1, 1, 1, 1, 1, 1, 1, 1, 1,
       1, 1, 1, 1, 1, 1, 1, 1, 1, 1, 1, 1, 1, 1, 1, 1, 1, 1, 1, 1])
(5) 変換後データをtrainデータとtestデータに分割します
変換後のテンソルは、この後構築したモデルで学習するために、sklearnのtrain_test_splitにかけて分割します。
# trainデータとtestデータに分割
x_train, x_test, y_train, y_test = train_test_split(x, y, test_size=0.2, random_state=1)
x_train = x_train.astype('float32')
x_test = x_test.astype('float32')
x_train /= 255
x_test /= 255
(6) ラベルはワンホット表現に変換します
# y ラベルをワンホット表現に変更
y_train = keras.utils.to_categorical(y_train, num_classes)
y_test = keras.utils.to_categorical(y_test, num_classes)

print(x_train.shape[0], 'train samples')
print(x_test.shape[0], 'test samples')
次のような結果が表示されます。
192 train samples
48 test samples
(7) モデルの構築とコンパイル
次のコードでモデルを構築します。今回のオプティマイザはSDG(確率的勾配降下法)を指定します。
vgg_conv = VGG16(weights='imagenet', include_top=False, input_shape=(image_size, image_size, 3))
last = vgg_conv.output

mod = Flatten()(last)
mod = Dense(1024, activation='relu')(mod)
mod = Dropout(0.5)(mod)
preds = Dense(2, activation='sigmoid')(mod)

model = models.Model(vgg_conv.input, preds)
model.summary()

epochs = 100
batch_size = 48

model.compile(loss='binary_crossentropy',
              optimizer=optimizers.SGD(lr=1e-4, momentum=0.9),
              metrics=['accuracy'])
(7) モデルの学習
モデルを学習させます。
history = model.fit(x_train, y_train,
                    batch_size=batch_size,
                    epochs=epochs,
                    validation_data=(x_test, y_test),
                    shuffle=True)
モデルは保存しておきます。
model.save('mydog_or_otherdogs3(Grad-Cam).h5')
(8) 学習済みモデルの評価とaccuracy&lossの推移
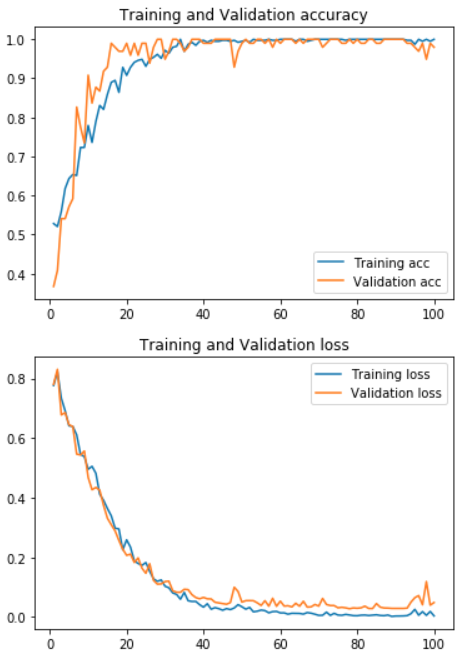
次のコードで結果を表示させ、グラフ描画します。画像ファイルは全データ(240枚)を使用しているためか、validationの結果も高くなっています。
# score表示
scores = model.evaluate(x_test, y_test, verbose=1)
print('Test loss:', scores[0])
print('Test accuracy:', scores[1])

# accuracy 及び loss のプロット
import matplotlib.pyplot as plt

acc = history.history["acc"]
val_acc = history.history["val_acc"]
loss = history.history["loss"]
val_loss = history.history["val_loss"]
epochs = range(1, len(acc) + 1)

plt.plot(epochs, acc, label = "Training acc" )
plt.plot(epochs, val_acc, label = "Validation acc")
plt.title("Training and Validation accuracy")
plt.legend()
plt.show()

plt.plot(epochs, loss,  label = "Training loss" )
plt.plot(epochs, val_loss, label = "Validation loss")
plt.title("Training and Validation loss")
plt.legend()
plt.show()
結果はこのとおり。
Test loss: 0.04847167782029327
Test accuracy: 0.9795918367346939
手順2 Grad-CAMの実装
(1) Grad-CAMの実装
以下のコードを入力します。@T_Taoさんによると、kerasでGrad-CAM 自分で作ったモデルで のコードを基にされているということです。
K.set_learning_phase(1) #set learning phase

def Grad_Cam(input_model, pic_array, layer_name):

    # 前処理
    pic = np.expand_dims(pic_array, axis=0)
    pic = pic.astype('float32')
    preprocessed_input = pic / 255.0

    # 予測クラスの算出
    predictions = input_model.predict(preprocessed_input)
    class_idx = np.argmax(predictions[0])
    class_output = input_model.output[:, class_idx]

    #  勾配を取得
    conv_output = input_model.get_layer(layer_name).output   # layer_nameのレイヤーのアウトプット
    grads = K.gradients(class_output, conv_output)[0]  # gradients(loss, variables) で、variablesのlossに関しての勾配を返す
    gradient_function = K.function([input_model.input], [conv_output, grads])  # input_model.inputを入力すると、conv_outputとgradsを出力する関数

    output, grads_val = gradient_function([preprocessed_input])
    output, grads_val = output[0], grads_val[0]

    # 重みを平均化して、レイヤーのアウトプットに乗じる
    weights = np.mean(grads_val, axis=(0, 1))
    cam = np.dot(output, weights)

    # 画像化してヒートマップにして合成
    cam = cv2.resize(cam, (312, 312), cv2.INTER_LINEAR)
    cam = np.maximum(cam, 0)
    cam = cam / cam.max()

    jetcam = cv2.applyColorMap(np.uint8(255 * cam), cv2.COLORMAP_JET)  # モノクロ画像に疑似的に色をつける
    jetcam = cv2.cvtColor(jetcam, cv2.COLOR_BGR2RGB)  # 色をRGBに変換
    jetcam = (np.float32(jetcam) + pic / 2)   # もとの画像に合成
    return jetcam
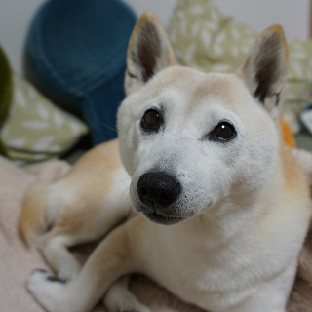
結果を何枚かの柴犬の写真に適用してみます。まずはうちの犬から。
# cd '/content/drive/'My Drive/'Colab Notebooks'内の指定フォルダへ移動
%cd '/content/drive/'My Drive/Colab Notebooks/

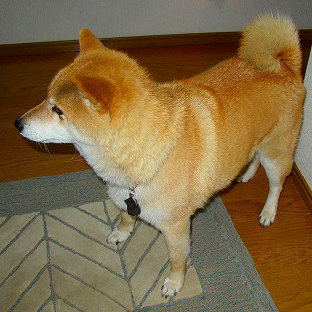
pic_array = img_to_array(load_img('/content/drive/My Drive/Colab Notebooks/Self_Study/02_mydog_or_otherdogs/original_data/mydog2/mydog1.jpg', target_size=(312, 312)))
pic = pic_array.reshape((1,) + pic_array.shape)
array_to_img(pic_array)
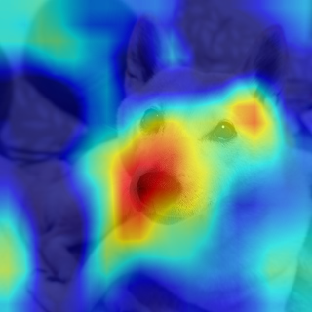
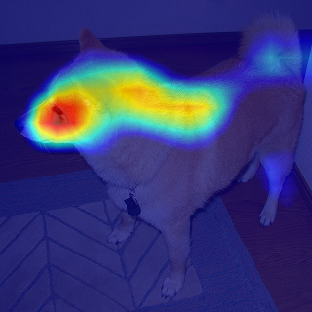
ヒートマップを重ねます
picture = Grad_Cam(model, pic_array, 'block5_conv3')
picture = picture[0,:,:,]
array_to_img(picture)
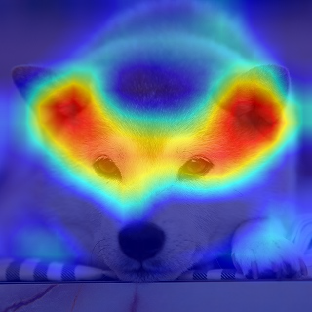
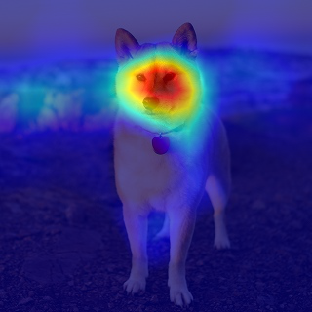
おぉーという感じでしょうか。Grad-CAMのヒートマップで可視化したことにより deep learning がどの辺を特徴としてみているのかが描画されました。色がより赤くなっている部分は、予測クラスのlossに大きく寄与しているところ(勾配の大きいところ)になっているのですが、やっぱり顔の目の下から鼻にかけての当たりなど、個々の犬の顔面でも個性が出ている個所を見ているのかと思いました。ちょっと意外だったのは、目と耳の間など(そこ?)もヒートマップの色が濃くなっています。
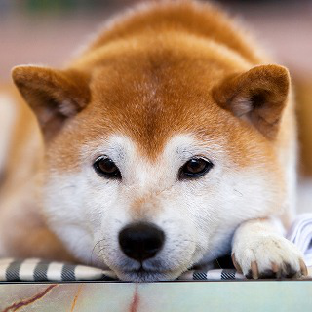
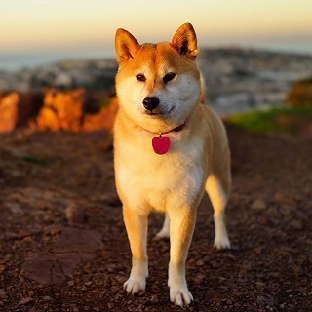
他にも2枚ほどうちのみりんと、3枚ほど他の柴犬の写真に適用して並べてみました。
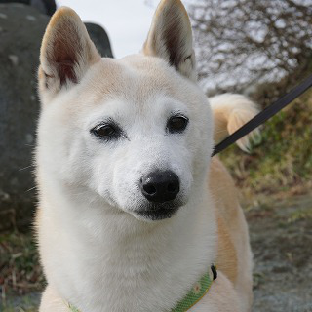
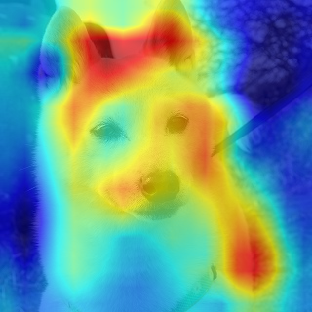
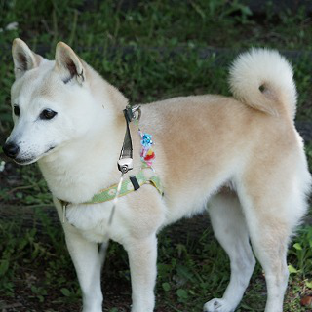
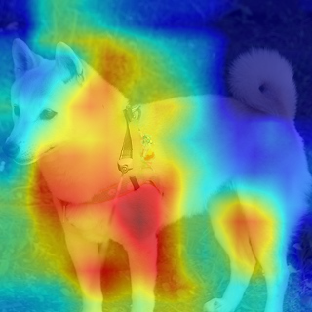
同じようなところ(目から鼻のあたり)を見ている画像もあれば、全然違う部分を見ているものもあり、なかなか興味深いです。特徴としている個所に概ねの傾向はありそうだと思いますが、このヒートマップのみで説明しようとするのは少し難しいかもしれません。
今回はGrad-CAMによるヒートマップの作成を実施しました。特徴部分を可視化する方法は、Grad-CAM++やGuided-Grad-CAMなど他にもいろいろあるようなので、次回以降にまたいろいろ試してみたいと思います。
