0.はじめに
初めまして。Qiita初投稿です。
現在、エンジニアへの転職へ向けてpythonによるデータ分析などを学習しています。
自身の備忘録として書いていますので、間違いや気になるところなどあればご指摘頂けるとありがたいです。
1.単回帰分析と多項式回帰分析
どちらも2つの量的データの関係を予測する分析手法ですが、
・単回帰分析 一次式を用いて直線的に予測

・多項式回帰分析 多項式を用いて曲線的に予測

の違いがあります。
式で書くと、
単回帰分析・・・y = wx + b
多項式回帰分析・・・ y = w0x0 + w1x1 + w2x2 + ... + b0
2.pythonでの実装
1.データの読み込み
sklearnのデータセット boston.data を使って実装してみます。
(参考【データ解析】ボストン住宅価格データセットを使ってデータ解析する)
まずは、データの読み込みから、
import pandas as pd
from sklearn.datasets import load_boston

# 説明変数となるデータ
boston = load_boston()
boston_df = pd.DataFrame(boston.data, columns=boston.feature_names)

# 目的変数の追加
boston_df['MEDV'] = boston.target
2.データの可視化
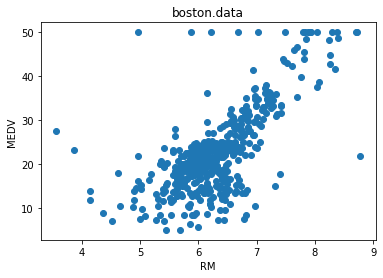
説明変数にRM(平均部屋数)、目的変数にMEDV(住宅価格)を使用しています。
import matplotlib.pyplot as plt

# 平均部屋数RMと住宅価格MEDVの散布図
x = boston_df['RM']
y = boston_df['MEDV']
plt.scatter(x, y)
plt.title('boston.data')
plt.xlabel('RM')
plt.ylabel('MEDV')
plt.show()
3.学習用データとテストデータに分割する
from sklearn.model_selection import train_test_split
x_train, x_test, y_train, y_test = train_test_split(x, y, test_size=0.3, random_state=0)
4.モデルの作成
PolynomialFeaturesの引数degreeに任意の値を指定することで、N項の多項式にすることができる。
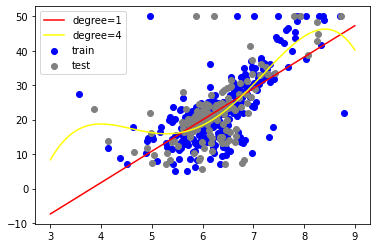
以下では、degree=1(1項なので単回帰分析)、degree=4(4項の多項式分析)を試している。
from sklearn.linear_model import LinearRegression
from sklearn.preprocessing import PolynomialFeatures
from sklearn.pipeline import Pipeline

x_train = np.array(x_train).reshape(-1, 1)
y_train = np.array(y_train)

# degree=1で単回帰分析
model_1 = Pipeline([
    ('poly', PolynomialFeatures(degree=1)),
    ('linear', LinearRegression())
])
model_1.fit(x, y)

# degreeの値に任意の値を指定することで、多項式分析に(以下は4項)
model_2 = Pipeline([
    ('poly', PolynomialFeatures(degree=4)),
    ('linear', LinearRegression())
])
model_2.fit(x, y)
5.散布図と回帰モデルの可視化
fig, ax = plt.subplots()
ax.scatter(x_train, y_train, color='blue', label='train')
ax.scatter(x_test, y_test, color='gray', label='test')

x_ = np.linspace(3, 9, 100).reshape(-1, 1)
plt.plot(x_, model_1.predict(x_), color='red', label='degree=1')
plt.plot(x_, model_2.predict(x_), color='yellow', label='degree=4')
plt.legend()
plt.show()
degreeの値を増やせば、もっとグニャグニャの線になり、学習データに対して適合した線になっていくが、増やし過ぎると過学習になってしまうので、調整が必要。
この他、正則化によって過学習を抑える方法もある。

