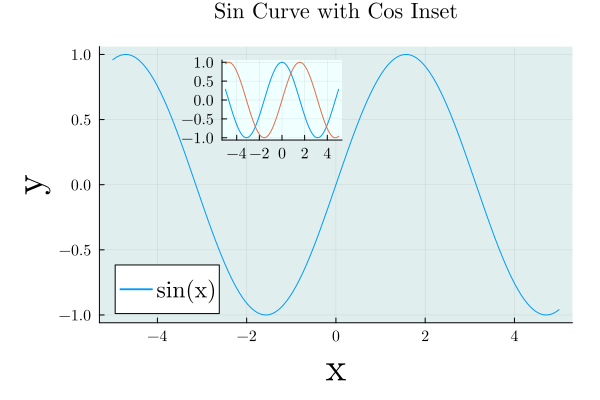
プロットの中にプロット領域を作るような、インセット(inset)のある図を載せる方法が、日本語ではあまり検索に引っかからないため、こちらに備忘録として載せておきます。
インセットでプロットする方法
こちらのドキュメントを参考に、順番に図を交えて書いていきます。
すべてをまとめたサンプルコードはこちらです。
-
using PlotsでPlotsを扱えるようにします。using Plots -
メインとなるプロットを
main_plotと名前を付けて、作成&描画します(今回は正弦波にしました)。main_plot = plot(sin) -
インセットの描画領域を作成し、
inset_plotという名前を付けておきます。 ここで、bbox(x, y, width, height)でインセットの位置と大きさを指定してあげます。inset_plot = plot!(main_plot,inset=bbox(0.3,0.3,0.4,0.4)) -
インセットにデータを描画します(今回は余弦波にしました)。
plot!(inset_plot, cos, subplot=2)
サンプルコード
以上の手続きをまとめて、少し成形したサンプルコードを載せておきます。
using Plots

default(
  fontfamily="serif-roman",
  guidefontsize=25,
  tickfontsize=10,
  legendfontsize=15,
  margin=5Plots.mm,
)

# メインプロット(sinカーブ)
main_plot = plot(
  sin,
  label="sin(x)",
  title="Sin Curve with Cos Inset",
  xlabel="x",
  ylabel="y",
  legend=:bottomleft,
  bg_inside = :azure2,
  )

# インセットの追加
inset_plot = plot!(main_plot, cos,
      inset = bbox(0.37, 0.15, 0.2, 0.2),
      subplot = 2,
      legend = false,
      bg_inside = :azure,
      )
plot!(inset_plot, sin,
      subplot = 2,
      legend = false,
      )


