はじめに
R shiny でアプリを作ってみた(詳細はこちら)があまりにもシンプルであったため、もう少し、複雑なものを作ってみたいと思い取り組んだ。内容としてはcsvファイルを読み込んで、データの基礎分析(統計量の計算、可視化等)を自動で行えるようなアプリを開発したい。長くなりそうなので、テーマごとに分けて記事を書いていきたいと思う。
使うデータの準備
まずはこちらの記事で作成した人の性別、身長、体重、血液型があるデータを取り扱いたいと思う。記事の通り1000人分のデータを作成したら、それを csv ファイルに出力する。
> str(df)
'data.frame':	1000 obs. of  4 variables:
 $ SEX   : chr  "female" "male" "male" "male" ...
 $ HEIGHT: num  154 178 163 176 156 ...
 $ WEIGHT: num  48 70.8 48.2 76.4 40.9 ...
 $ BLOOD : chr  "O" "A" "A" "O" ...
> write.csv(df, "./data.csv")
これで使用するデータが用意できた。
ファイルの読み込みと表示
まず基礎となるファイルを読み込んで表示するアプリを作成する。
app.R
# Load packages ----
library(shiny)


# Source helpers ----


# User interface ----
ui <- fluidPage(
  titlePanel("Basic analysis"),

  sidebarLayout(
    sidebarPanel(
      fileInput("file",
                label = "File input",
                accept = c("text/csv"),
                multiple = FALSE,
                width = "80%")
    ),

    mainPanel(
      dataTableOutput("outFile"),
    )
  )
)

# Server logic
server <- function(input, output) {

  inFile <- reactive({
    tmp <- input$file
    if (is.null(tmp)){
      return(NULL)
    } else {
      df <- read.csv(tmp$datapath, header=TRUE)
      return(df)
    }
  })

  output$outFile <- renderDataTable({
    data.frame(inFile())
  })

}

# Run the app
shinyApp(ui, server)
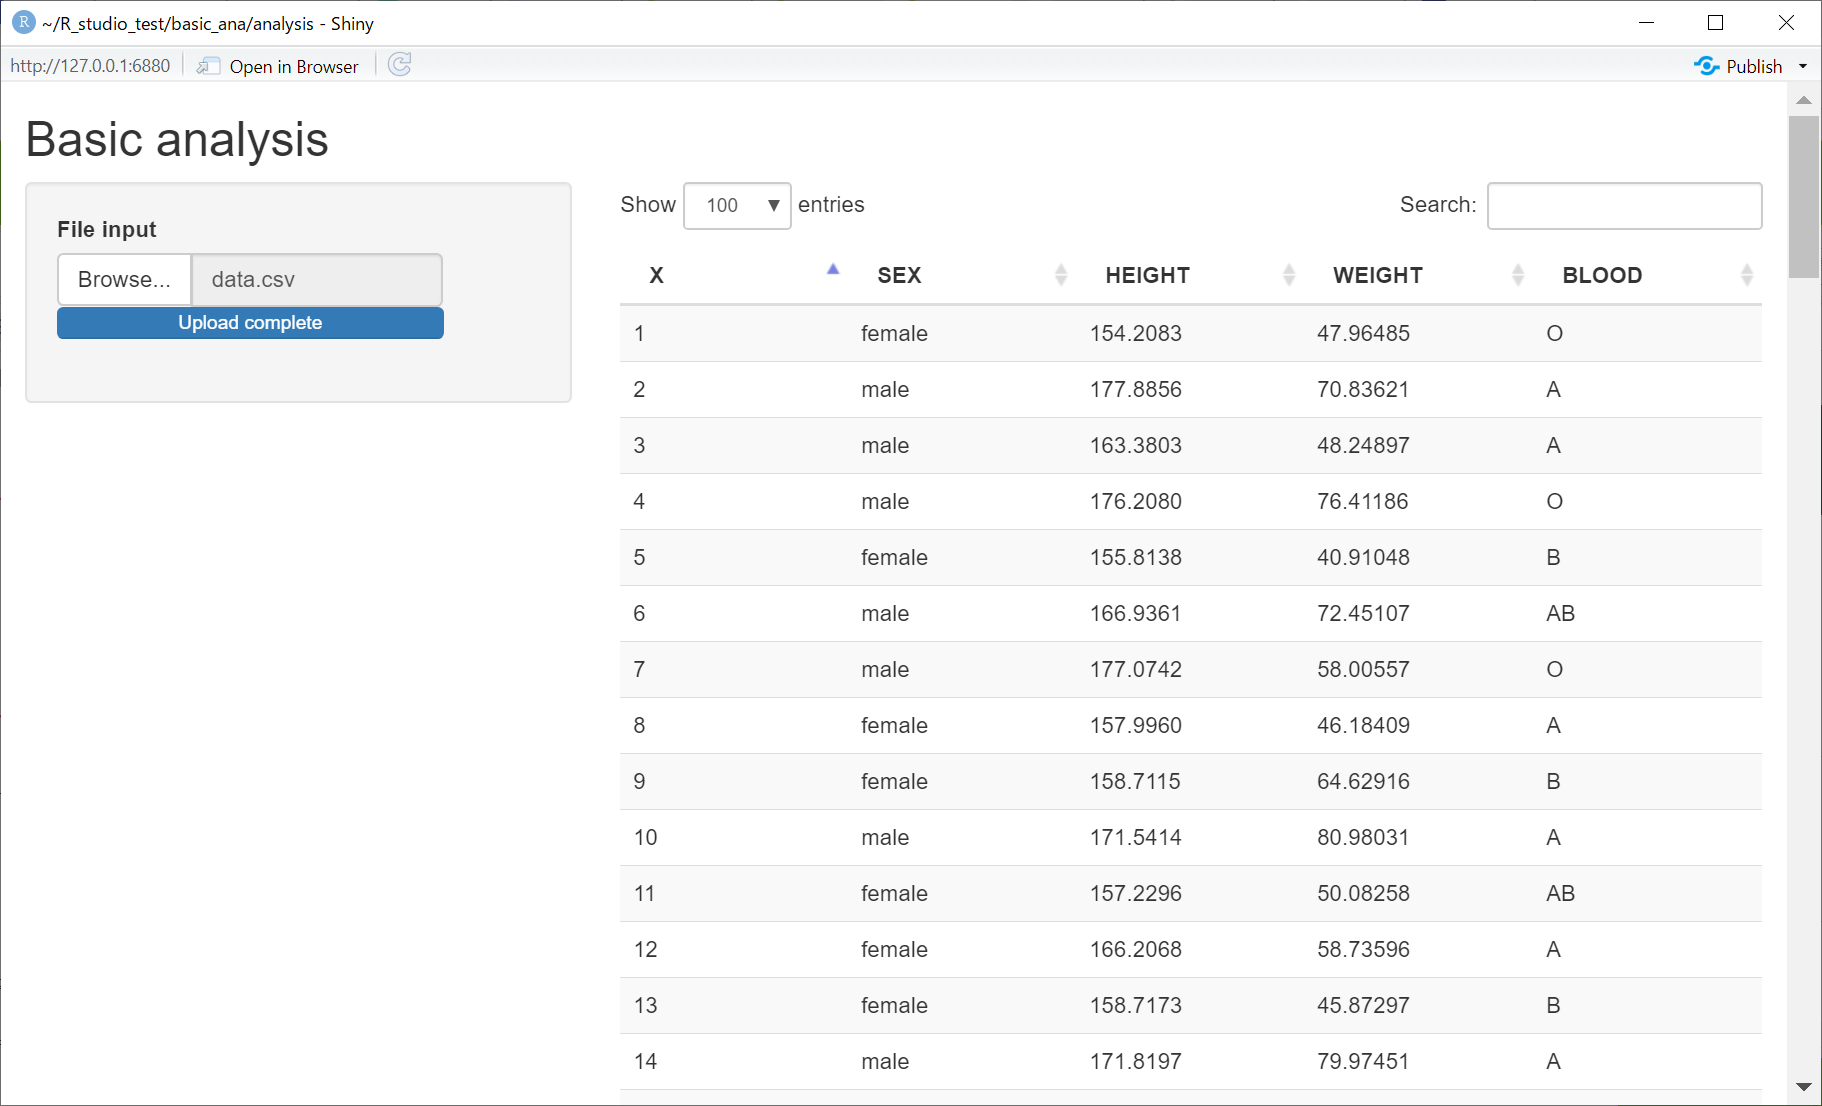
これを実行し、data.csvを読み込ませると、
となりデータテーブルの表示ができた。
タブの作成
mainPanel に tabsetPanel を加えて書き換える。タブごとにデータ、統計量、可視化を変えれるように作成する。タブの中身については次の記事で書いていこうと思う。
app.R
# Load packages ----
library(shiny)


# Source helpers ----


# User interface ----
ui <- fluidPage(
  titlePanel("Basic analysis"),

  sidebarLayout(
    sidebarPanel(
      fileInput("file",
                label = "File input",
                accept = c("text/csv"),
                multiple = FALSE,
                width = "80%")
    ),

    mainPanel(
      tabsetPanel(type = "tabs",
                  tabPanel("Data", dataTableOutput("outFile")),
                  tabPanel("Statistic", h1("Statistics value")),
                  tabPanel("Visualize", h1("Plot"))
      )

    )
  )
)

# Server logic
server <- function(input, output) {

  inFile <- reactive({
    tmp <- input$file
    if (is.null(tmp)){
      return(NULL)
    } else {
      df <- read.csv(tmp$datapath, header=TRUE)
      return(df)
    }
  })

  output$outFile <- renderDataTable({
    data.frame(inFile())
  })

}

# Run the app
shinyApp(ui, server)
おわりに
次の記事ではタブの一つである基礎統計量の算出と表示を行いたいと思う。

