はじめに
こちらの記事で基礎分析を行い、こちらの記事で重回帰分析を行った、UCI 機械学習リポジトリのReal estate valuationデータについて住宅価格を予測する web アプリケーションの作成を shiny で行った。
重回帰分析結果表示のための関数化
重回帰分析の詳細についてはこちらの記事を参照。その結果を用いて、新たな入力値から住宅価格を予測する関数、lm_predic を定義する。それと同時に日付の計算をするcalc_yearも定義する。
helpers.R
library(openxlsx)
df <- read.xlsx("./data/Real_estate_valuation_data_set.xlsx")

coln <- colnames(df)
colnames(df) <- c("No","X1","X2","X3","X4","X5","X6","Y")

library(rsample)
set.seed(1234)
df_split <- initial_split(df, prop = 0.8)
df_train <- training(df_split)
df_test <- testing(df_split)

df_train.lm <- lm(Y~X1+X2+X3+X4+X5+X6, df_train)
# summary(df_train.lm)

lm_predict <- function(x) {
  df_new <- as.data.frame(t(c(0, x, 0)))
  colnames(df_new) <- c("No","X1","X2","X3","X4","X5","X6","Y")
  res <- predict(df_train.lm, newdata = df_new)
  return(res)
}

#######################################
library(chron)

calc_year <- function(date_str) {
  dts <- dates(as.character(date_str), format = "y-m-d")
  mdy <- month.day.year(dts)
  date_str0 <- paste(mdy$year-1, "/12/31", sep = "")
  dts0 <- dates(date_str0, format = "y/m/d")
  if (leap.year(dts)) {
    days <- 366
  } else {
    days <- 365
  }
  res <- mdy$year + (as.integer(dts - dts0))/days
  return(res)
}
Webアプリケーション
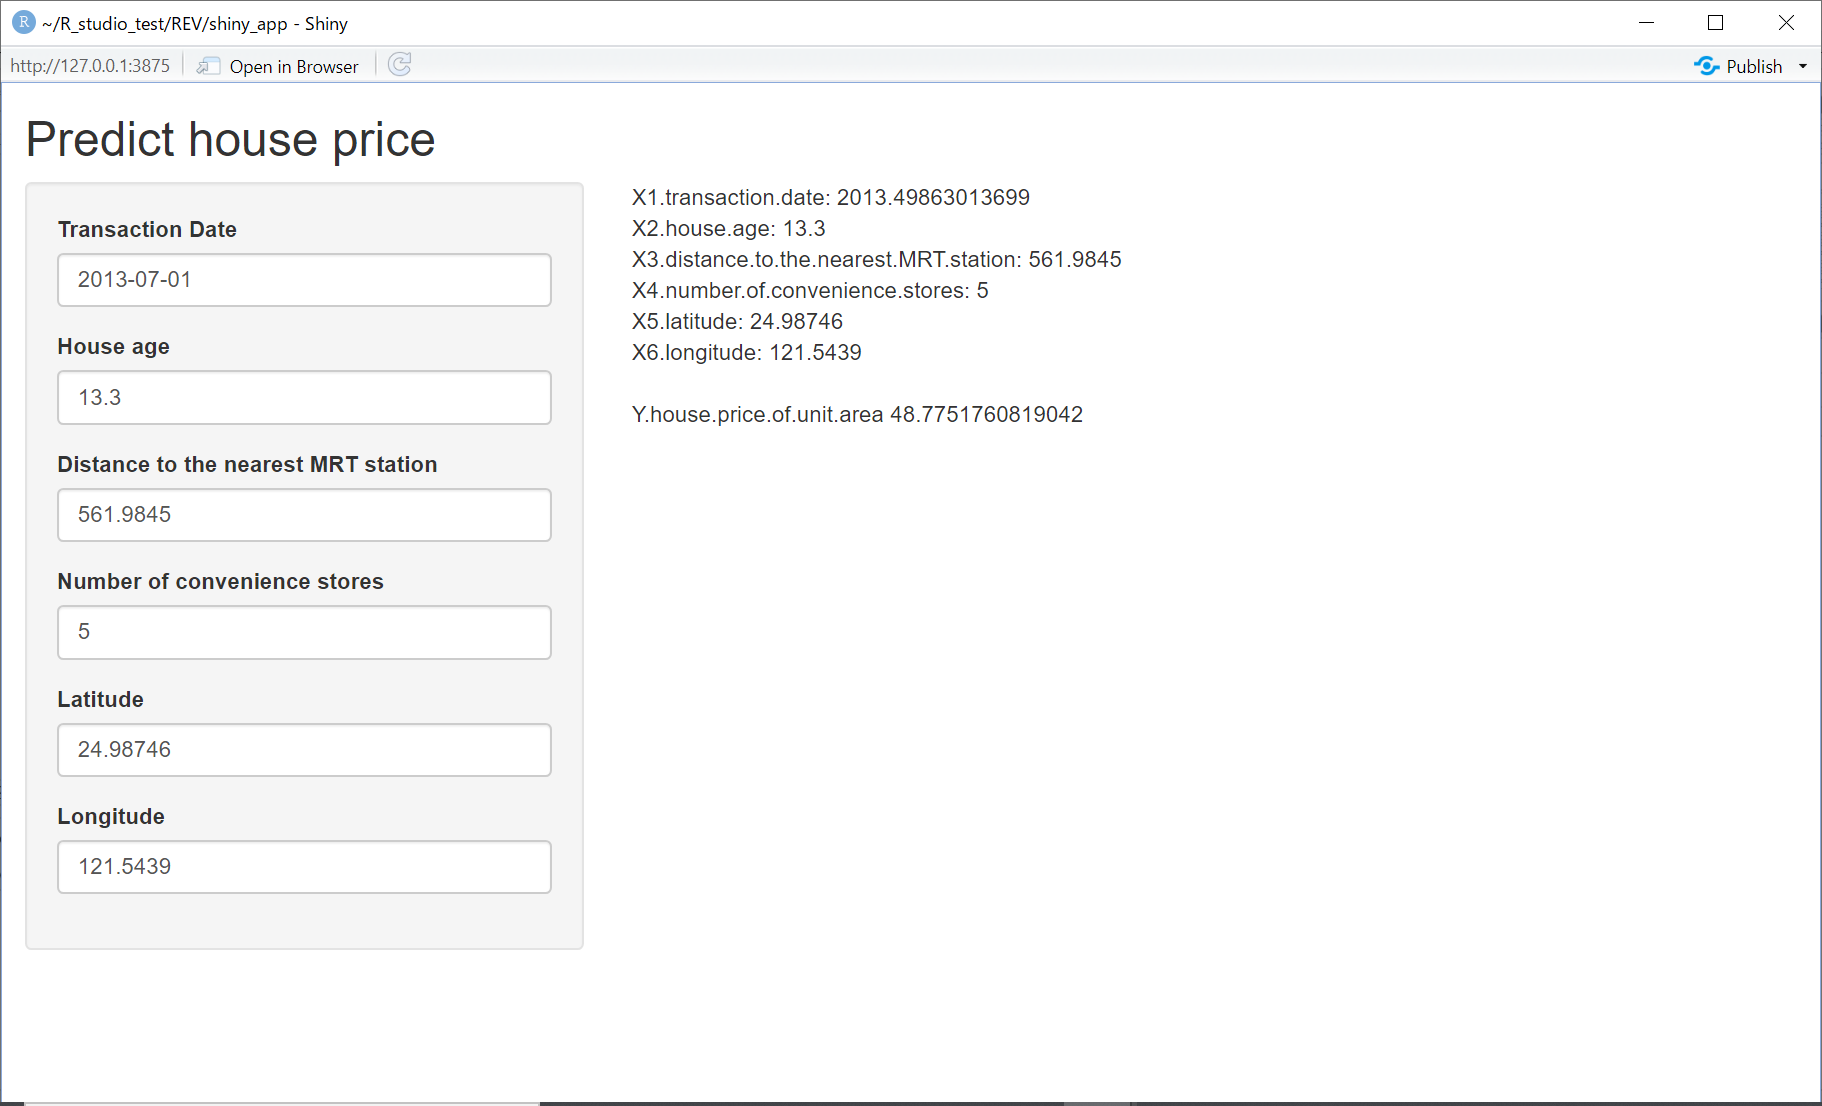
日付入力と数値入力のボックスを使って変数の条件を取得する。取得した数値を表示し、前節の関数をつかって住宅価格を予測し表示する。文字表示のみなので、textOutputが並んでいるだけである。
app.R
# Load packages ----
library(shiny)
library(chron)

# Source helpers ----
source("helpers.R")

# User interface ----
ui <- fluidPage(
  titlePanel("Predict house price"),

  sidebarLayout(
    sidebarPanel(
      dateInput("date",
                label = "Transaction Date",
                value = "2013-07-01"),

      numericInput("X2",
                   label = "House age",
                   value = 13.3),

      numericInput("X3",
                   label = "Distance to the nearest MRT station",
                   value = 561.9845),

      numericInput("X4",
                   label = "Number of convenience stores",
                   value = 5),

      numericInput("X5",
                   label = "Latitude",
                   value = 24.98746),

      numericInput("X6",
                   label = "Longitude",
                   value = 121.5439)
    ),

    mainPanel(
      textOutput("output_X1"),
      textOutput("output_X2"),
      textOutput("output_X3"),
      textOutput("output_X4"),
      textOutput("output_X5"),
      textOutput("output_X6"),
      br(),
      textOutput("output_Y")
    )
  )
)

# Server logic
server <- function(input, output) {

  output$output_X1 <- renderText({
    X1 <- calc_year(as.character(input$date))
    paste("X1.transaction.date:", X1)
  })

  output$output_X2 <- renderText({
    paste("X2.house.age:", input$X2)
  })

  output$output_X3 <- renderText({
    paste("X3.distance.to.the.nearest.MRT.station:", input$X3)
  })

  output$output_X4 <- renderText({
    paste("X4.number.of.convenience.stores:", input$X4)
  })

  output$output_X5 <- renderText({
    paste("X5.latitude:", input$X5)
  })

  output$output_X6 <- renderText({
    paste("X6.longitude:", input$X6)
  })

  output$output_Y <- renderText({
    X1 <- calc_year(as.character(input$date))
    X <- c(X1, input$X2, input$X3, input$X4, input$X5, input$X6)
    Y <- lm_predict(X)
    paste("Y.house.price.of.unit.area", Y)
  })

}

# Run the app
shinyApp(ui, server)
これを実行してみる。以上のコードを入れた shiny_app というフォルダを作り、以下をコンソールから実行する。値を入力すると、住宅価格が変わるのが分かる。
> runApp("shiny_app")

Listening on http://127.0.0.1:3875
おわりに
まずは簡単な例として数値を入力し返すだけのwebアプリケーションを作成した。次はもう少し複雑なモノ(例:基礎分析を自動で行う、タブごとにプロットと結果を返す等)も作ってみたいと思う。