n個体間の非類似度または距離が与えられているとき、それらn個体の位置関係を(低次元の)座標で表現する手法として、多次元尺度法 (MDS : Multi-Dimensional Scaling) があります。
MDSの数理的な解説は別の機会に譲るとして、今回はscikit-learnのパッケージを使ってMDSを試してみます。MDSには大きく分けて計量MDSと非計量MDSに分けられますが、今回扱うのは計量MDSになります。
ライブラリのインポート
scikit-learnでは sklearn.manifold.MDS をインポートすることでMDSサブパッケージを利用できます。
import numpy as np
import pandas as pd
import matplotlib.pyplot as plt

from tqdm import tqdm  # forループの進捗バーを表示するライブラリ
from sklearn.manifold import MDS
データの読込み、前処理
駅データ.jpより、station20200619free.csv をダウンロードし、pandas DataFrameとして読み込みます。
data = pd.read_csv('station20200619free.csv')
print(data.head())
   station_cd  station_g_cd station_name  station_name_k  station_name_r  line_cd  pref_cd      post           address         lon        lat    open_ymd   close_ymd  e_status   e_sort
0     1110101       1110101           函館             NaN             NaN    11101        1  040-0063    北海道函館市若松町12-13  140.726413  41.773709  1902-12-10  0000-00-00         0  1110101
1     1110102       1110102          五稜郭             NaN             NaN    11101        1  041-0813           函館市亀田本町  140.733539  41.803557  0000-00-00  0000-00-00         0  1110102
2     1110103       1110103           桔梗             NaN             NaN    11101        1  041-0801  北海道函館市桔梗3丁目41-36  140.722952  41.846457  1902-12-10  0000-00-00         0  1110103
3     1110104       1110104          大中山             NaN             NaN    11101        1  041-1121       亀田郡七飯町大字大中山  140.713580  41.864641  0000-00-00  0000-00-00         0  1110104
4     1110105       1110105           七飯             NaN             NaN    11101        1  041-1111         亀田郡七飯町字本町  140.688556  41.886971  0000-00-00  0000-00-00         0  1110105
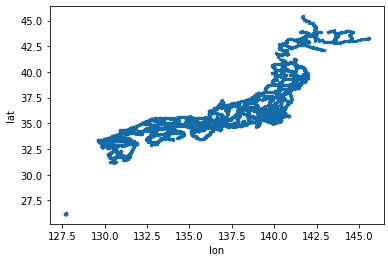
緯度(lat)・経度(lon)の情報をもとにmatplotlibで描画してみます。
fig, ax = plt.subplots()
data.plot('lon', 'lat', kind='scatter', ax=ax, marker='.')
plt.show()
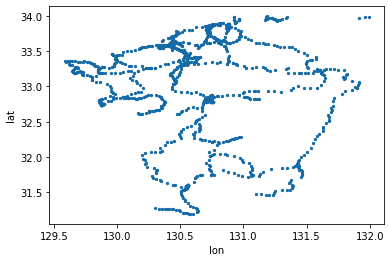
日本ですね!ただこのままだとデータ数が多いので、九州部分だけを切り出してみます。
data = data[(data['lon']>128)&(data['lon']<132)]
data = data[data['lat']<34]
len(data)
# 1207
fig, ax = plt.subplots()
data.plot('lon', 'lat', kind='scatter', ax=ax, marker='.')
plt.show()
距離行列の計算
抽出したデータをもとに各駅間の距離行列$\boldsymbol{D}$を計算します。ユークリッド距離行列の場合、駅間距離の二乗の値になります。
N = len(data)
D = np.zeros((N, N), dtype=float)
for i in tqdm(range(N)):
    for j in range(N):
        lon_diff = (data['lon'].iloc[i] - data['lon'].iloc[j])
        lat_diff = (data['lat'].iloc[i] - data['lat'].iloc[j])
        D[i][j] = lon_diff**2 + lat_diff**2

print(D)
array([[0.00000000e+00, 1.26355528e-03, 6.53891820e-03, ..., 1.06203018e+00, 1.06368290e+00, 1.05709741e+00],
       [1.26355528e-03, 0.00000000e+00, 2.39660029e-03, ..., 9.92989742e-01, 9.94425737e-01, 9.87970532e-01],
       [6.53891820e-03, 2.39660029e-03, 0.00000000e+00, ..., 9.02220608e-01, 9.03831353e-01, 8.97815038e-01],
       ...,
       [1.06203018e+00, 9.92989742e-01, 9.02220608e-01, ..., 0.00000000e+00, 6.80062050e-05, 1.68960250e-04],
       [1.06368290e+00, 9.94425737e-01, 9.03831353e-01, ..., 6.80062050e-05, 0.00000000e+00, 3.12263650e-05],
       [1.05709741e+00, 9.87970532e-01, 8.97815038e-01, ..., 1.68960250e-04, 3.12263650e-05, 0.00000000e+00]])
低次元空間へのマッピング
距離行列$\boldsymbol{D}$のみを用いて、もとの二次元空間の位置関係を再現していきます。sklearn.manifold.MDS クラスに次の引数を与えてモデルを生成し、fit_transform() メソッドで適合・変換します。
-
n_components... マッピング先の次元数。今回は二次元空間なので2。 -
dissimilarity...-
euclideanまたはprecomputed(デフォルト :euclidean) - 距離行列を既に計算している場合は
precomputedを指定。
-
-
random_state... 再現性を持たせるために乱数シードを設定。
mds = MDS(n_components=2, dissimilarity="precomputed", random_state=0)
pos = mds.fit_transform(D)
結果の確認
res = pd.DataFrame(pos, columns=['x', 'y'])
plt.scatter(res['x'], res['y'], marker='.')
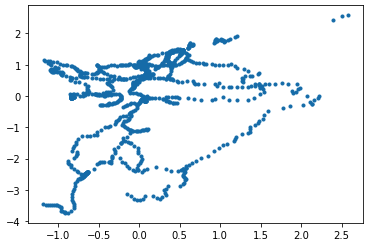
九州のようなものが見えます。軸が回転しているので戻してみしょう。
def inverse(x):
    return x*(-1)

plt.scatter(res2['y'].map(inverse), res2['x'], marker='.')
ちょっと歪ですが九州ですね!ということで無事、距離行列のみから平面上の位置関係を再現することが出来ました。


