はじめに
highchartsではデフォルトの区切りにスペースを使用しています。highchartsのグラフにカーソルを合わせたときに表示される数値に桁区切りを入れるところでハマったので、本記事を書きました。
通常の表示
Graph.vue
<template>
	<div>
		<highcharts :options="graph"></highcharts>
	</div>
</template>

<script lang="ts">
	import { Component, Vue } from 'vue-property-decorator';
	import { Chart } from 'highcharts-vue';

	export type DataType = {
		graph: any;
	}

	@Component ({
		components: {
			highcharts: Chart
		},
	})
	export default class Graph extends Vue {
		data (): DataType {
			return {
				graph: {
					title: {
						text: 'Xperiaの値段(au)'
					},
					xAxis: {
						categories: ['Xperia 1', 'Xperia 5'],
						crosshair: true
					},
					yAxis: {
						title: false,
						labels: {
							format: '{value} 円'
						},
						opposite: false,
					},
					credits: {
						enabled: false
					},
					tooltip: {
						pointFormat: '{series.name}:{point.y:,.0f} 円'
					},
					series: [{
						name: '一括価格',
						type: 'column',
						data: [92880, 81400],
						marker: {
							enabled: true
						},
					}],
				}
			}
		}
	}
</script>

<style>
	div {
		width: 80%;
		height: auto;
		margin: 20px auto auto auto;
	}
</style>
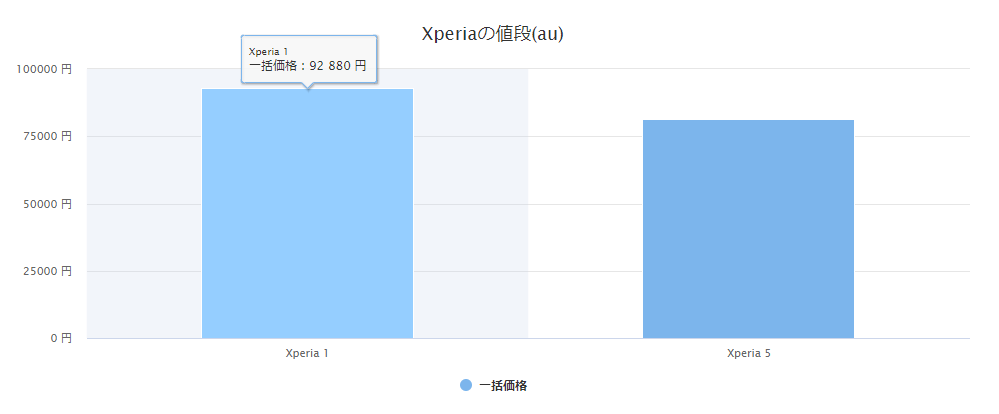
このように、桁区切りがスペースで表示されます。Xperia 1の値段を92 880円から、92,880円に表示したい場合は下記のようにします。
桁区切りで表示
import HighchartsとHighcharts.setOptionsを追加します。
Graph.vue
import { Chart } from 'highcharts-vue';
+ import Highcharts from 'highcharts';
+ Highcharts.setOptions({
+ 	lang: {
+ 		thousandsSep: ','
+ 	}
+ });
export type DataType = {
Graph.vue
<template>
	<div>
		<highcharts :options="graph"></highcharts>
	</div>
</template>

<script lang="ts">
	import { Component, Vue } from 'vue-property-decorator';
	import { Chart } from 'highcharts-vue';
	import Highcharts from 'highcharts';
	Highcharts.setOptions({
		lang: {
			thousandsSep: ','
		}
	});

	export type DataType = {
		graph: any;
	}

	@Component ({
		components: {
			highcharts: Chart
		},
	})
	export default class Graph extends Vue {
		data (): DataType {
			return {
				graph: {
					title: {
						text: 'Xperiaの値段(au)'
					},
					xAxis: {
						categories: ['Xperia 1', 'Xperia 5'],
						crosshair: true
					},
					yAxis: {
						title: false,
						labels: {
							format: '{value} 円'
						},
						opposite: false,
					},
					credits: {
						enabled: false
					},
					tooltip: {
						pointFormat: '{series.name}:{point.y:,.0f} 円'
					},
					series: [{
						name: '一括価格',
						type: 'column',
						data: [92880, 81400],
						marker: {
							enabled: true
						},
					}],
				}
			}
		}
	}
</script>

<style>
	div {
		width: 80%;
		height: auto;
		margin: 20px auto auto auto;
	}
</style>
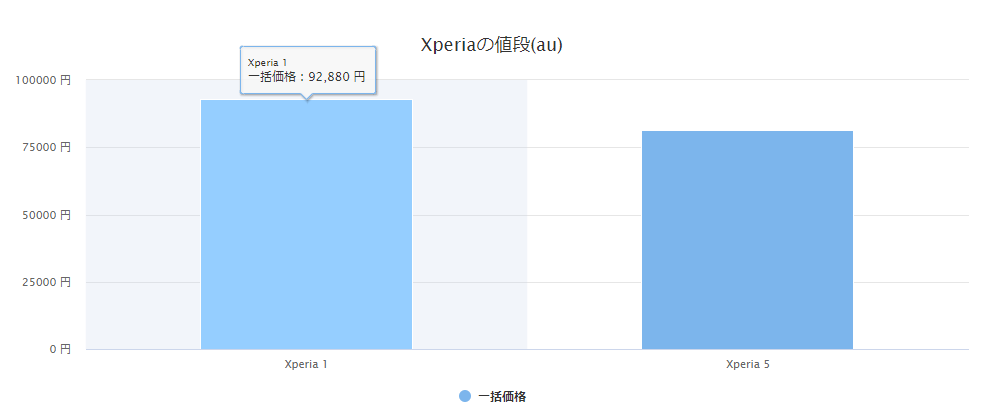
3桁区切りで表示することができました。
おわりに
合わせてこちらもご覧ください。
Vue(Vue-CLI)とTypeScriptでhighchartsのグラフ表示